
Table 1
Monthly variation in morphometric parameters and SGR of V. contectus over a 6-month period.
| Time (Month) | SL | SW | Aperture length (AL) | AW | BWH | Weight (W) (g) | SGRL (%) | SGRW (%) |
|---|---|---|---|---|---|---|---|---|
| 0 | 11.22 ± 2.49 | 8.24 ± 2.68 | 8.38 ± 1.79 | 6.25 ± 1.70 | 12.62 ± 2.36 | 0.42 ± 0.40 | - | - |
| 1 | 14.37 ± 2.86 | 9.62 ± 2.61 | 8.76 ± 1.68 | 7.22 ± 1.71 | 13.90 ± 2.83 | 0.69 ± 0.53 | 0.82 | 1.65 |
| 2 | 15.25 ± 2.41 | 10.86 ± 2.81 | 9.72 ± 2.01 | 7.99 ± 1.72 | 14.75 ± 2.39 | 0.73 ± 0.55 | 0.20 | 0.19 |
| 3 | 16.39 ± 2.32 | 12.05 ± 1.79 | 10.23 ± 1.52 | 8.84 ± 1.28 | 15.88 ± 2.32 | 1.19 ± 0.54 | 0.24 | 1.63 |
| 4 | 17.21 ± 1.81 | 12.32 ± 2.11 | 10.24 ± 1.62 | 8.91 ± 1.53 | 16.72 ± 1.83 | 1.23 ± 0.56 | 0.16 | 0.11 |
| 5 | 18.09 ± 2.24 | 13.56 ± 1.83 | 11.50 ± 1.23 | 9.75 ± 1.34 | 17.39 ± 2.16 | 1.61 ± 0.64 | 0.17 | 0.90 |
| 6 | 19.84 ± 1.82 | 14.98 ± 1.12 | 12.20 ± 0.94 | 10.85 ± 0.68 | 19.34 ± 1.82 | 2.21 ± 0.58 | 0.31 | 1.05 |
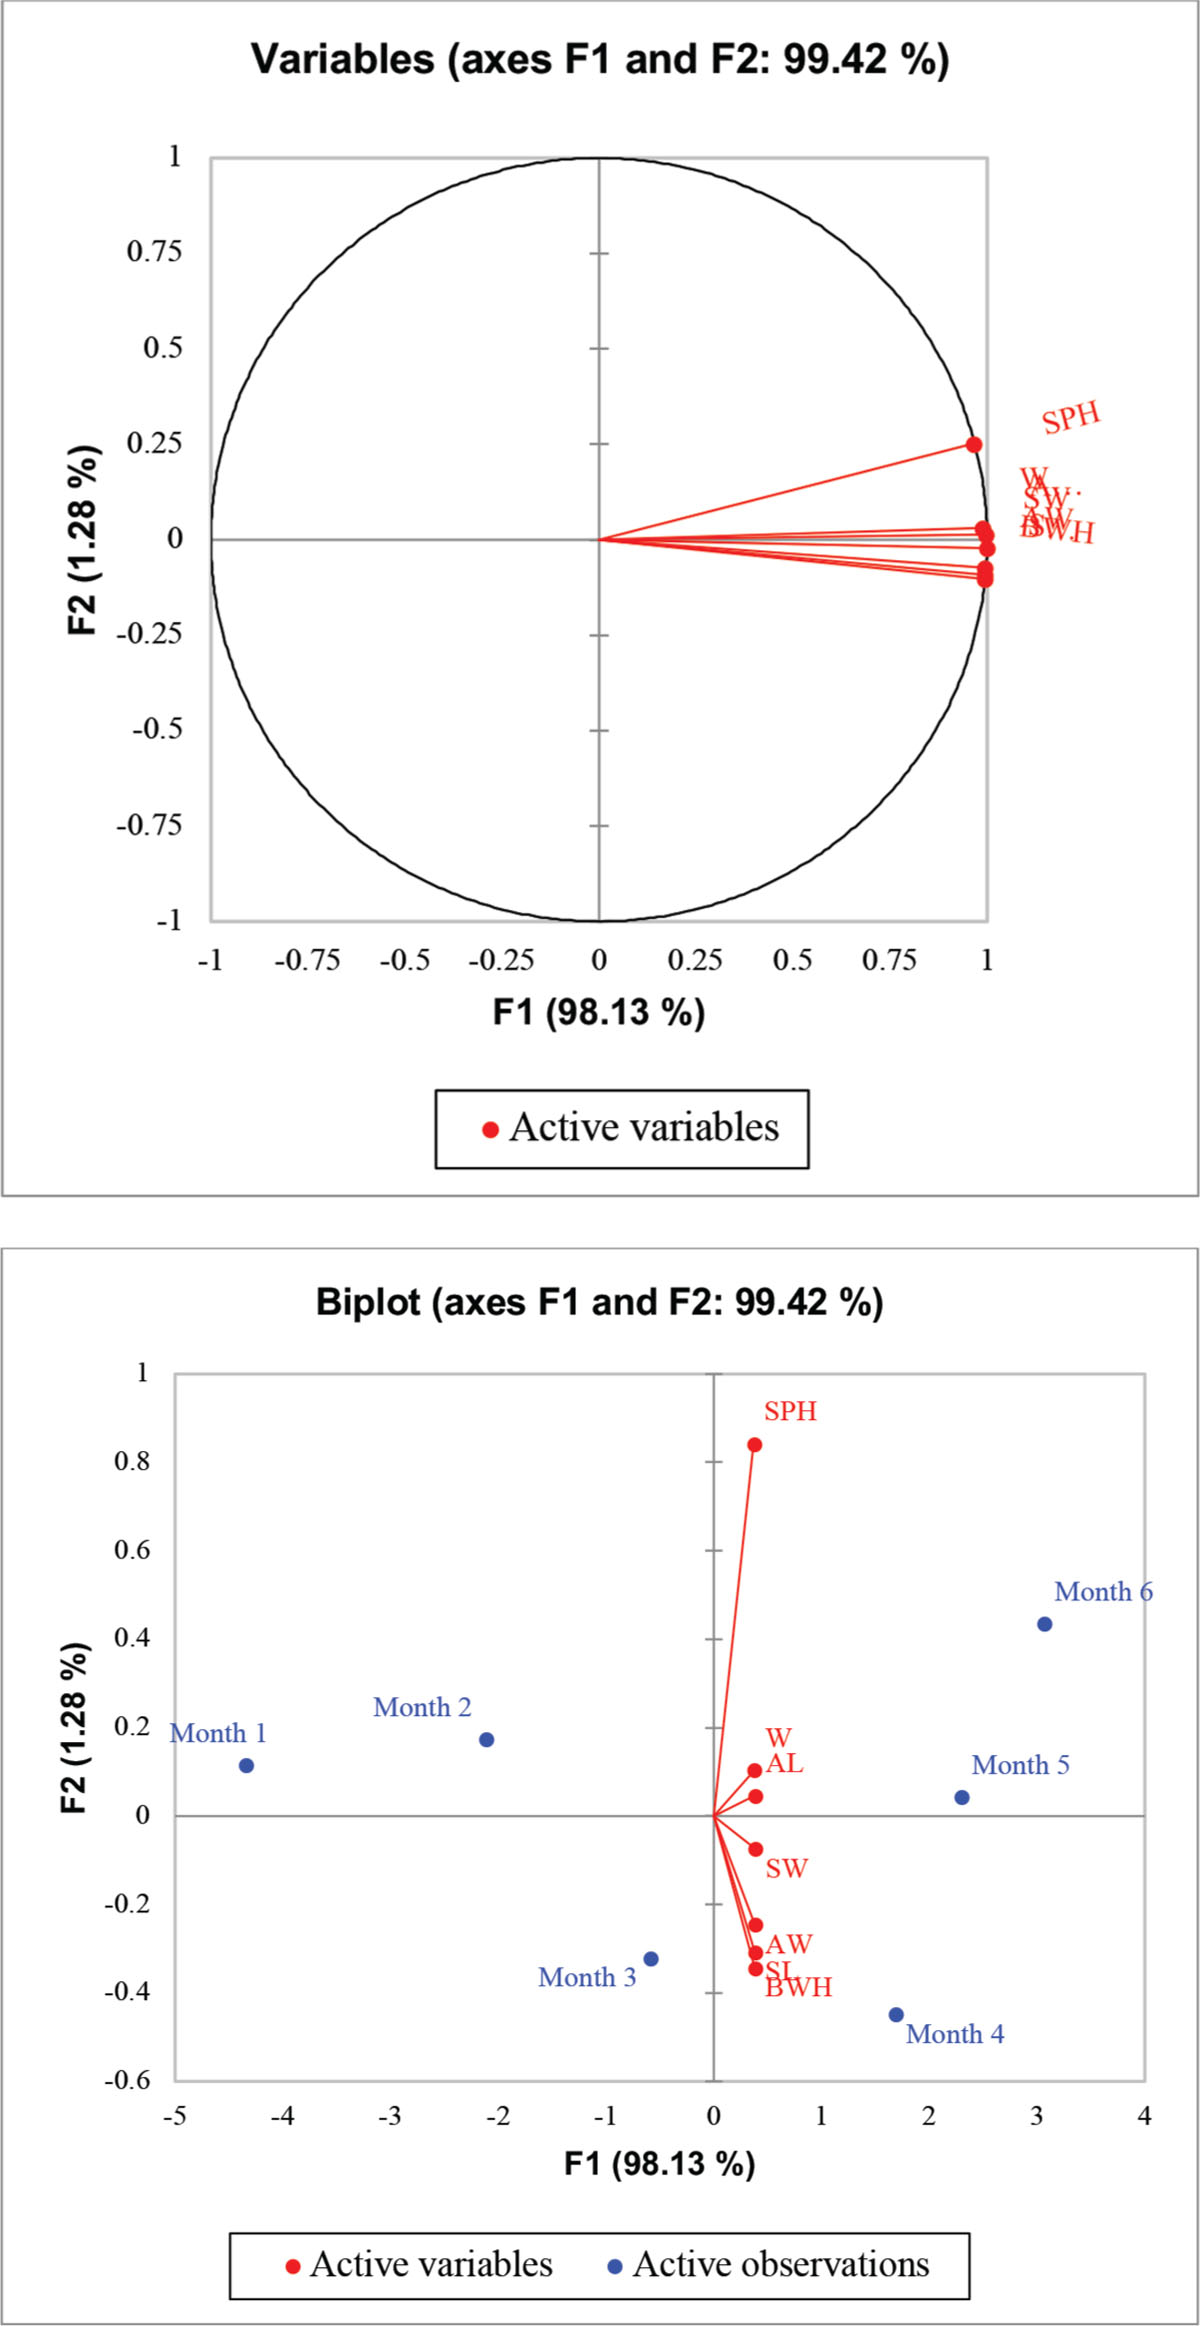
Figure 1
PCA illustrating snail morphometric parameters: SPH, SL, W (weight), SW, AL (aperture length), AW, and BWH. AW, aperture width; BWH, body whorl height; PCA, principal component analysis; SL, shell length; SPH, spiral height; SW, shell width.
Table 2
Percentage composition of FAs in V. contectus under laboratory culture conditions.
| FAs | Muscle (%) |
|---|---|
| SFA | |
| C6:0 (Caproic acid) | 1.43 ± 2.66 |
| C8:0 (Caprylic acid) | 1.88 ± 0.92 |
| C10:0 (Capric acid) | 1.37 ± 0.82 |
| C11:0 (Undecylic acid) | 0.45 ± 0.45 |
| C12:0 (Laurik asit) | 0.86 ± 0.65 |
| C13:0 (Tridecylic acid) | 0.19 ± 0.36 |
| C14:0 (Miristik asit) | 1.13 ± 0.63 |
| C15:0 (Pentadekanoik asit) | 0.81 ± 0.80 |
| C16:0 (Palmitik asit) | 7.39 ± 4.41 |
| C17:0 (Margarinik asit) | 7.46 ± 4.63 |
| C18:0 (Stearik asit) | 10.86 ± 5.21 |
| C20:0 (Arachidic acid) | 0.45 ± 0.51 |
| C24:0 (Lignocerik asit) | 0.86 ± 0.94 |
| MUFA | |
| C14:1 (Miristoleik asit) | 1.55 ± 1.11 |
| C15:1 (pentadekenoik asit) | 1.51 ± 1.78 |
| C16:1 n−7 (Palmitoleik asit) | 1.43 ± 3.00 |
| C17:1 (Heptadekanoik asit) | 3.02 ± 4.33 |
| C18:1 n-9t (Elaidic acid) | 1.02 ± 0.67 |
| C18:1 n-9c (Oleic acid) | 5.51 ± 9.23 |
| C18:1 n-11 (Vaccenik asit) | 0.44 ± 1.04 |
| C20:1 (Eikosanoik asit) | 0.04 ± 0.11 |
| C22:1 n9 (Erucic acid) | 28.68 ± 19.94 |
| C24:1 (Nervonik asit) | 0.93 ± 0.53 |
| PUFA | |
| C18:2 n−6c (Linoleik asit) | 0.60 ± 1.42 |
| C18:3 n−3 (α-Linolenik asit) | 0.70 ± 0.53 |
| C18:3 n−6 (γ-Linolenik asit) | 0.23 ± 0.42 |
| C20:2 n−6 (Eicosadienoic acid) | 0.86 ± 1.07 |
| C20:3 n−3 (Eikosatrienoik asit) | 0.75 ± 1.20 |
| C20:4 n−6 (Araşidonik asit) | 9.92 ± 17.96 |
| C20:5 n−3 (Eikosapentaenoik asit) | 0.79 ± 0.65 |
| C22:5 n−3 (Dokosapentaenoik asit) | 0.30 ± 0.10 |
| C22:6 n−3 (Dokosaheksaenoik asit) | 0.45 ± 0.46 |
| ΣSFA | 35.66 |
| ΣMUFA | 44.13 |
| ΣPUFA | 14.57 |
| Σn−3 | 2.96 |
| Σn−6 | 11.61 |
| n-3/n−6 | 0.25 |
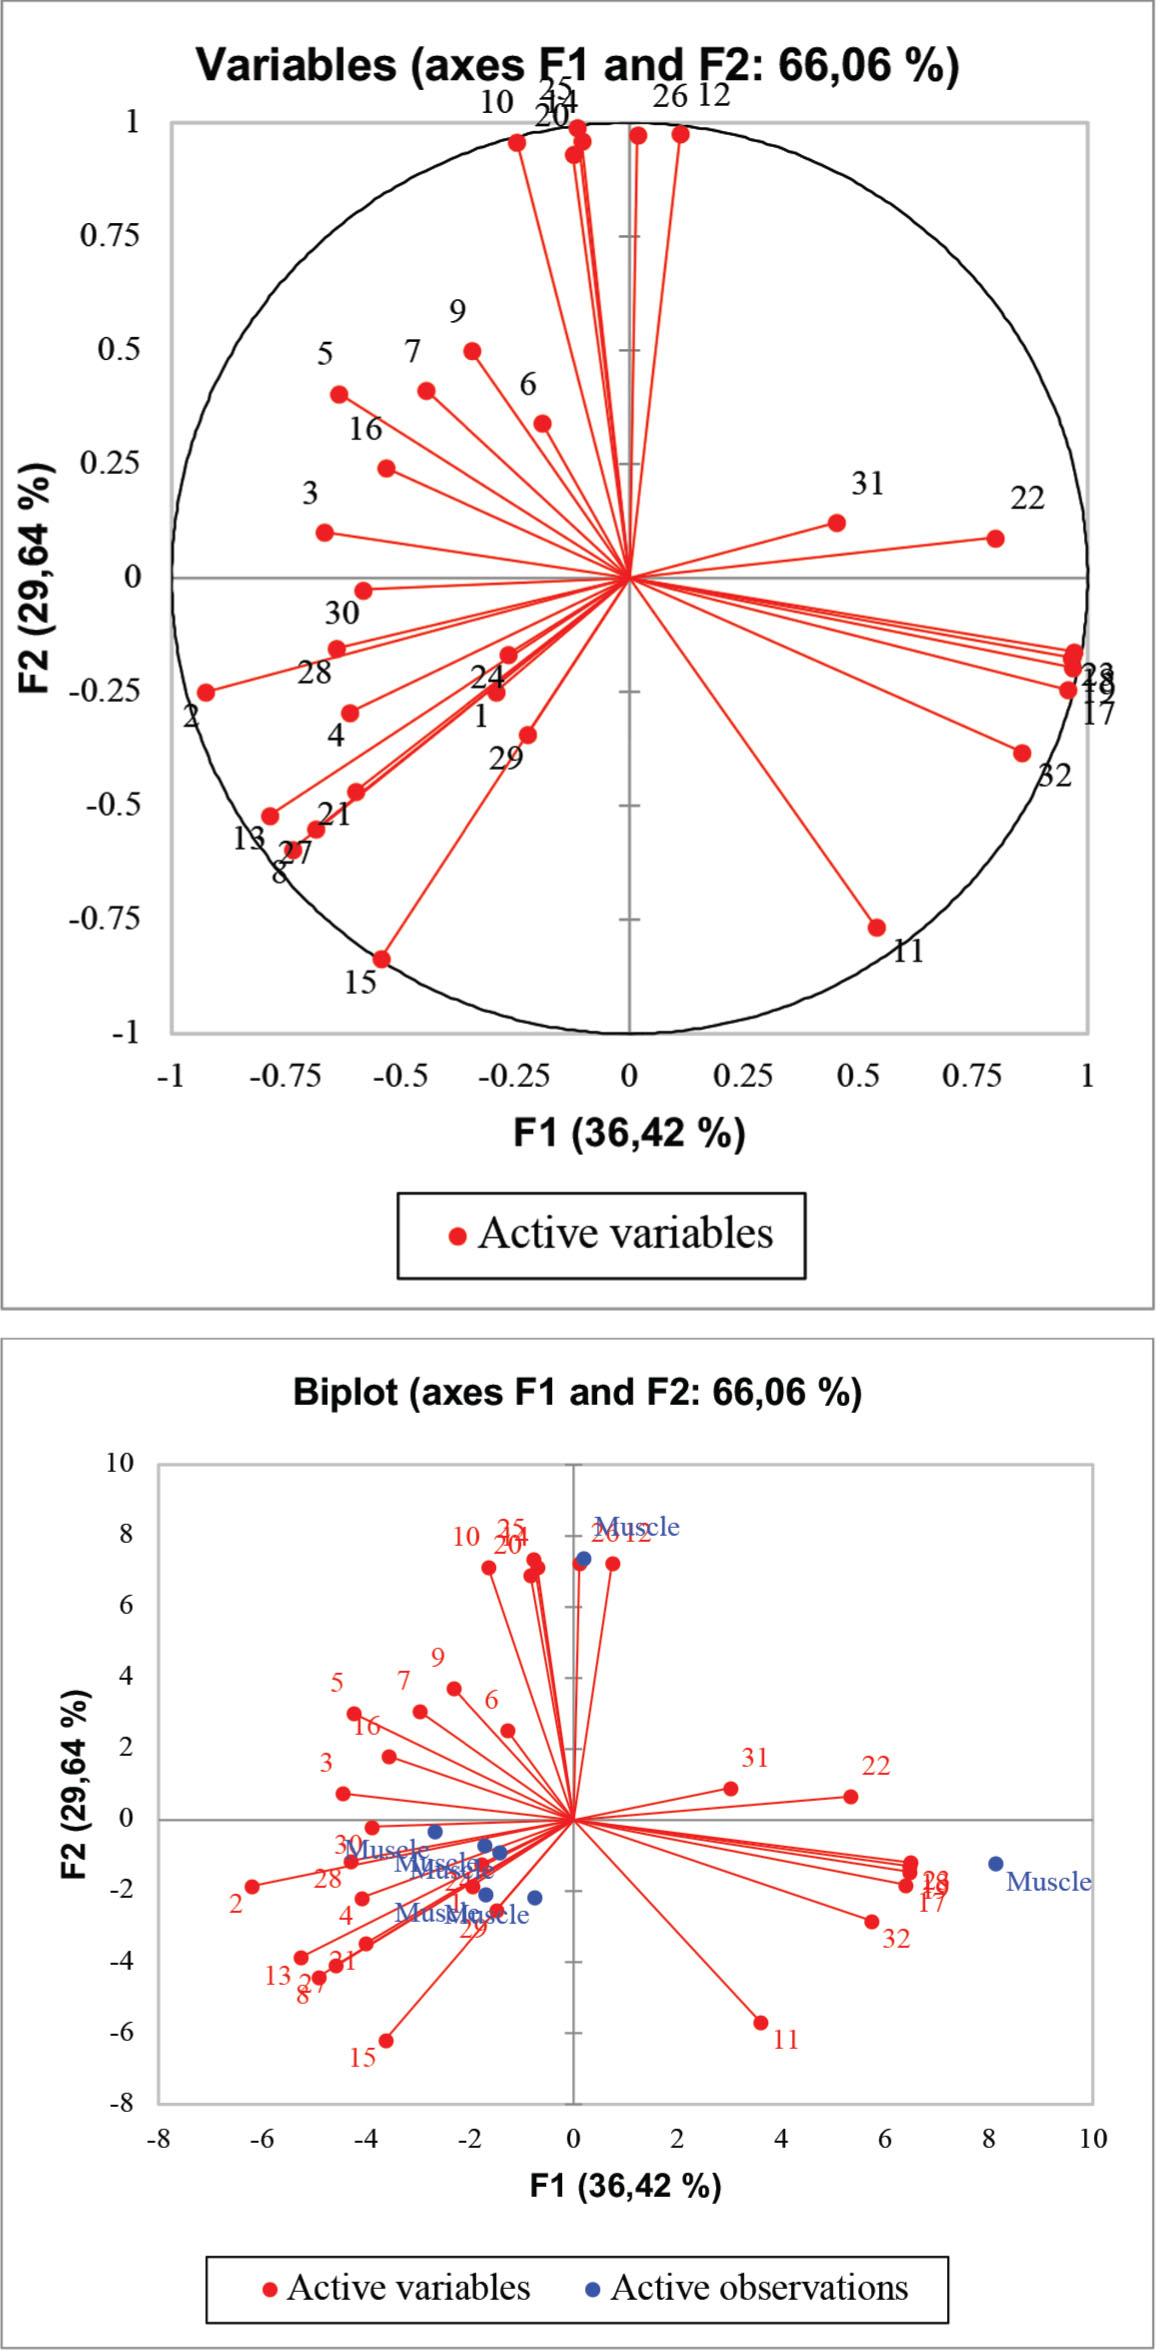
Figure 2
Illustration of scores (A) and loadings (B) from the PCA of FAs in freshwater snail. 1 (C6:0), 2 (C8:0), 3 (C10:0), 4 (C11:0), 5 (C12:0), 6 (C13:0), 7 (C14:0), 8 (C14:1), 9 (C15:0), 10 (C15:1), 11 (C16:0), 12 (C16:1 n−7), 13 (C17:0), 14 (C17:1), 15 (C18:0), 16 (C18:1 n−9t), 17 (C18:1 n−9c), 18 (C18:1 n−11), 19 (C18:2 n−6), 20 (C18:3 n−6), 21 (C18:3 n−3), 22 (C20:0), 23 (C20:1), 24 (C20:2 n−6), 25 (C20:3 n−3), 26 (C20:4 n−6), 27 (C22:1 n−9), 28 (C20:5 n−3), 29 (C24:0), 30 (C24:1), 31 (C22:5 n−3), 32 (C22:6 n−3). FA, fatty acid; PCA, principal component analysis.
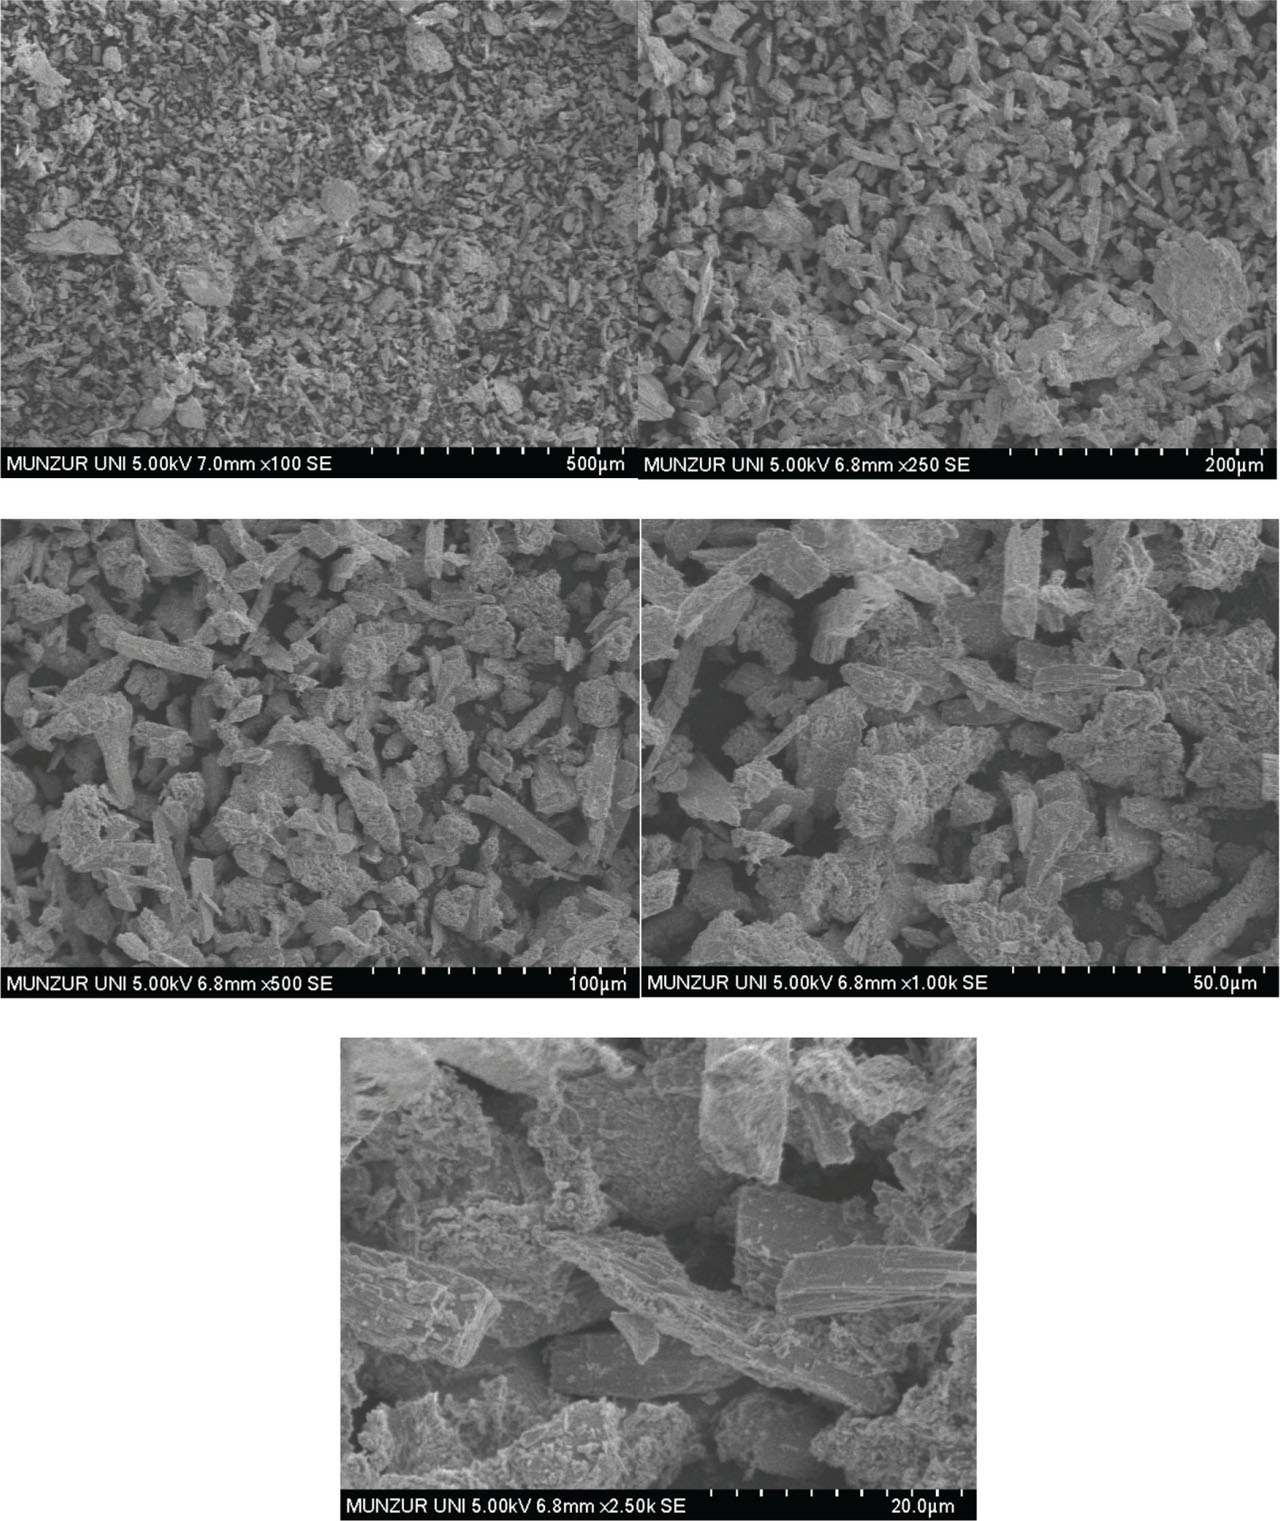
Figure 3
SEM micrographs of cross-sectional view of V. contectus shells at different magnifications. SEM, scanning electron microscope.
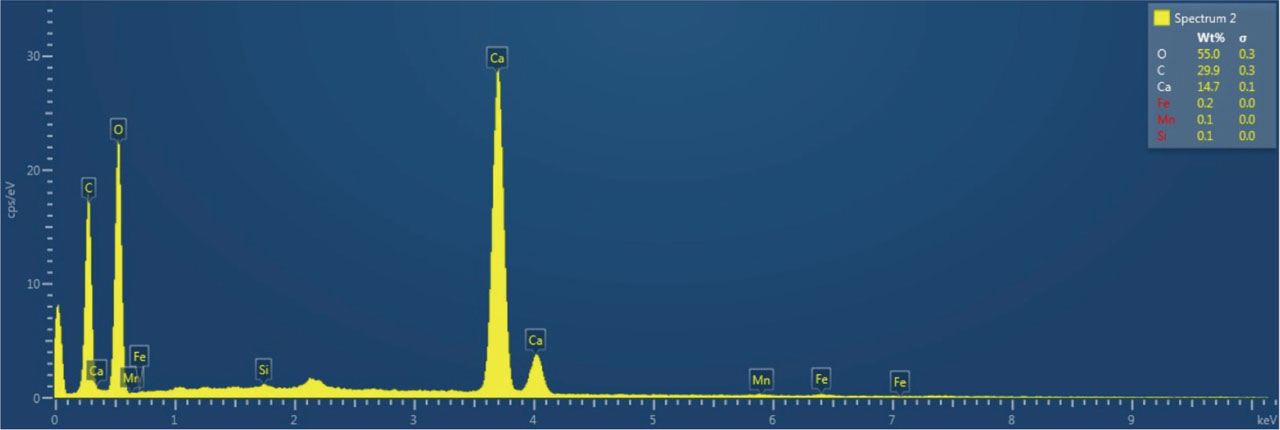
Figure 4
The SEM-EDS of cross sectioned surface of shells V. contectus. SEM-EDS, Scanning electron microscope-energy-dispersive X-ray spectroscopy.