
1. Introduction
Coastal lagoons are among the most productive ecosystems globally, serving as transition zones between marine and freshwater environments (Acarlı et al., 2009). These systems provide vital feeding, spawning, and nursery grounds for numerous fish species, thereby constituting essential habitats (Franco et al., 2006; Sousa et al., 2013). Due to their rich biological diversity, many coastal lagoons play a crucial role in supporting regional fisheries (Ekinci & Bayrak, 2015; Tosunoğlu et al., 2017).
A prominent example is the Küçükçekmece Lagoon, a coastal system located in the Istanbul province of northwestern Türkiye that maintains a connection to the Marmara Sea. Küçükçekmece Lagoon is an ecologically and socioeconomically important coastal ecosystem that supports recreational and fisheries activities. However, rapid urbanization in the surrounding area has subjected the lagoon to multiple anthropogenic pressures, including pollution inputs from inflowing streams, domestic and industrial discharges, and land-use changes within its catchment (Altun et al., 2009; Gürevin et al., 2017; Polge et al., 2010). These factors have contributed to alterations in the lagoon’s environmental conditions and ecological functioning. Due to its transitional nature, the lagoon has maintained a diverse fish community from the past to the present, comprising marine, brackish, and freshwater species (Acara & Gözenalp, 1959; Meriç, 1980, 1986; Saç et al., 2026). Currently, marine and brackish-water adapted species—most notably A. pontica, as well as C. auratus, E. encrasicolus, K. caucasica, and N. melanostomus—are observed in the lagoon nearly year-round (Saç et al., 2026). Investigating the growth characteristics of these species in the Küçükçekmece Lagoon is of paramount importance; this is because the ecosystem is under intense urban pressures and experiences a significant increase in salinity, driven by its marine connection with the Marmara Sea and the disruption of freshwater inflows (Altun et al., 2009; Coskun et al., 2008; Saç et al., 2026; Sönmez & Sivri, 2022). These environmental stressors and hydrological alterations can induce direct physiological stress in fish populations, alter the composition or availability of food resources, and modify habitat quality, ultimately affecting the somatic growth, well-being, and morphological development of the fish (Canosa & Bertucci, 2023; Wannas & Mohammed, 2025). To understand the dynamics of such communities, under shifting environmental gradients, length–weight relationships (LWRs) and condition factors (CF) are widely used in fisheries biology and aquatic ecology (Froese, 2006; Le Cren, 1951; Tesch, 1968). These metrics describe the relationship between fish length and body weight, enabling the estimation of biomass from length data, the determination of growth models, and they also serve as vital indicators to evaluate how target species physiologically adapt or respond to current environmental conditions by assessing the condition status of fish populations (Sánchez-González et al., 2020; Tarkan et al., 2009).
Despite the ecological importance, information regarding the biological characteristics of fish populations in Küçükçekmece Lagoon remains limited. In particular, few studies have specifically established LWRs for the fish species inhabiting the lagoon (Altun, 1986; Aydoğan & Özuluğ, 2020; Tarkan et al., 2006). Such information is of great importance for understanding the growth characteristics and providing fundamental biological data for future ecological and fisheries research on the lagoon ecosystem. Therefore, this study aims to determine the LWRs and CF of key fish species inhabiting the Küçükçekmece Lagoon (A. pontica, C. auratus E. encrasicolus, K. caucasica, and N. melanostomus) living within this lagoon system. It is expected that these results will contribute to the existing body of knowledge regarding lagoonal fish biology and provide a baseline for future monitoring and management efforts in the region.
2. Materials and methods
The fish samples analyzed in this study were collected during sampling surveys conducted between September 2023 and August 2024. Sampling was conducted across seven distinct stations within the lagoon using gillnets (both benthic and pelagic) and a seine net. Sampling at coastal stations (average depth of 4 m) was conducted using standard benthic nets measuring 30 m in length and 1.5 m in height, with 12 different mesh sizes ranging from 5 mm to 55 mm. In the central part of the lagoon, in the area where the depth reaches 20 m, a pelagic net 27.5 m long and 6.0 m high, with 11 different mesh sizes ranging from 6.25 mm to 55 mm, was used. In addition, a seine net was used along the coastline; it was 15 m long and 1.2 m high, with a mesh size of 5 mm on the wings and 1 mm in the cod-end. All gillnet operations were performed in accordance with the ‘TS EN 14757 Water Quality’ standards of the European Water Framework Directive (European Committee for Standardization [CEN], 2015). Specimens captured alive were immediately removed from the sampling gear and euthanized using an anesthetic overdose of clove oil (100 mg/L). The locations of the sampling stations were illustrated in Fig. 1 using QGIS 3.44.3 Solothurn.
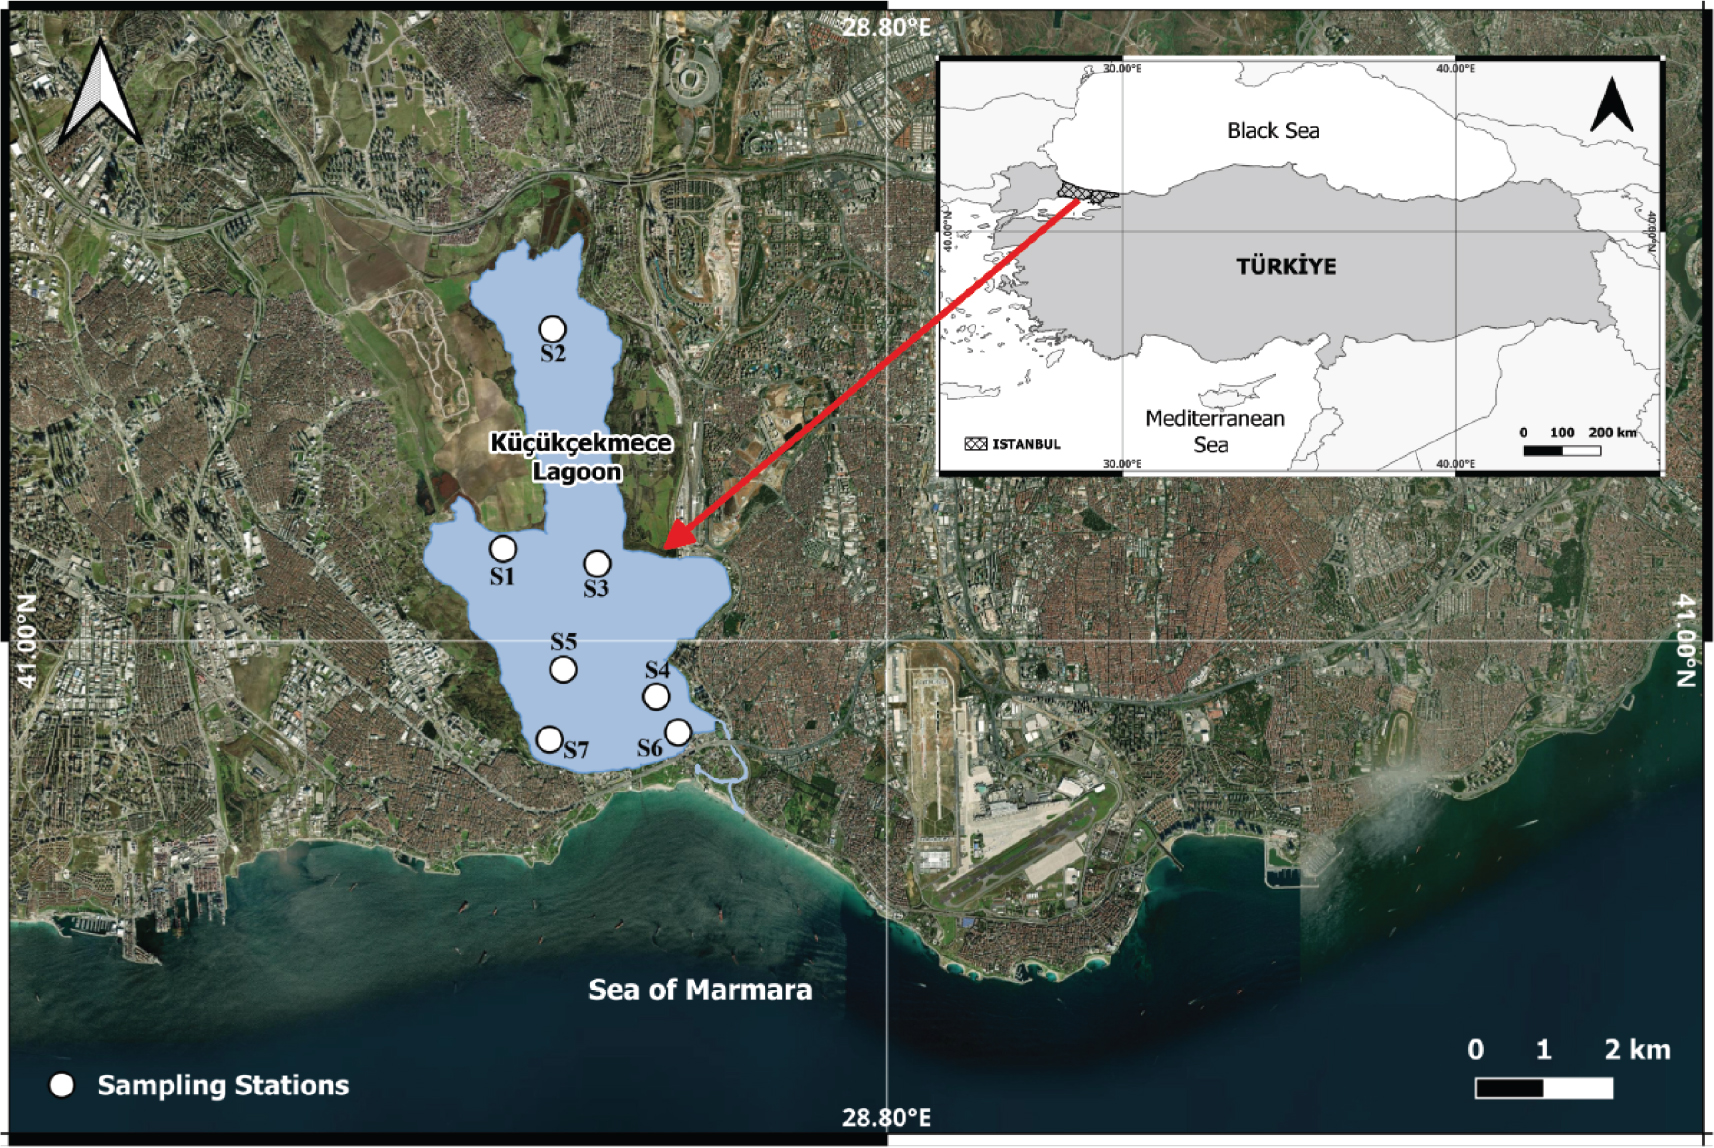
Figure 1
Sampling stations in Küçükçekmece Lagoon.
For each specimen, the standard (SL), fork (FL), and total (TL) lengths were measured to the accuracy ruler 0.1 cm, and total body weight was determined to the accuracy of 0.0001 g. The LWRs were estimated using the equation W = aLb (Froese, 2006; Le Cren, 1951), where W is the body weight (g), L is the total length (TL, cm), and a and b are the regression parameters. The significance of the deviation of the b (growth coefficient) from the theoretical isometric value (b = 3) was tested using a Student’s t-test following Zar (1999). Length–length relationships (LLRs) were calculated using linear regression analysis to ensure comparability with other studies employing different length metrics. The 95% confidence interval of the b (slope) was calculated using the formula CI = b ± (t0.05(n-2) ×SE), where SE represents the standard error of b (King, 2007). In addition, the CF was calculated according to Fulton’s CF equation, CF = (W/Lb) × 100 (Ricker, 1975).
3. Results
The number of individuals (n), ranges of TL (cm) and W (g), estimated values of LWR parameters (a, b, and R2) and CF values for the five species captured in the Küçükçekmece Lagoon are presented in Table 1. Accordingly, the b values obtained from the LWR equations ranged from 3.071 (for A. pontica) to 3.454 (for N. melanostomus). It was found that the growth patterns of all the species studied exhibited allometric growth (p > 0.05). The R2 values were above 0.95 for all five species and the highest value recorded as 0.9897 for C. auratus. The lowest CF value of 0.27 ± 0.03 was observed in the E. encrasicolus, while the highest value of 2.00 ± 0.07 was recorded for K. caucasica. Table 2 presents the estimated LLR parameters for the five fish species; all R2 values exceeded 0.95, indicating highly significant linear relationships.
Table 1
Growth parameters of five fish species from the Küçükçekmece Lagoon.
| Fish species | N | a | b | 95% CI (b) (min. - max.) | R2 | Growth type | TL, cm (min. - max.) | W, g (min. - max.) | CF ± SD |
|---|---|---|---|---|---|---|---|---|---|
| Familia: Atherinidae A. pontica Eichwald, 1831 | 686 | 0.007 | 3.071 | 3.050–3.091 | 0.9703 | A (+) | 1.7–12.5 | 0.0304–17.6895 | 0.65 ± 0.07 |
| Familia: Engraulidae E. encrasicolus (Linnaeus, 1758) | 321 | 0.003 | 3.402 | 3.363–3.441 | 0.9581 | A (+) | 3.5–13.4 | 0.2025–20.0610 | 0.27 ± 0.03 |
| Familia: Gobiidae N. melanostomus (Pallas, 1814) | 77 | 0.006 | 3.454 | 3.321–3.587 | 0.9722 | A (+) | 3.3–9.5 | 0.4533–15.0240 | 0.65 ± 0.08 |
| Familia: Mugilidae C. auratus (Risso, 1810) | 78 | 0.006 | 3.135 | 3.008–3.261 | 0.9897 | A (+) | 3.6–28.2 | 0.1271–208.8800 | 0.65 ± 0.10 |
| Familia: Oxudercidae K. caucasica (Berg, 1916) | 51 | 0.007 | 3.263 | 3.107–3.419 | 0.9806 | A (+) | 1.7–4.2 | 0.0351–0.7135 | 2.00 ± 0.07 |
Table 2
Relationships between total, FL and SL length for five fish species inhabited in Küçükçekmece Lagoon.
| Species | n | FL = aTL - b | SL = aTL - b | ||||
|---|---|---|---|---|---|---|---|
| a | b | R2 | a | b | R2 | ||
| A. pontica | 686 | 0.9248 | –0.0354 | 0.9975 | 0.8582 | 0.0930 | 0.9973 |
| E. encrasicolus | 321 | 0.9169 | 0.0461 | 0.9970 | 0.8517 | 0.1159 | 0.9976 |
| N. melanostomus | 77 | - | - | - | 0.8699 | 0.3125 | 0.9932 |
| C. auratus | 78 | 0.8972 | –0.3067 | 0.993 | 0.7966 | –0.0514 | 0.9994 |
| K. caucasica | 51 | - | - | - | 0.9230 | 0.2517 | 0.9920 |
4. Discussion
A comparative analysis of the LWRs obtained in this study and those documented in previous literature (see Table 3) reveals divergent growth patterns among the investigated species. These differences may stem from variations in population parameters—such as length-weight distribution, sample size, and sex distribution—as well as from temporal and environmental factors such as seasonality and food availability (Saç & Okgerman, 2016). Similarly, fluctuations in CF values across different studies highlight the sensitivity of this index to a variety of intrinsic and extrinsic influences. Such variation is common among fish populations and may be associated with differences in environmental conditions, habitat characteristics, sampling strategies, and analytical approaches among studies (Froese, 2006; Saç & Okgerman, 2016; Tesch, 1968). Therefore, the localized data provided in this study reflect the specific ecological dynamics and productivity of Küçükçekmece Lagoon at the time of sampling.
Table 3
LWR parameters (a and b) and CF reported in various studies across different water bodies.
| Fish species | Locality | n | L, cm (min. -max.) | W, g (min. -max.) | A | b | CF | L | Reference |
|---|---|---|---|---|---|---|---|---|---|
| A. pontica | Küçükçekmece Lagoon | 15 | 3.9–11.1 | - | 0.003 | 3.31 | - | TL | Tarkan et al. (2006) |
| Küçükçekmece Lagoon | 900 | 3.50–11.0 | - | 0.0161 | 2.97 | - | SL | Altun (1986) | |
| Homa Lagoon | 172 | 3.7–9.9 | 0.32–6.30 | 0.0077 | 2.925 | 0.67 ± 0.071 | TL | İlhan and İlhan (2018) | |
| Homa Lagoon | 1640 | 2.4–10.3 | - | 0.0052 | 3.085 | 0.16–0.85 (min.-max.) | TL | Sezen (2005) | |
| Homa Lagoon | 103 | 3.4–10.6 | 0.29–8.40 | 0.0070 | 2.963 | - | TL | Acarlı et al. (2014) | |
| Yumurtalik Lagoon | 82 | 3.6–6.3 | 0.24–1.7 | 0.004 | 3.302 | - | TL | İnnal and Engin (2020) | |
| Bafa Lagoon | 184 | 2.5–10.5 | 0.06–8.42 | 0.004 | 3.327 | - | TL | İnnal and Engin (2020) | |
| Köyceğiz Lagoon | 217 | 2.5–7.9 | 0.1–2.75 | 0.012 | 2.563 | - | TL | İnnal and Engin (2020) | |
| Gediz Estuary | 121 | 3.2–10.1 | 0.24–7.29 | 0.0073 | 2.985 | - | TL | Kara et al. (2018) | |
| Beşgöz Estuary | 14 | 3.2–5.6 | 0.18–1.13 | 0.003 | 3.412 | - | TL | İnnal and Engin (2020) | |
| Kopak Estuary | 14 | 5.2–7.4 | 0.87–2.38 | 0.008 | 2.825 | - | TL | İnnal and Engin (2020) | |
| Köprüçay Estuary | 14 | 4.3–6.8 | 0.5–2.7 | 0.005 | 3.169 | - | TL | İnnal and Engin (2020) | |
| Ceyhan Estuary | 154 | 3.6–7.2 | 0.1–2.3 | 0.007 | 2.987 | - | TL | İnnal and Engin (2020) | |
| Çandarlı Bay/Aegean Sea | 1558 | 1.00–9.40 | 0.004–5.59 | 0.0043 | 3.187 | - | TL | Gürkan et al. (2010) | |
| Erdek Bay/Sea of Marmara | 606 | 2.5–11.2 | - | 0.0045 | 3.215 | - | TL | Keskin and Gaygusuz (2010) | |
| İzmir Bay/Aegean Sea | 138 | 4.8–9.8 | 0.6–4.86 | 0.0048 | 3.165 | - | FL | Özaydın and Taskavak (2006) | |
| Bursa Coast/Sea of Marmara | 22 | 9.2–11.5 | 6.5–12.8 | 0.018 | 2.63 | - | TL | İnnal and Engin (2020) | |
| Zonguldak Coast/Black Sea | 43 | 6.7–10.6 | 2.4–10.5 | 0.007 | 3.098 | - | TL | İnnal and Engin (2020) | |
| Istanbul Coast/Black Sea | 55 | 7.1–9.6 | 2.4–6.9 | 0.009 | 2.87 | - | TL | İnnal and Engin (2020) | |
| Rize Coast/Black Sea | 93 | 8.6–12.5 | 3.9–12.4 | 0.006 | 3.041 | - | TL | İnnal and Engin (2020) | |
| Çanakkale Coast/Aegean Sea | 103 | 3.1–8.5 | 0.2–4.1 | 0.005 | 3.162 | - | TL | İnnal and Engin (2020) | |
| Sea of Marmara | 14 | 7.6–11.7 | 1.84–8.40 | 0.0015 | 3.485 | - | TL | Bök et al. (2011) | |
| Ömerli Reservoir | 442 | 7.7–12.9 | - | 0.0159 | 2.66 | - | TL | Tarkan et al. (2006) | |
| Hirfanlı Reservoir | 323 | 4.09–11.02 | - | 0.027 | 3.2376 | 0.621 ± 0.087 | TL | Kırankaya et al. (2014) | |
| Demirköprü Reservoir | 41 | 3.9–13.6 | 0.4–16.5 | 0.008 | 2.949 | - | TL | İnnal and Engin (2020) | |
| Demirköprü Reservoir | 101 | 6.61–10.48 | 1.84–8.98 | 0.0029 | 3.4227 | - | TL | Güçlü and Küçük (2021) | |
| iznik Lake | 1138 | 2.7–11.9 | 0.10–10.36 | 0.0032 | 3.3366 | 0.506–0.714 (min.-max.) | TL | Gaygusuz (2006) | |
| Sapanca Lake | 381 | 3.2–10.8 | 0.20–7.58 | 0.0076 | 2.8575 | 0.586 ± 0.004 | TL | İlhan et al. (2026) | |
| Gebekirse Lake | 59 | 5.80–9.50 | 1.20–4.04 | 0.008 | 2.884 | 1.064 ± 0.206 | TL | Kurtul et al. (2023) | |
| Eğirdir Lake | 114 | 3.9–6.6 | 0.27–1.45 | 0.006 | 2.781 | - | TL | İnnal and Engin (2020) | |
| Marmara Lake | 101 | 3.70–8.70 | 0.40–5.40 | 0.0084 | 2.908 | - | TL | İlhan and Sarı (2015) | |
| Marmara Lake | 20 | 3.8–4.7 | 0.36–0.64 | 0.001 | 2.58 | - | TL | İnnal and Engin (2020) | |
| Marmara Lake | 19 | 5.93–7.44 | 1.37–2.66 | 0.0082 | 3.9208 | - | TL | Güçlü and Küçük (2021) | |
| Marmara Lake | 185 | 5.6–8.2 | 1.30–3.99 | 0.0059 | 3.118 | 0.75 ± 0.052 | TL | İlhan and İlhan (2018) | |
| E. encrasicolus | Homa Lagoon | 68 | 7.0–11.3 | 2.32–9.35 | 0.0070 | 2.917 | - | TL | Acarlı et al. (2014) |
| İzmir Bay/Aegean Sea | 212 | 9.2–13.9 | 3.6–16.5 | 0.0019 | 3.4207 | - | TL | Şenbahar et al. (2020) | |
| İzmir Bay/Aegean Sea | 513 | 10.5–14.9 | 9.09–23.62 | 0.0116 | 2.840 | - | FL | Özaydın and Taskavak (2006)+ | |
| Mersin Bay | 630 | 4.3–13.7 | 0.39–17.87 | 0.0037 | 3.179 | - | TL | Çiçek et al. (2006) | |
| North-Eastern Mediterranean | 392 | 7.0–17.0 | 2.0–34.99 | 0.0156 | 2.661 | - | TL | Sangun et al. (2007) | |
| Gökçeada Island/North Aegean | 18 | 2.1–3.6 | 0.02–0.13 | 0.002 | 3.229 | - | TL | Altın et al. (2015) | |
| Saros Bay | 212 | 8.1–14.8 | 3.0–17.0 | 0.0052 | 2.9721 | - | TL | Ismen et al. (2007) | |
| East Black Sea | 19 | 6.2–13.5 | 1.72–13.64 | 0.0182 | 2.549 | - | TL | Yeşilçiçek (2015) | |
| Middle Black Sea | 575 | 8.0–14.7 | 2.85–19.14 | 0.0174 | 2.6014 | - | TL | Kalaycı et al. (2007) | |
| Black Sea | 83 | 6.6–11.2 | 1.2–5.53 | 0.0043 | 3.04 | - | TL | Onay and Dalgıç (2021) | |
| Black Sea | 10062 | 5.5–14.5 | 0.9–17.4 | 0.008 | 2.86 | - | TL | Samsun et al. (2017) | |
| Black Sea | 696 | 8.0–13.6 | 3.5–16.4 | 0.0180 | 2.6182 | - | TL | Özdemir and Duyar(2013) | |
| Black Sea | 1588 | 5.9–14.6 | 1.06–18.10 | 0.0124 | 2.711 | - | TL | Kasapoğlu and Düzgüneş (2013) | |
| Black Sea | 312 | 7.4–14.1 | 1.84–22.11 | 0.002 | 3.38 | - | TL | Türker and Bal (2018) | |
| N. melanostomus | Büyükçekmece Lake | 22 | 6.8–9.8 | - | 0.0185 | 2.87 | - | TL | Tarkan et al. (2006) |
| Sapanca Lake | 46 | 3.0–15.1 | 0.26–62.05 | 0.0065 | 3.3555 | 1.295 ± 0.030 | TL | İlhan et al. (2026) | |
| Black Sea | 169 | 9.0–24.6 | 8.83–250.34 | 0.069 | 3.24 | - | TL | Onay and Dalgıç (2021) | |
| Black Sea | 99 | 8.6–19.1 | - | 0.0047 | 3.39 | - | TL | Demirhan and Can (2007) | |
| Black Sea | 172 | 6.5–32.0 | 2.24–313.52 | 0.0114 | 3.088 | - | TL | Kasapoğlu and Düzgüneş (2013) | |
| Black Sea | 73 | 9.1–35.0 | 8.58–381.42 | 0.01 | 3.033 | - | TL | Ak et al. (2009) | |
| Black Sea | 58 | 9.0–26.0 | 8.0–265.0 | 0.0059 | 3.3062 | - | TL | Çalık and Sağlam (2017) | |
| Black Sea | 2408 | 10.50–26.20 | 15.28–212.20 | 0.0069 | 3.1972 | - | TL | Aydın (2021) | |
| C. auratus | Köyceğiz Lagoon | 476 | 6.2–39.3 | 2.34–508.38 | 0.0087 | 2.96 | 0.56–1.30 (min.-max.) | TL | Reis and Ateş (2019) |
| Köyceğiz Lagoon | 589 | 13.1–47.3 | 13.40-1005.16 | 0.0075 | 2.9744 | - | TL | Çiloğlu (2023) | |
| Homa Lagoon | 119 | 15.4–25.5 | 39.00–173.90 | 0.0100 | 2.997 | - | TL | Acarlı et al. (2014) | |
| Golden Horn (Istanbul) | 431 | 13.4–46.8 | - | 0.0127 | 2.89 | - | TL | Kesiktaş et al. (2020) | |
| Gediz Estuary | 81 | 5.3–16.4 | 1.45–44.4 | 0.0091 | 3.035 | - | TL | Kara et al. (2018) | |
| Black Sea | 324 | 16.5–38.8 | 37.76–568.56 | 0.0158 | 2.8086 | 0.739–0.963 (min.-max.) | TL | Kartal et al. (2025) | |
| K. caucasica | Eğirdir Lake | 400 | - | - | 0.0129 | 2.8494 | - | TL | Güçlü and Erdoğan (2017) |
| Büyükçekmece Lake | 6 | 2.2–3.4 | - | 0.0072 | 3.22 | - | TL | Tarkan et al. (2006) |
In the present study, the b value for A. pontica, determined to be 3.071, indicates a positive allometric growth. While this finding aligns with the observations of Tarkan et al. (2006), it contrasts with the results of Altun (1986), who reported isometric growth within the same geographical region. A broader review of the literature (Table 3) reveals that the b values for this species vary significantly, ranging from a minimum of 2.563 (Innal & Engin, 2020) to a maximum of 3.9208 (Güçlü & Küçük, 2021). These variations in growth patterns appear to be closely linked to habitat characteristics. Specifically, positive allometry is predominantly documented in lagoon and marine populations, whereas isometric or negative allometric growth is more commonly reported in reservoir and lake environments. This pattern can be attributed to the higher nutrient availability and primary productivity typical of dynamic coastal and marine ecosystems, which allow fish to allocate more energy toward somatic weight gain rather than just structural length extension (Amara et al., 2007; Selleslagh & Amara, 2008). Furthermore, the CF obtained in this study (0.65 ± 0.07) was relatively higher than the values previously reported in the literature (Table 3). These elevated values may reflect relatively favorable environmental conditions for the physiological condition of A. pontica in the study area compared to other investigated habitats, although the lack of nutrient composition analyses and information on food-resource diversity precludes definitive conclusions regarding the underlying causes.
Regarding E. encrasicolus, the b value obtained in this study (3.402) indicates a positive allometric growth pattern. This finding is noteworthy as it deviates from the general trend observed in the literature; however, the review of previous studies (Table 3) shows that negative allometry is the predominant growth model for this species in most regions. While the b values reported by other researchers range from 2.549 (Yeşilçiçek, 2015) to 3.4207 (Şenbahar et al., 2020), the results of the present study suggest a more robust weight gain relative to length increment for the Küçükçekmece Lagoon population. Although a direct comparison of the CF could not be performed due to the lack of reported CF data in the studies listed in Table 3, the value obtained in this study (0.27 ± 0.03) is considered relatively high for the species. The combination of positive allometric growth and an elevated CF suggests that the lagoon provides a highly productive environment with sufficient prey availability, allowing E. encrasicolus to maintain a better physiological condition compared to many marine and coastal populations previously studied (Gürevin et al., 2017; Köker et al., 2021; Polge et al., 2010).
Similar growth trends were observed for both N. melanostomus and C. auratus, characterized by positive allometry and notably higher CF compared to previous records. In the case of N. melanostomus, the b value obtained (3.454) indicates positive allometric growth. The b value obtained in the present study falls within the range reported for most previously investigated populations, which varies between 2.87 (Tarkan et al., 2006) and 3.39 (Demirhan & Can, 2007). Similarly, C. auratus exhibited positive allometry (3.135), representing a shift from the isometric growth typically reported for this species in other studies, where b values varied between 2.8086 (Kartal et al., 2025) and 3.035 (Kara et al., 2018). Furthermore, both species yielded higher CF values in this study, 0.65 ± 0.08 for N. melanostomus and 0.65 ± 0.10 for C. auratus— however, these values are lower than those reported by İlhan et al. (2026) and Kartal et al. (2025). The consistently high CF values and positive allometric growth patterns may reflect favorable environmental conditions for the species in Küçükçekmece Lagoon relative to some previously reported habitats (Gürevin et al., 2017; Köker et al., 2021; Polge et al., 2010), although direct evidence regarding food availability and habitat quality was not assessed in the present study. However, discrepancies in the CF formulas CF=(W/Lb)×100(or)CF=(W/L3)×100utilized may also account for these species being represented by lower CF values compared to other populations, despite demonstrating a positive allometric growth pattern.
Regarding K. caucasica, a small-sized gobiid species for which there is relatively little biological data in the literature, the b value was found to be 3.263, indicating positive allometric growth. This finding is consistent with the results of Tarkan et al. (2006), who observed positive allometry (3.22) in Lake Büyükçekmece. However, Güçlü and Erdoğan (2017) observed isometric growth (2.8494) for the same species in Lake Eğirdir. The divergence in growth strategies among these limited existing studies may be attributed to the species’ sensitivity to habitat variations and food availability, given its small body size and short lifespan. Furthermore, due to the lack of data regarding the condition of this species, a direct comparison of the CF was not possible, as previous studies did not report this parameter. In this context, the CF value of 2.00 ± 0.07 obtained in the present study provides a significant baseline for future ecological assessments. This CF value indicates that the population in Lake Küçükçekmece has maintained its physiological condition, likely due to the lake’s primary productivity being in good condition (Gürevin et al., 2017; Köker et al., 2021; Polge et al., 2010), despite its small size.
To facilitate comparisons with studies using different length measurements, LLRs were calculated, and the resulting correlation coefficients are presented in Table 2. Strong linear relationships were observed among total, fork, and standard-length measurements for all species. These highly significant correlations (R2 > 0.95) provide the reliable conversion standards necessary for comparing datasets for the investigated populations.
In conclusion, this study highlights the ecological importance of Küçükçekmece Lagoon as a highly productive habitat that supports both commercial and recreational fisheries on a regional scale. The positive allometric growth patterns and favorable CF observed in the studied species suggest that Küçükçekmece Lagoon may provide conditions conducive to fish growth and physiological well-being. Nevertheless, further studies assessing nutrient availability and other environmental factors are needed to clarify the mechanisms responsible for these patterns. Notably, these findings constitute the first comprehensive documentation of LWR and CF parameters for several species within this specific ecosystem, addressing a significant gap in the regional literature. These data provide a vital biological baseline not only for K. caucasica but also for other understudied species and will serve as a fundamental reference for future ecological monitoring. Ultimately, the results of this research are expected to inform sustainable fisheries management strategies and contribute to conservation efforts in this unique lagoon environment, which is under pressure from anthropogenic and environmental factors.
Acknowledgement
We would like to thank the Republic of Türkiye Ministry of Agriculture and Forestry for the legal permission to conduct this research. We would like to express our appreciation to the Istanbul University Scientific Research Project Commission, which financially supported this study (BAP-project no: FBA-2023-40093). We also thank local fisherman Ayhan Koca, Merve Sabırcan, Büşra Uygun, and Ahmet Burak Damar for helping during the field surveys and laboratory analysis.
Notes
[4] Contributed by Author contributions
ÖDY: Substantial contribution in the concept and design of the study; contribution to data collection, data analysis, and interpretation; contribution to manuscript preparation. İŞ: Contribution to data collection. Hİ: Contribution to data collection. TY: Contribution to data collection. SA: Contribution to data collection. MÖ: Contribution to data collection. GS: Contribution to data collection, data analysis, and interpretation; contribution to manuscript preparation.
[5] Data availability
All data generated or analyzed during this study are included in this paper.
[6] Conflicts of interest Conflict of interest
The authors have no relevant financial or non-financial interests to disclose.
[7] Ethical approval
Ethical approval for this study was obtained from the Local Ethics Committee for Animal Experiments of Istanbul University (Date: 24.05.2023, No: 1775832).
[8] Consent to participate
Not applicable.
[9] Consent for publication
Not applicable.