
Figure 1
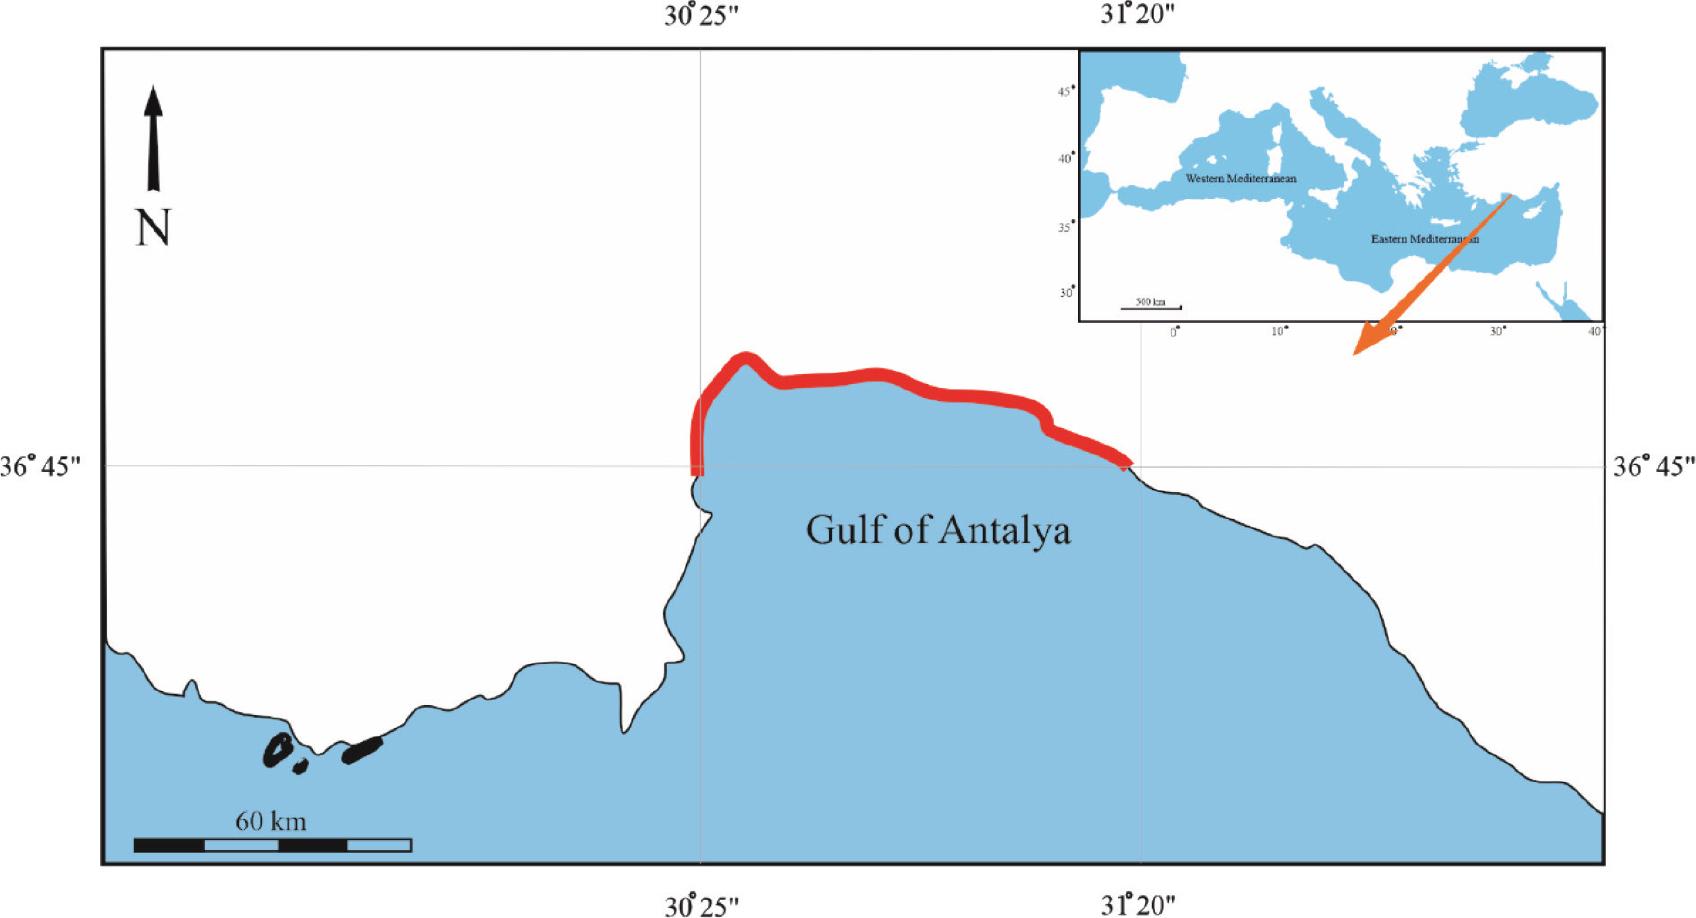
Figure 2
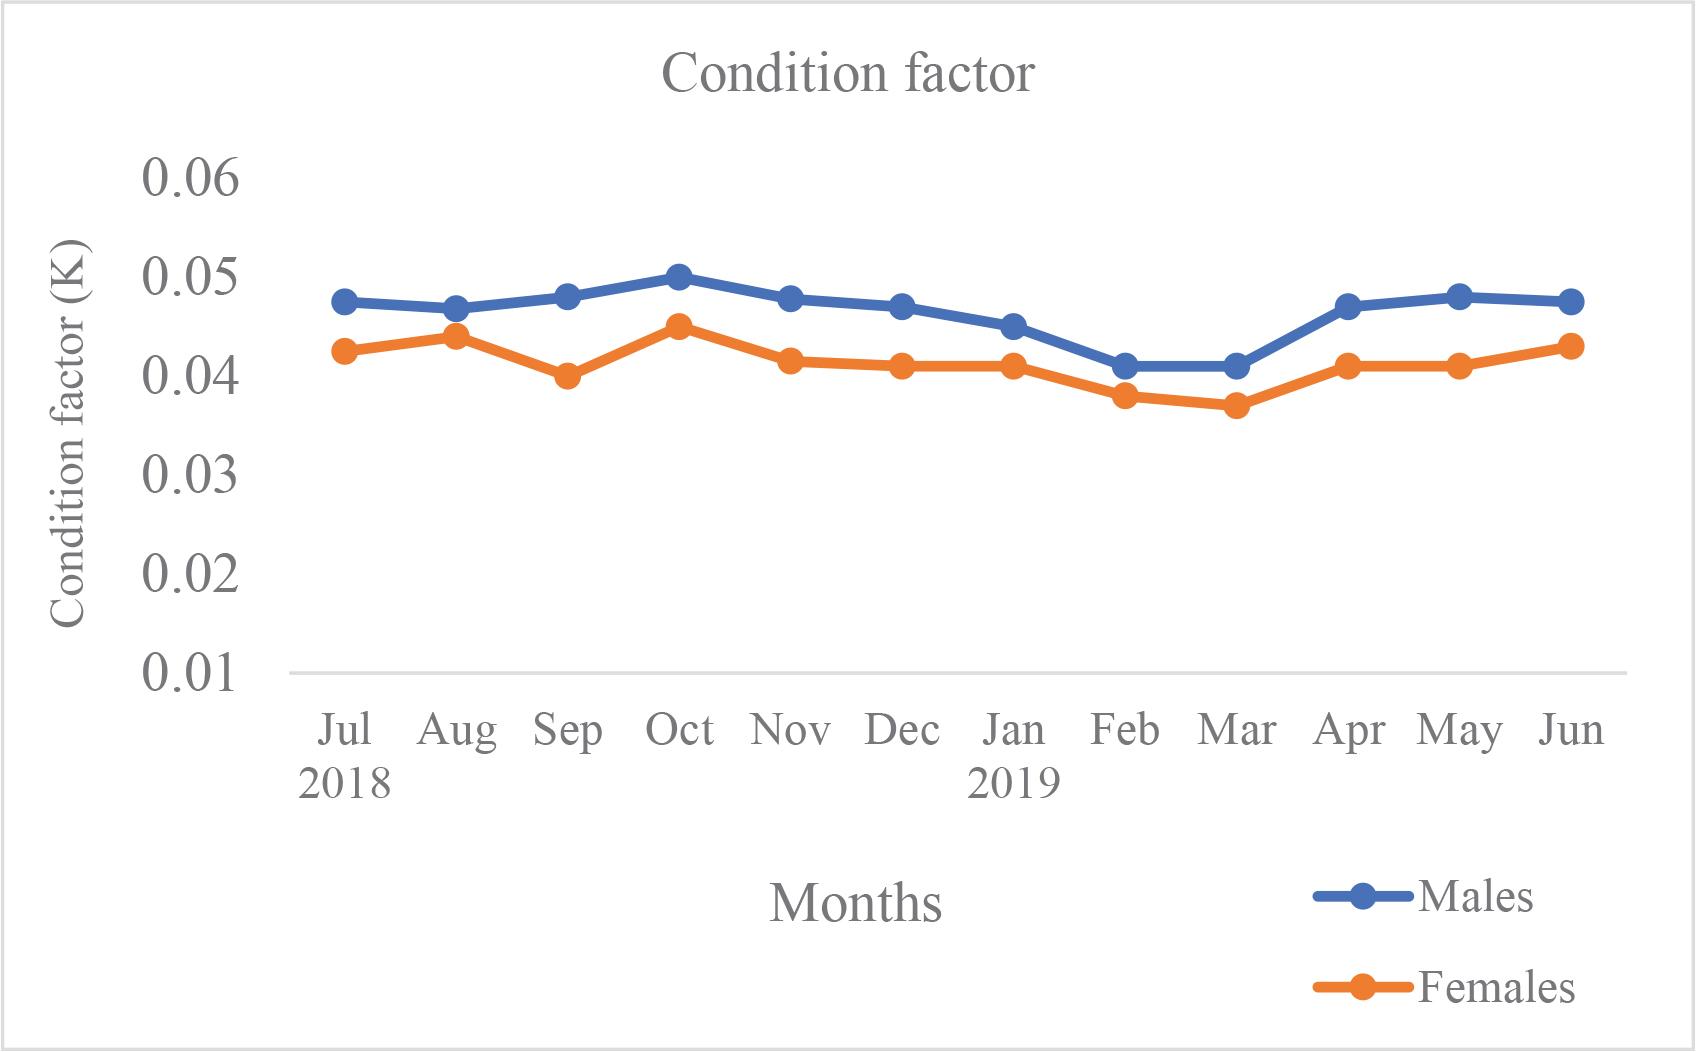
Figure 3
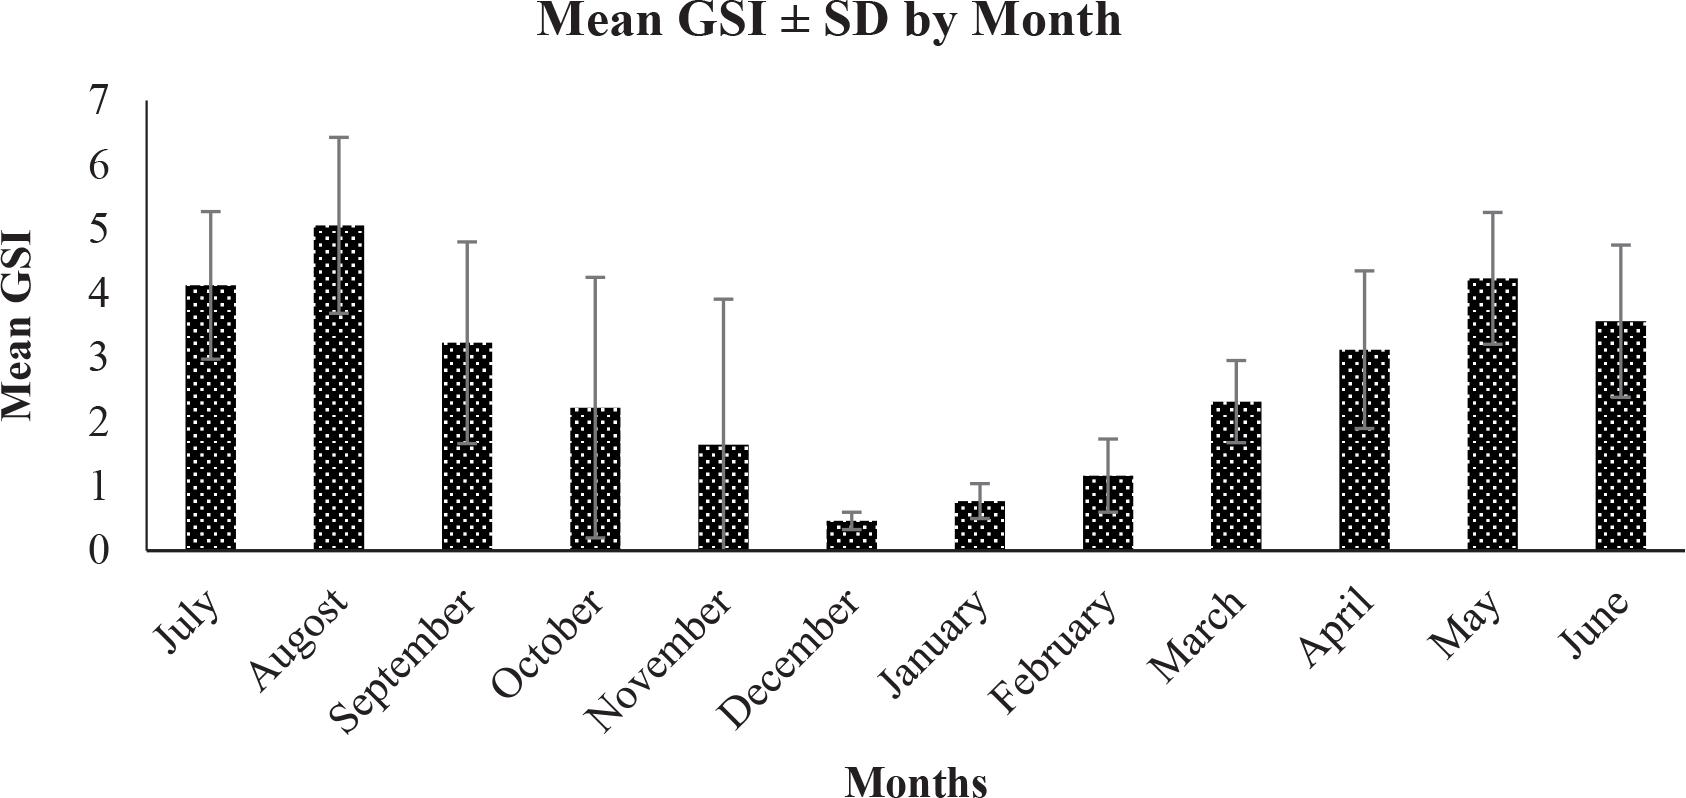
Figure 4
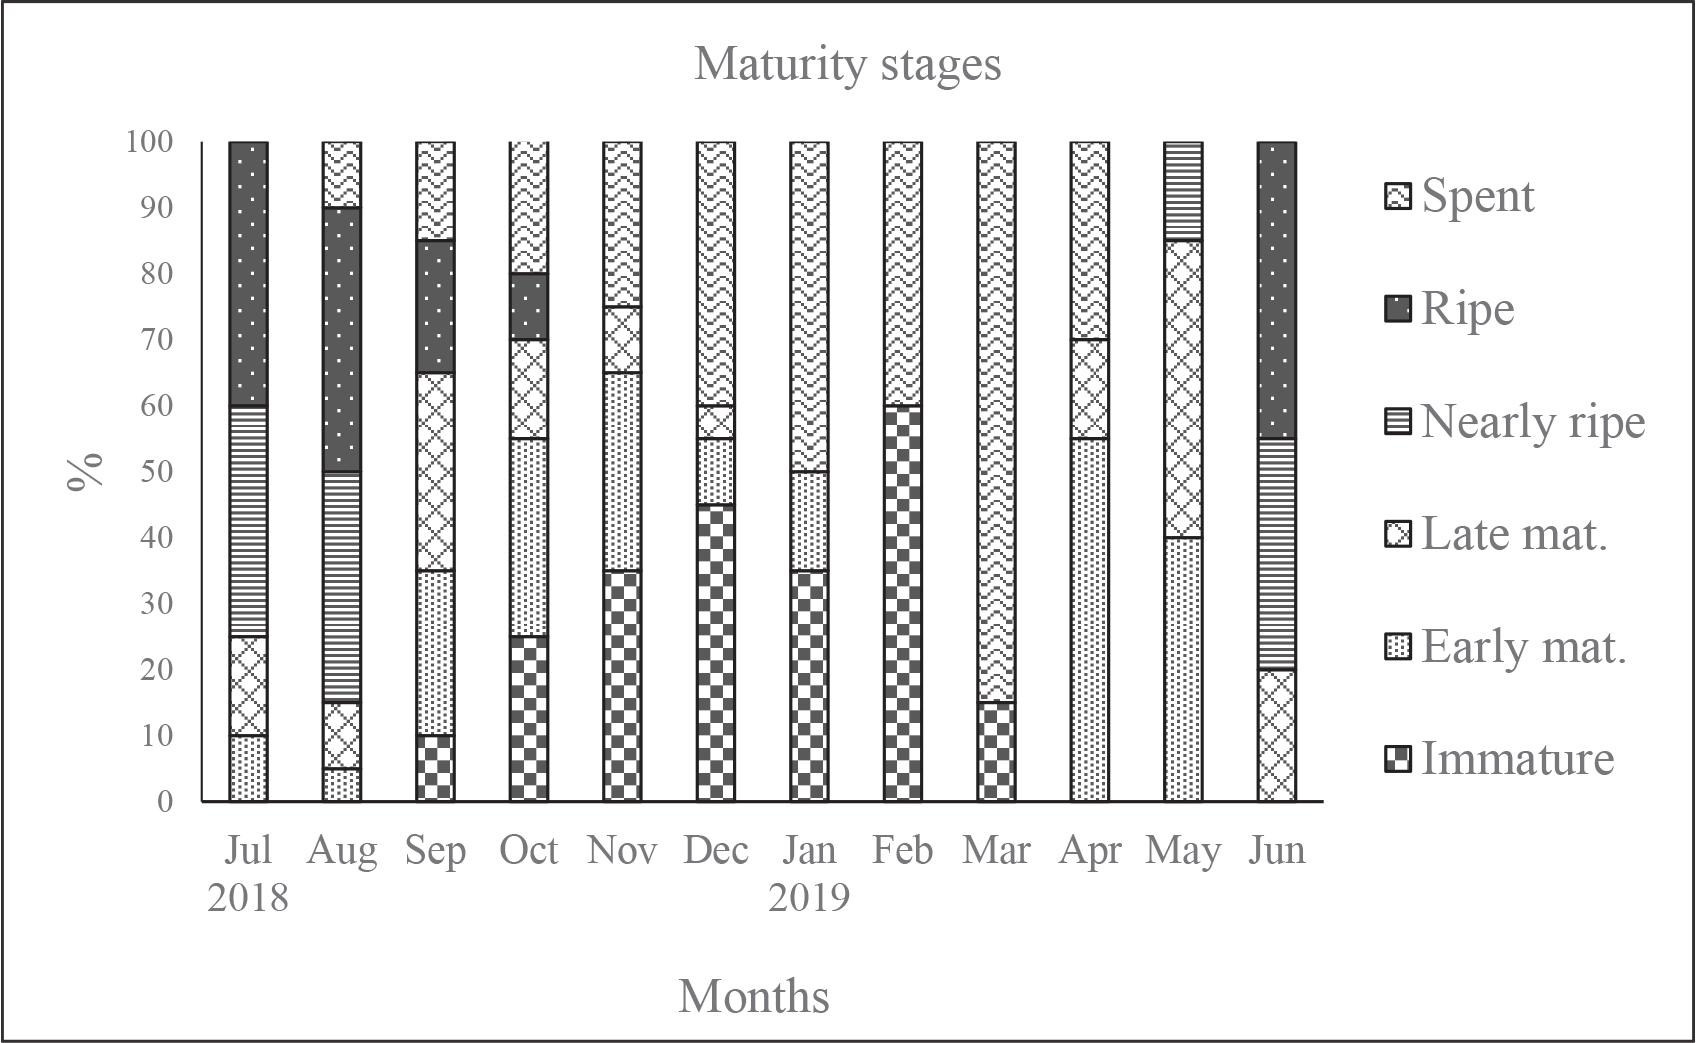
Figure 5
Monthly distribution of male and female M_ japonicus individuals sampled in the Gulf of Antalya between January and December 2018_
| Month | Female (n) | Male (n) | Total(n) |
|---|---|---|---|
| January | 20 | 17 | 37 |
| February | 20 | 17 | 37 |
| March | 19 | 18 | 37 |
| April | 19 | 21 | 40 |
| May | 24 | 24 | 48 |
| June | 24 | 27 | 51 |
| July | 29 | 28 | 57 |
| August | 29 | 26 | 55 |
| September | 24 | 22 | 46 |
| October | 19 | 18 | 37 |
| November | 15 | 15 | 30 |
| December | 16 | 16 | 32 |
| Total | 267 | 249 | 516 |
LWR parameters for M_ japonicus in the Gulf of Antalya_
| Group | n | A | B | 95% CI of b | R2 |
|---|---|---|---|---|---|
| Females | 267 | 0.0038 | 3.3146 | 3.09–3.34 | 0.947 |
| Males | 249 | 0.0127 | 2.7352 | 2.61–2.90 | 0.836 |
| Pooled | 516 | 0.0035 | 3.1814 | 3.08–3.30 | 0.924 |