
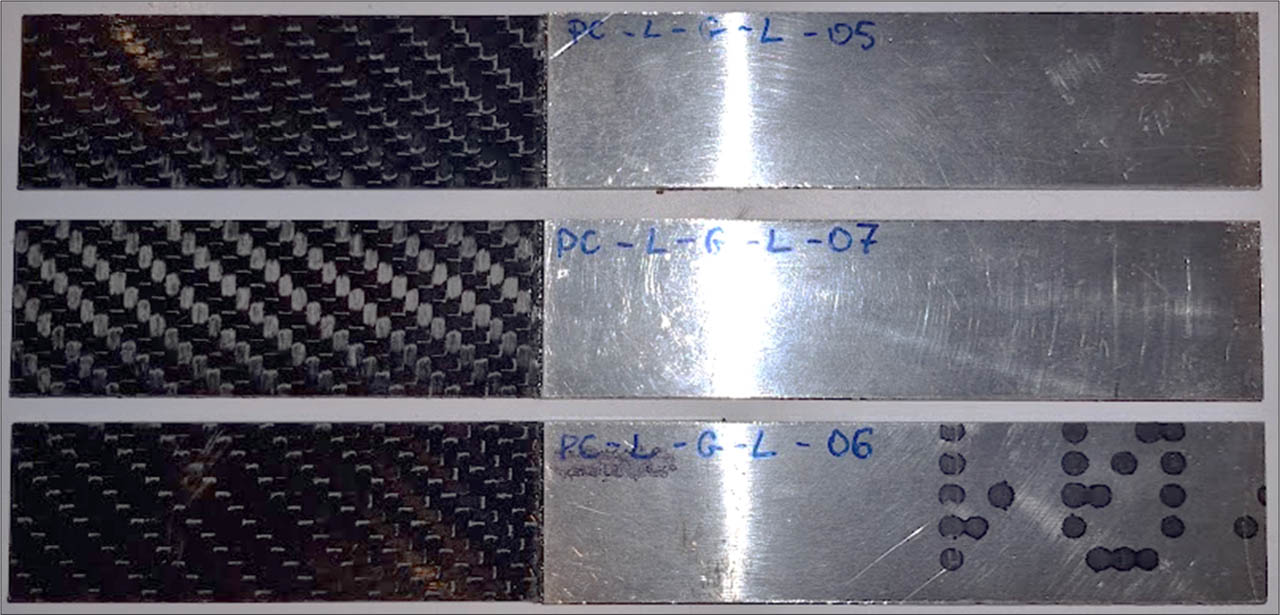
Fig. 1.
Prepared resistance-welded PC/CF-Al7075 single-lap coupons.
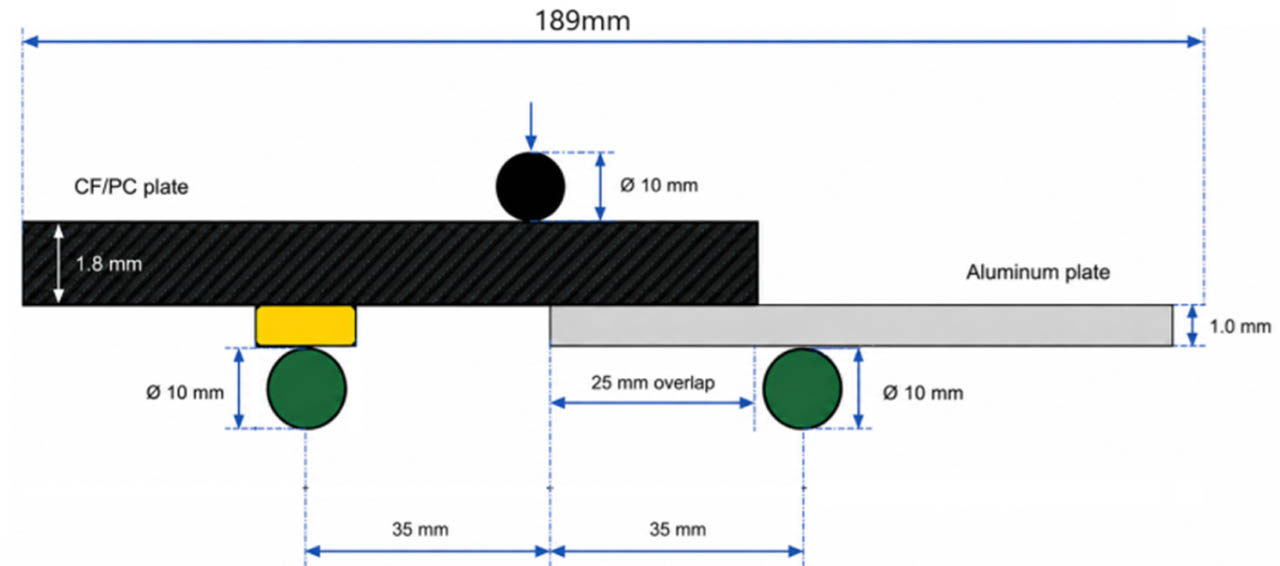
Fig. 2.
Three-point-bending arrangement and principal coupon dimensions; dimensions in mm.
Table 1.
Specimen and three-point-bending fixture geometry.
| Parameter | Value | Unit |
|---|---|---|
| Number of coupons included in final curves | 6 | - |
| Total coupon length | 189 | mm |
| Lower support span | 70 | mm |
| Distance from loading nose to each support | 35 | mm |
| Lower support diameter | 10 | mm |
| Loading-nose diameter | 10 | mm |
| Nominal PC/CF adherend thickness | 1.8 | mm |
| Nominal aluminum adherend thickness | 1.0 | mm |
| Nominal total thickness in the overlap | 2.8 | mm |
| Nominal overlap length | 25 | mm |
| Average measured welded overlap area used for data reduction | 645.16 | mm2 |
| Idealized model overlap area | 625.00 | mm2 |
| Nominal stress conversion factor | 535.71 | MPa/kN |
| Nominal coupon width | 25.0 | mm |
| Lower support geometry | cylindrical roller, Figs. 2–3 | - |
| Loading-nose geometry | cylindrical nose, Figs. 2–3 | - |
| PC/CF laminate lay-up | 18 × 0.1 mm carbon-fiber twill, 200 g/m2, polycarbonate matrix | - |
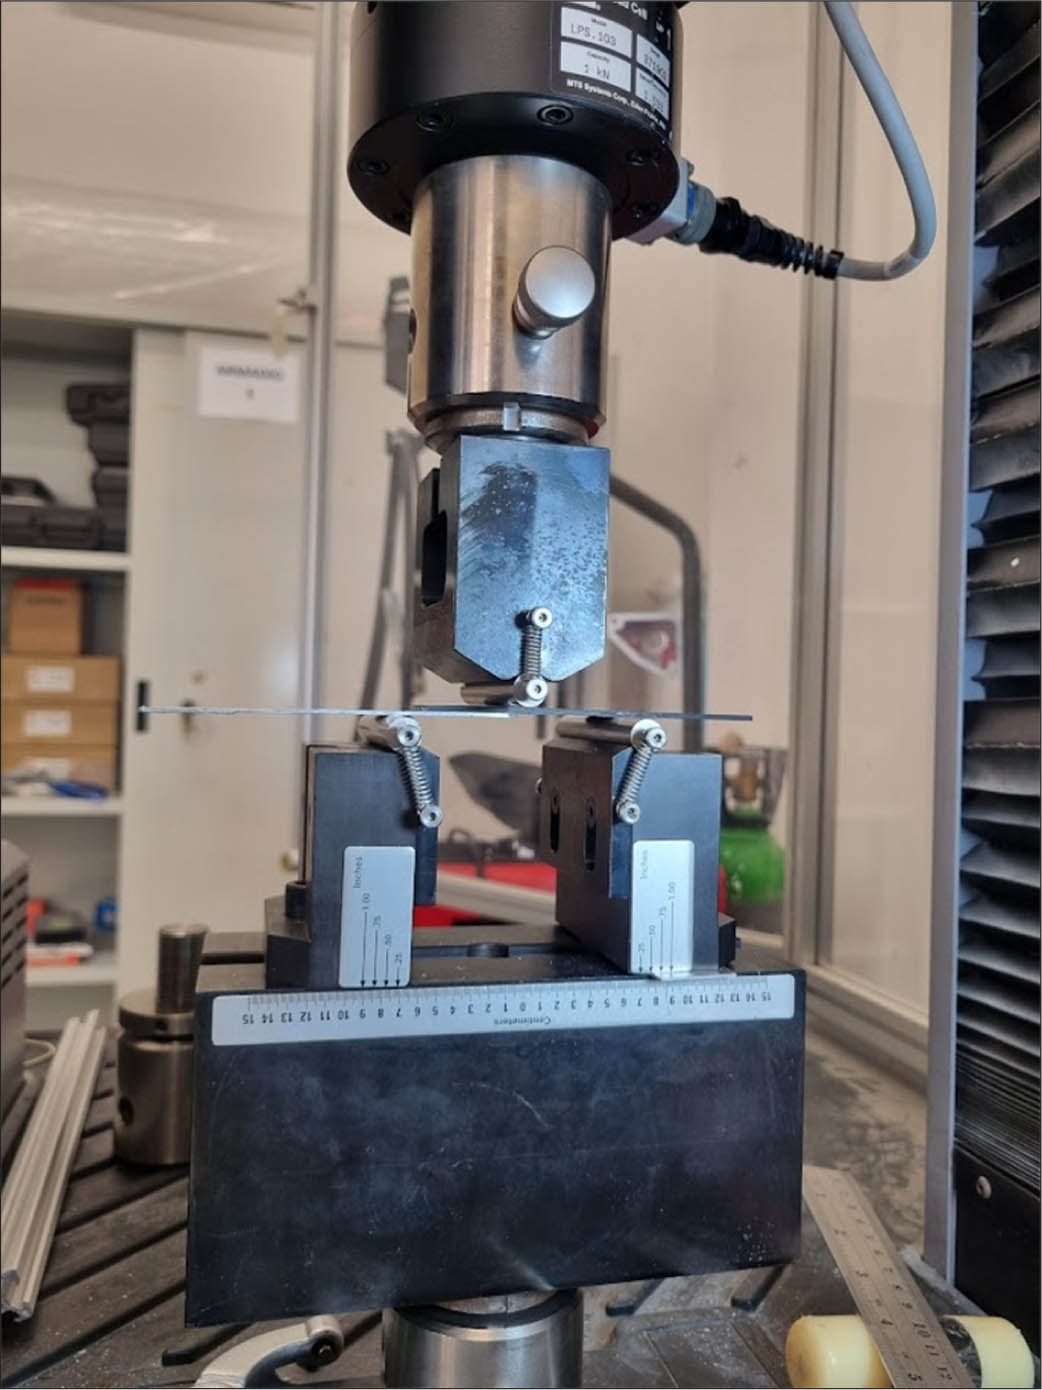
Fig. 3.
Three-point-bending test of a welded PC/CF-Al7075 single-lap coupon.
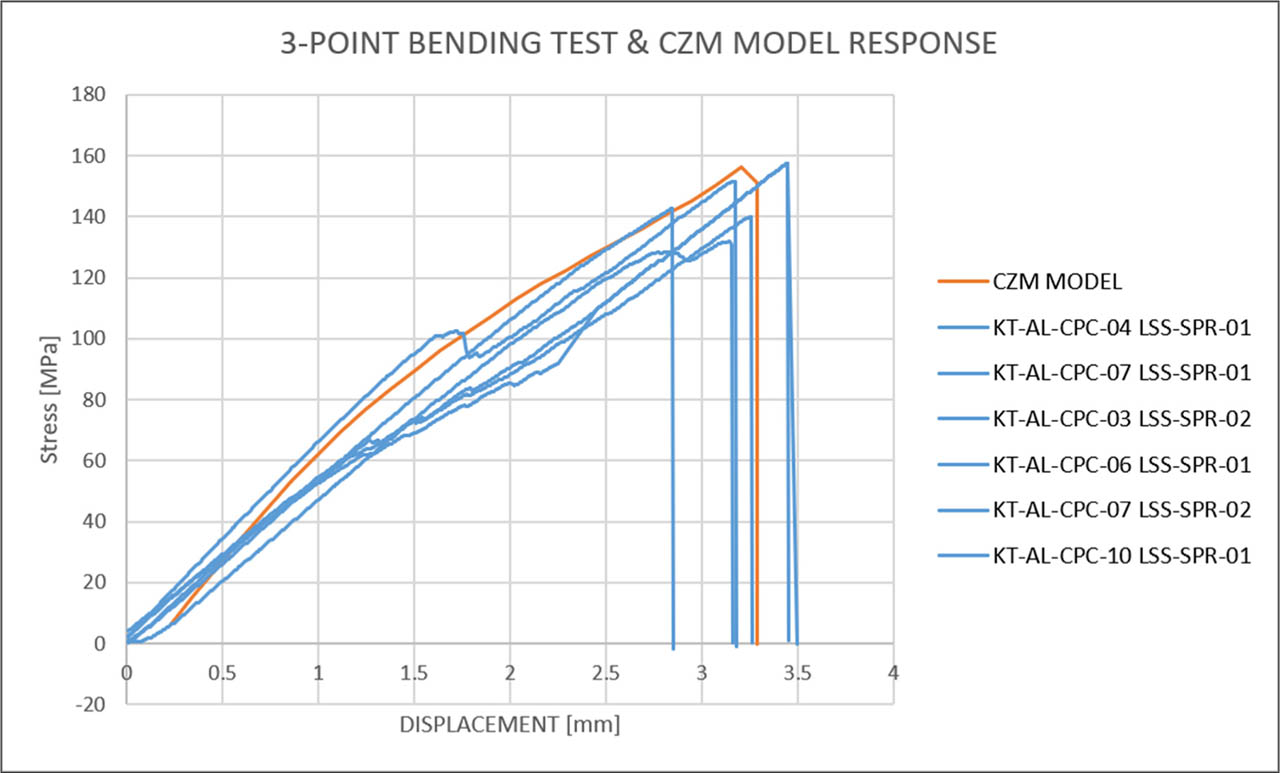
Fig. 4.
Experimental stress [MPa]-displacement [mm] curves obtained from the three-point-bending tests with the CZM model response.
Table 2.
Experimental indicators obtained from three-point-bending curves.
| Specimen | Work to peak force, N mm | Displacement at peak force, mm | Peak force, N | Calculated bending stress, MPa | Apparent work per overlap area, mJ/mm2 |
|---|---|---|---|---|---|
| K-04 LSS-SPR-01 | 510.1 | 3.45 | 293.7 | 157.3 | 0.791 |
| K-07 LSS-SPR-01 | 455.8 | 3.26 | 261.5 | 140.1 | 0.707 |
| K-03 LSS-SPR-02 | 518.5 | 3.45 | 293.7 | 157.3 | 0.804 |
| K-06 LSS-SPR-01 | 428.4 | 3.14 | 246.1 | 131.8 | 0.664 |
| K-07 LSS-SPR-02 | 507.2 | 3.17 | 282.8 | 151.5 | 0.786 |
| K-10 LSS-SPR-01 | 396.9 | 2.85 | 266.3 | 142.7 | 0.615 |
| Mean | 469.5 | 3.22 | 274.0 | 146.8 | 0.728 |
| SD | 50.2 | 0.22 | 19.2 | 10.3 | 0.078 |
| CV, % | 10.7 | 7.0 | 7.0 | 7.0 | 10.7 |
Table 3.
Material properties used in the finite element model.
| Model input | PC/CF laminate | Aluminum 7075 | Unit | Source |
|---|---|---|---|---|
| Young's modulus | 48 | 72 | GPa | [15] |
| Poisson's ratio | 0.30 | 0.30 | - | [15] |
| Coefficient of thermal expansion | 1.5 × 10⁻⁶ | 23 × 10−6 | K−1 | [15] |
| Nominal adherend thickness | 1.8 | 1.0 | mm | [15] |
| Material designation | polycarbonate | Al7075 | - | [15] |
| Reinforcement architecture | carbon HT 3k, twill 2/2, 200 g/m2 | - | - | [15] |
| PC/CF tensile strength | 440 | - | MPa | [15] |
| PC/CF flexural strength | 615 | - | MPa | [15] |
| PC/CF compressive strength | 215 | - | MPa | [15] |
| PC/CF glass-transition temperature | 143 | - | °C | [15] |
Table 4.
Finite element mesh statistics used in the ANSYS model.
| Mesh parameter | Value | Description |
|---|---|---|
| Element type | SOLID186 | 20-node higher-order hexahedral solid element |
| Element formulation | Hex20 | Quadratic hexahedral solid element |
| Nominal refined mesh size | 0.25 mm | Element size used in the refined overlap region |
| Total nodes | 344,697 | Total number of mesh nodes |
| Total elements | 67,728 | Total number of finite elements reported in the ANSYS mesh statistics |
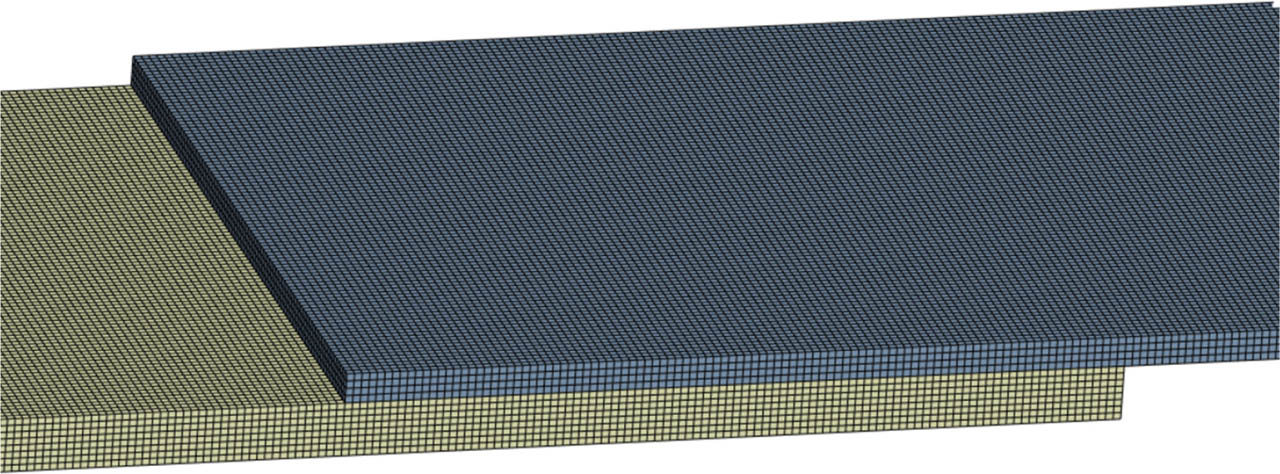
Fig. 5.
Finite element mesh of the overlap region; nominal refined mesh size 0.25 mm.
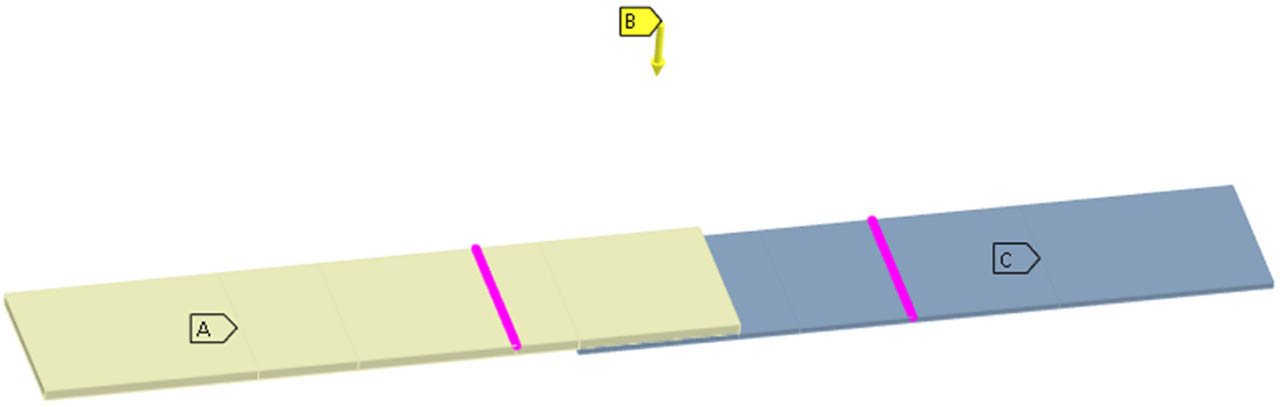
Fig. 6.
ANSYS three-point-bending boundary conditions and displacement actuator position; displacement in mm and reaction force in N.
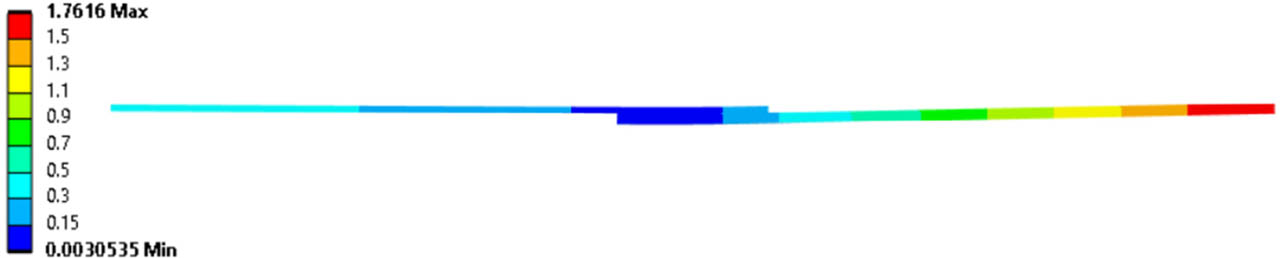
Fig. 7.
Residual displacement contour after simulated welding and cooling; displacement in mm.
Table 5.
ANSYS fracture-based debonding parameters used in the calibrated model.
| Parameter | Value | Unit |
|---|---|---|
| Debonding interface mode | Combined normal and tangential | - |
| Tangential slip under normal compression | Enabled | - |
| Maximum normal contact stress | 4 | MPa |
| Critical fracture energy for normal separation | 5.103E-05 | mJ/mm2 |
| Maximum equivalent tangential contact stress | 6 | MPa |
| Critical fracture energy for tangential slip | 0.00065103 | mJ/mm2 |
| Artificial damping coefficient | 0.7 | s |
| Power law exponent for combined debonding | 1.5 | - |
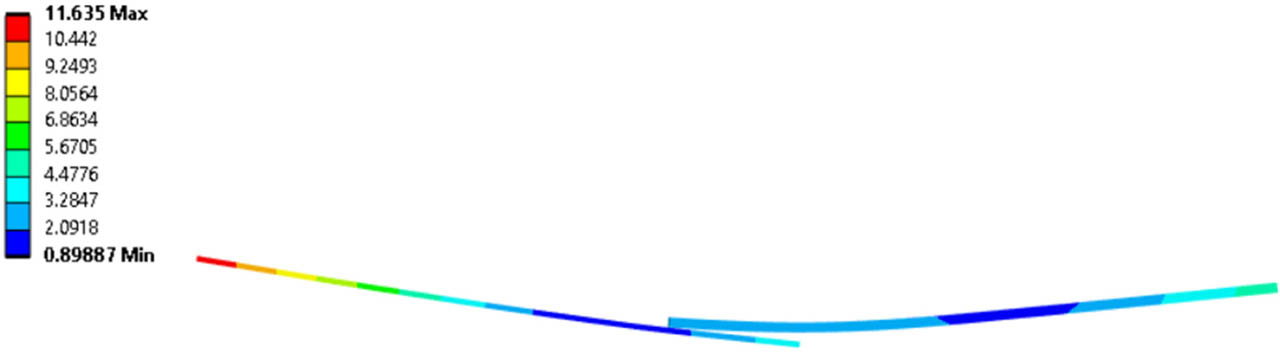
Fig. 8.
Numerical deformation of the specimen near failure; displacement in mm.
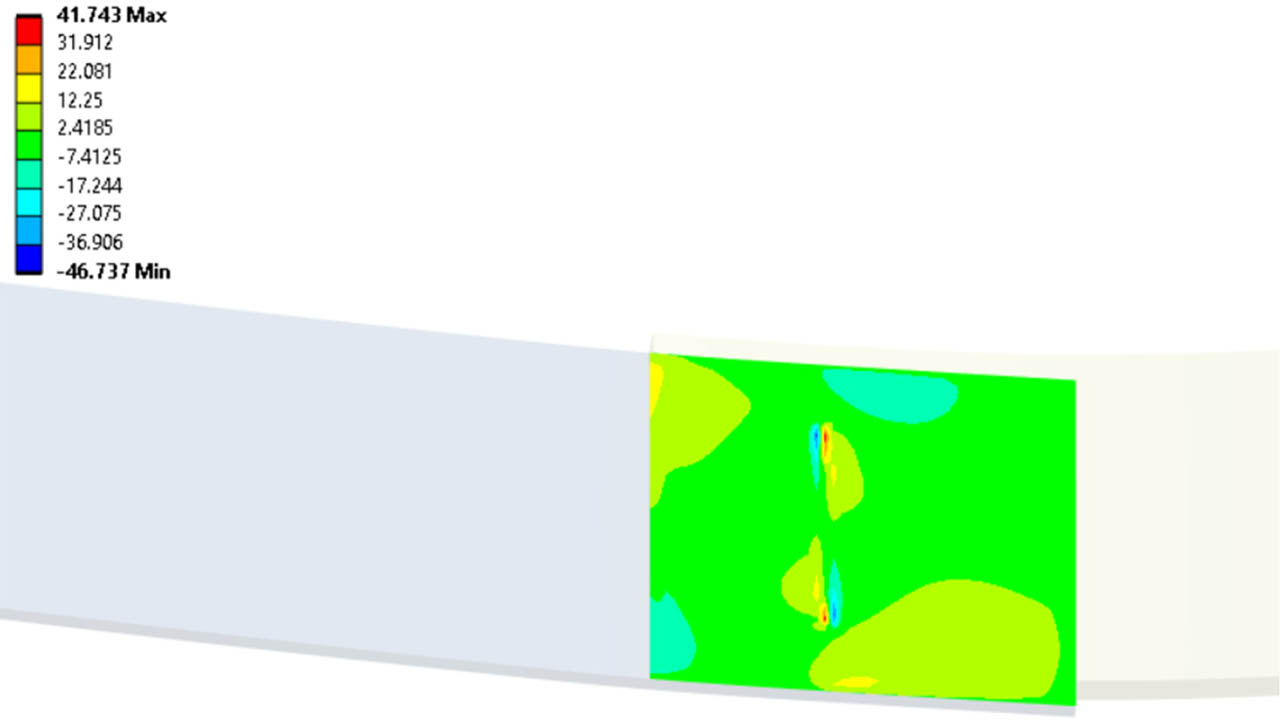
Fig. 9.
Shear stress distribution in the welded overlap region; stress in MPa.
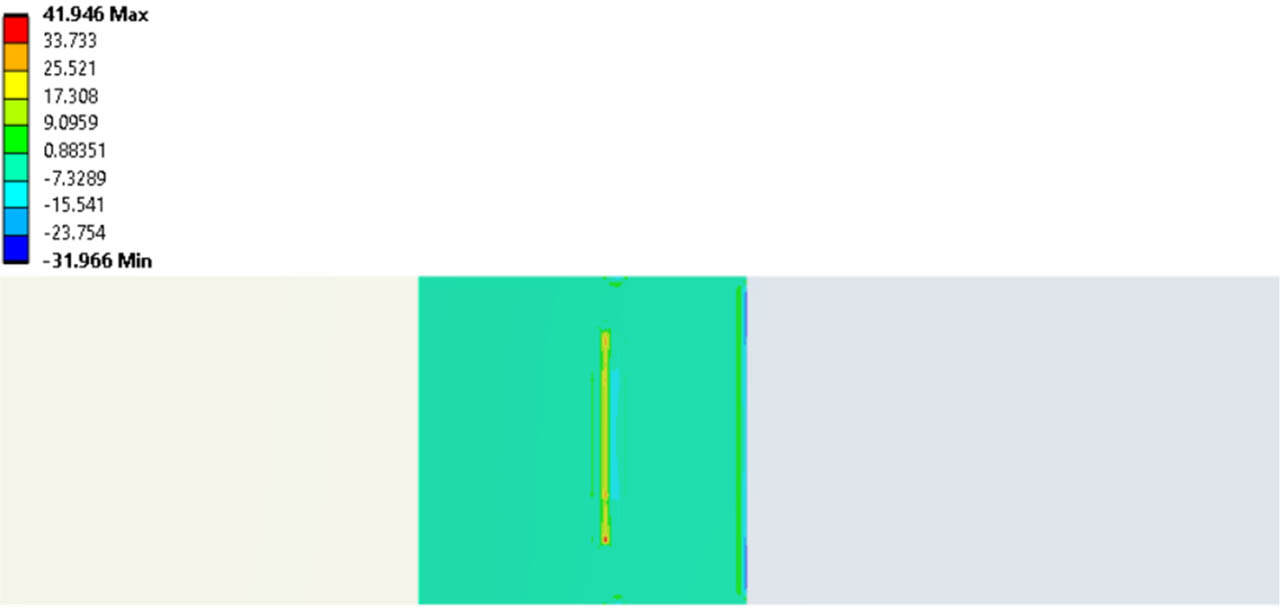
Fig. 10.
Out-of-plane normal stress distribution in the welded overlap region; stress in MPa.
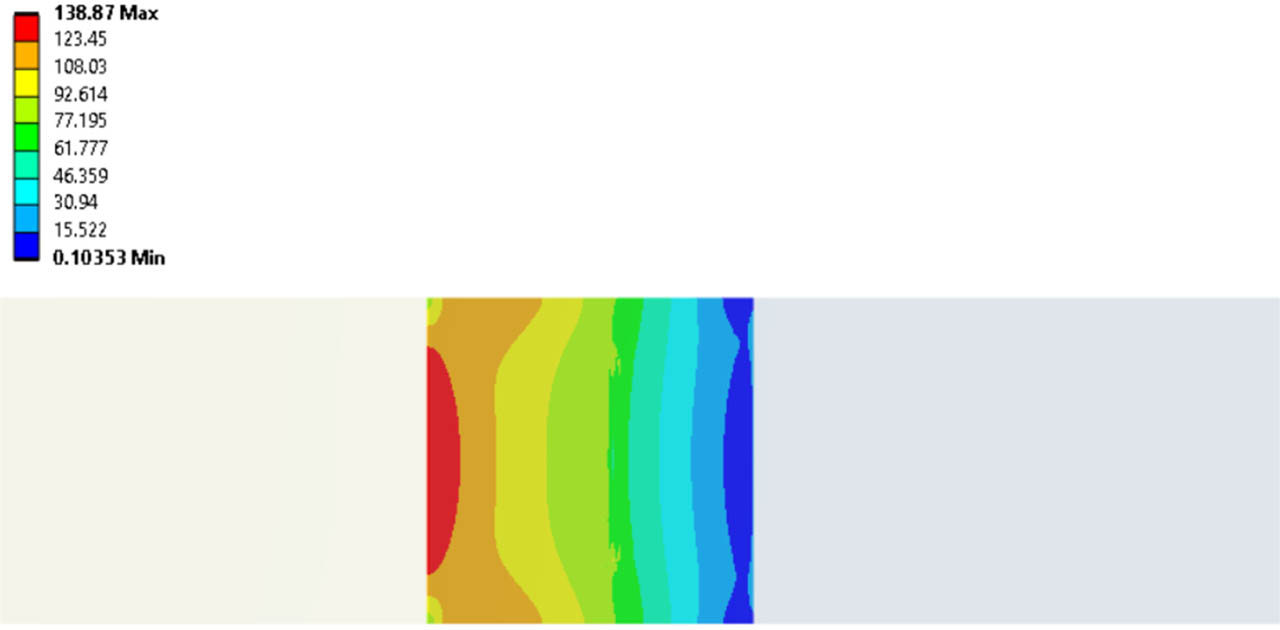
Fig. 11.
Equivalent von Mises stress distribution in the welded overlap region; stress in MPa.