
1. INTRODUCTION
Composite materials are increasingly used in aircraft structures because they offer high specific stiffness and strength, reduced structural mass and improved corrosion resistance compared with many conventional metallic solutions. Their importance is not limited to civil aircraft. Setlak et al. reviewed the practical use of composite materials in military aircraft and emphasized that composite aircraft structures require continued investigation because their behavior depends strongly on material architecture, anisotropy, manufacturing route and damage mechanisms [1]. This is relevant to the present work because aircraft repair and reinforcement concepts cannot be evaluated only by material strength; the joining method, load path and local failure mode must also be considered.
Carbon-fiber-reinforced thermoplastic composites are of particular interest for aircraft structures, secondary airframe components and repair-oriented concepts because they combine low density with weldability, reprocessability and potentially shorter manufacturing cycles [2,3,4,5,6,7,8,9]. In contrast to thermoset composites, thermoplastic matrices can be locally heated above the softening or melting range, joined under pressure and resolidified after cooling. This gives thermoplastic composites a specific advantage in repair and rework applications, where reversibility and local joining may be useful [3–4,9]. However, the mechanical response of such joints must be evaluated carefully because the weld quality and the local stress state depend on temperature history, consolidation pressure, surface preparation and cooling conditions [10].
Several joining routes have been reported for thermoplastic composite structures, including mechanical fastening, adhesive bonding, solvent bonding, co-consolidation and fusion bonding or welding [9]. Mechanical fastening is practical and inspectable, but it introduces holes and local stress concentrations. Adhesive bonding provides distributed load transfer, but it may require careful surface preparation, controlled curing and long-term environmental durability verification. Fusion bonding and resistance welding are therefore attractive alternatives when the joint includes a thermoplastic phase capable of local melting and reconsolidation [2,3,4,6,9,11].
Resistance welding is a recognized technique for joining thermoplastic composites. In this process, electrical resistance heating generates local heat at or near the interface, the thermoplastic matrix softens or melts, and the joint is consolidated under pressure during cooling [2,3,4,6,9,11]. Villegas et al. compared ultrasonic, induction and resistance welding of carbon-fiber-reinforced PPS thermoplastic composites and showed that welded thermoplastic joints can be assessed by both static and fatigue mechanical response [11]. More recent work on resistance welding also indicates that the method is being developed not only for thermoplastic-thermoplastic joints, but also for hybrid configurations involving thermosets and metals [12]. This is important for the present study because the investigated joint is not a conventional composite-composite weld. It is a hybrid PC/CF-Al7075 joint in which the thermoplastic polycarbonate phase must transfer load to a metallic adherend.
Hybrid CFRP-aluminum joining remains challenging. Pramanik et al. reviewed joining methods for CFRP composites and aluminum alloys and showed that performance depends on bonding mechanism, surface preparation, interface geometry and mechanical loading mode [13]. Jiao et al. also emphasized that joining carbon-fiber-reinforced thermoplastic composites to metals requires attention to process optimization, joining defects and strength improvement [14]. These issues are directly relevant to the present work because aluminum 7075 and PC/CF have different stiffness, thermal expansion and surface characteristics. After welding and cooling, this mismatch can generate residual stresses and initial curvature, which may modify the effective opening and sliding state at the overlap before any external load is applied [15,16,17,18].
Single-lap joints are often used as compact screening specimens for bonded and welded joints, but their interpretation is not straightforward. The eccentric load path, stiffness mismatch between adherends and overlap termination generate coupled peel and shear stresses near the overlap edges [7,19,20,21]. Therefore, single-lap-joint strength cannot be interpreted only as a uniform nominal stress. Dobrzański and Oleksiak reviewed design and analysis methods for composite bonded joints and showed that joint geometry, adherend deformation and stress concentration strongly influence bonded-joint performance [7]. Liechti and Kadioglu recently studied fusion-bonded thermoplastic single-lap joints under bending and showed that bending-loaded thermoplastic lap joints are sensitive to overlap-edge effects and local notch geometry [22]. These findings support the use of bending-based tests as structural screening methods for overlap-dominated joint behavior.
Three-point bending has been used to study failure initiation in metal-polymer bonded systems and to load single-lap adhesive coupons in flexure [23–24]. In the present study, the test was selected to introduce a concentrated transverse load and to observe the global response of a resistance-welded PC/CF-Al7075 single-lap coupon. The test was not intended to determine a standardized pure mode-I or mode-II fracture toughness. The measured force-displacement curve contains several coupled contributions: global bending of the adherends, local contact, possible plastic deformation of the aluminum adherend, interface separation and release of the welding-induced residual stress state. For this reason, the area under the curve was treated only as an apparent work indicator, not as a directly transferable fracture energy.
Cohesive zone models are commonly used to represent progressive separation of bonded or welded interfaces. However, cohesive parameters are phenomenological and depend on the identification method, specimen geometry, local mode mixity and available experimental measurements [25,26,27,28]. In the present case, normal opening and tangential slip occur simultaneously during bending, so the normal and tangential components of interface fracture cannot be separated directly from the global force-displacement curve. The experimental response was therefore used as an inverse calibration target for an effective ANSYS cohesive-zone representation of the welded interface.
The aim of this work is to describe the three-point-bending response of resistance-welded PC/CF-Al7075 single-lap coupons and to calibrate an effective cohesive-zone model that reproduces the observed stiffness, peak force, load drop and debonding pattern. The novelty of the present study lies in the combined experimental-numerical screening of resistance-welded PC/CF-Al7075 hybrid joints under concentrated bending, including the post-weld residual state as an initial condition in the CZM calibration. The contribution of the method is not the determination of universal PC/CF-Al7075 fracture constants. Instead, the work provides a practical screening and modeling procedure for welded thermoplastic composite-metal coupons in which bending, peel, sliding and residual stresses occur simultaneously. This procedure can support further research by identifying critical overlap regions, defining reference load levels for future fatigue tests and providing an initial numerical framework for repair-oriented assessment of thermoplastic composite-metal joints.
2. MATERIALS AND METHODS
2.1. Specimens and post-weld initial state
The tested specimens were resistance-welded SLJ coupons made from PC/CF laminate and aluminum 7075. During manufacturing, heat was generated in the overlap region, the polycarbonate phase softened or melted, and pressure consolidated the interface. After cooling, the resolidified polymer formed the load-transfer path between the composite and metal adherends [3–4,15]. The PC/CF adherend was a consolidated carbon-fiber-fabric reinforced polycarbonate laminate. The matrix material was polycarbonate and the reinforcement was carbon-fiber twill fabric. The laminate consisted of 18 layers, each approximately 0.1 mm thick, using a 200 g/m2 twill fabric, giving a nominal PC/CF adherend thickness of 1.8 mm in the test coupons. The welded overlap was the critical region of the coupon. It was expected to experience coupled opening and tangential slip during bending, similar to other lap-joint configurations where local peel and edge effects dominate failure [19–20]. Because the joint was produced thermally, the coupon was not assumed to be initially flat and stress-free. Welding-induced residual stress and curvature were carried into the numerical workflow [18]. The detailed resistance-welding route, including temperature history, consolidation conditions and previous residual-stress analysis, was not repeated here to avoid redundancy and self-plagiarism. Those elements were described in the previous articles and are used in the present manuscript only as the manufacturing background and post-weld initial state [15,18]. The experimental novelty of the present work is the subsequent three-point-bending screening of the already welded hybrid coupons and the effective CZM calibration based on that response.
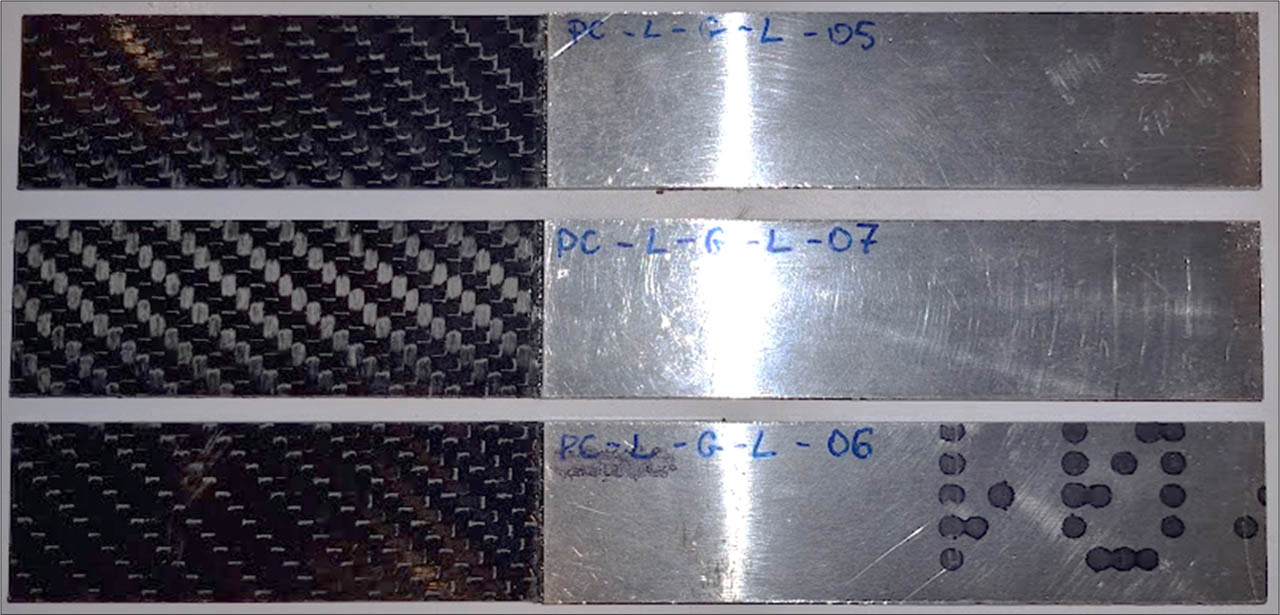
Fig. 1.
Prepared resistance-welded PC/CF-Al7075 single-lap coupons.
2.2. Coupon geometry and bending fixture
The coupons were cut so that the welded overlap remained in the loaded region of the fixture. The specimen was supported on two lower rollers and loaded by one upper nose. This arrangement introduced a concentrated transverse load and promoted local opening near the overlap while retaining the actual eccentricity of the hybrid joint [19,23–24]. The nominal coupon width and nominal overlap length were both 25 mm. The actual coupon dimensions varied slightly after cutting and welding; therefore, the average measured overlap area used for experimental apparent-work normalization was 645.16 mm2. In the finite element model, an idealized geometry was used, with an exact 25 mm × 25 mm overlap corresponding to 625.00 mm2.
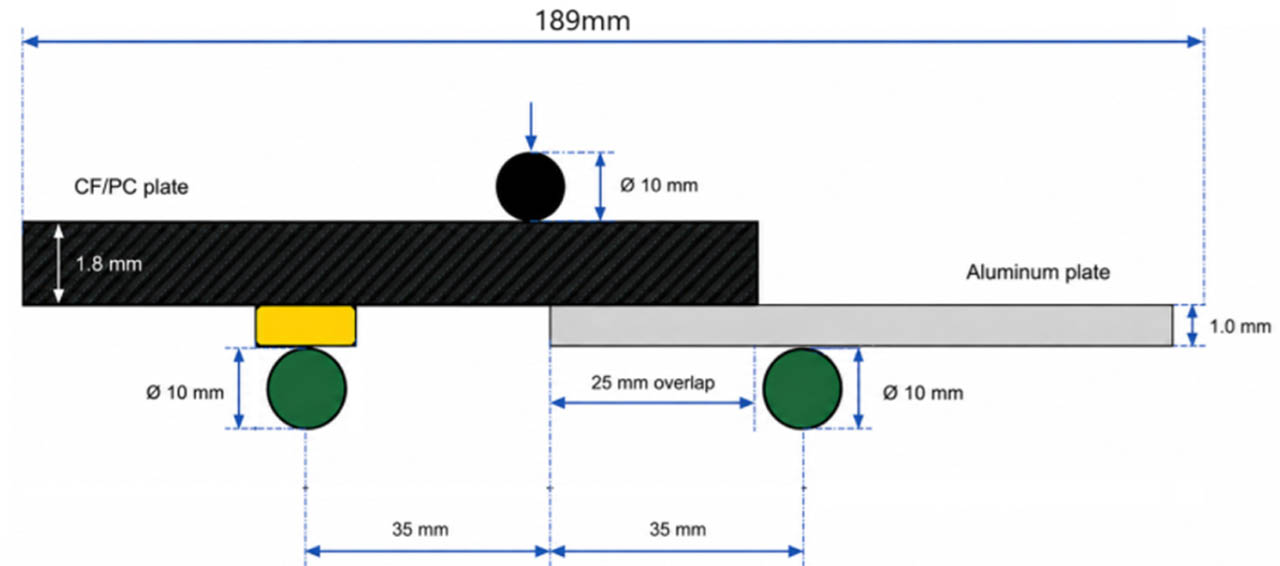
Fig. 2.
Three-point-bending arrangement and principal coupon dimensions; dimensions in mm.
Table 1.
Specimen and three-point-bending fixture geometry.
| Parameter | Value | Unit |
|---|---|---|
| Number of coupons included in final curves | 6 | - |
| Total coupon length | 189 | mm |
| Lower support span | 70 | mm |
| Distance from loading nose to each support | 35 | mm |
| Lower support diameter | 10 | mm |
| Loading-nose diameter | 10 | mm |
| Nominal PC/CF adherend thickness | 1.8 | mm |
| Nominal aluminum adherend thickness | 1.0 | mm |
| Nominal total thickness in the overlap | 2.8 | mm |
| Nominal overlap length | 25 | mm |
| Average measured welded overlap area used for data reduction | 645.16 | mm2 |
| Idealized model overlap area | 625.00 | mm2 |
| Nominal stress conversion factor | 535.71 | MPa/kN |
| Nominal coupon width | 25.0 | mm |
| Lower support geometry | cylindrical roller, Figs. 2–3 | - |
| Loading-nose geometry | cylindrical nose, Figs. 2–3 | - |
| PC/CF laminate lay-up | 18 × 0.1 mm carbon-fiber twill, 200 g/m2, polycarbonate matrix | - |
2.3. Three-point-bending protocol
The test configuration followed the general principles of ASTM D7264/D7264M, Procedure A [29], for three-point flexural testing of polymer matrix composite materials. The standard defines a center-loaded specimen supported as a simply supported beam. In the present work, it was used as a procedural framework for loading, supporting and recording the coupon response, but the specimen geometry was intentionally adapted to preserve the welded single-lap overlap. Therefore, the results are interpreted as structural screening indicators rather than standardized laminate flexural properties.
Each PC/CF-Al7075 coupon was positioned on two cylindrical lower supports with a support span of 70 mm. A single cylindrical loading nose applied a monotonic transverse displacement at the center of the span, close to the welded overlap. The test was displacement controlled. The machine was WTF-FL-143, controlled using MTS 793 software, and the crosshead speed was 3 mm/min. Force, actuator displacement and time were recorded throughout the test until a clear loss of load-carrying capacity occurred. The coupon was oriented so that the welded overlap remained in the region directly affected by bending and local opening. This configuration generated global bending of the adherends together with local peel and tangential slip at the welded interface.
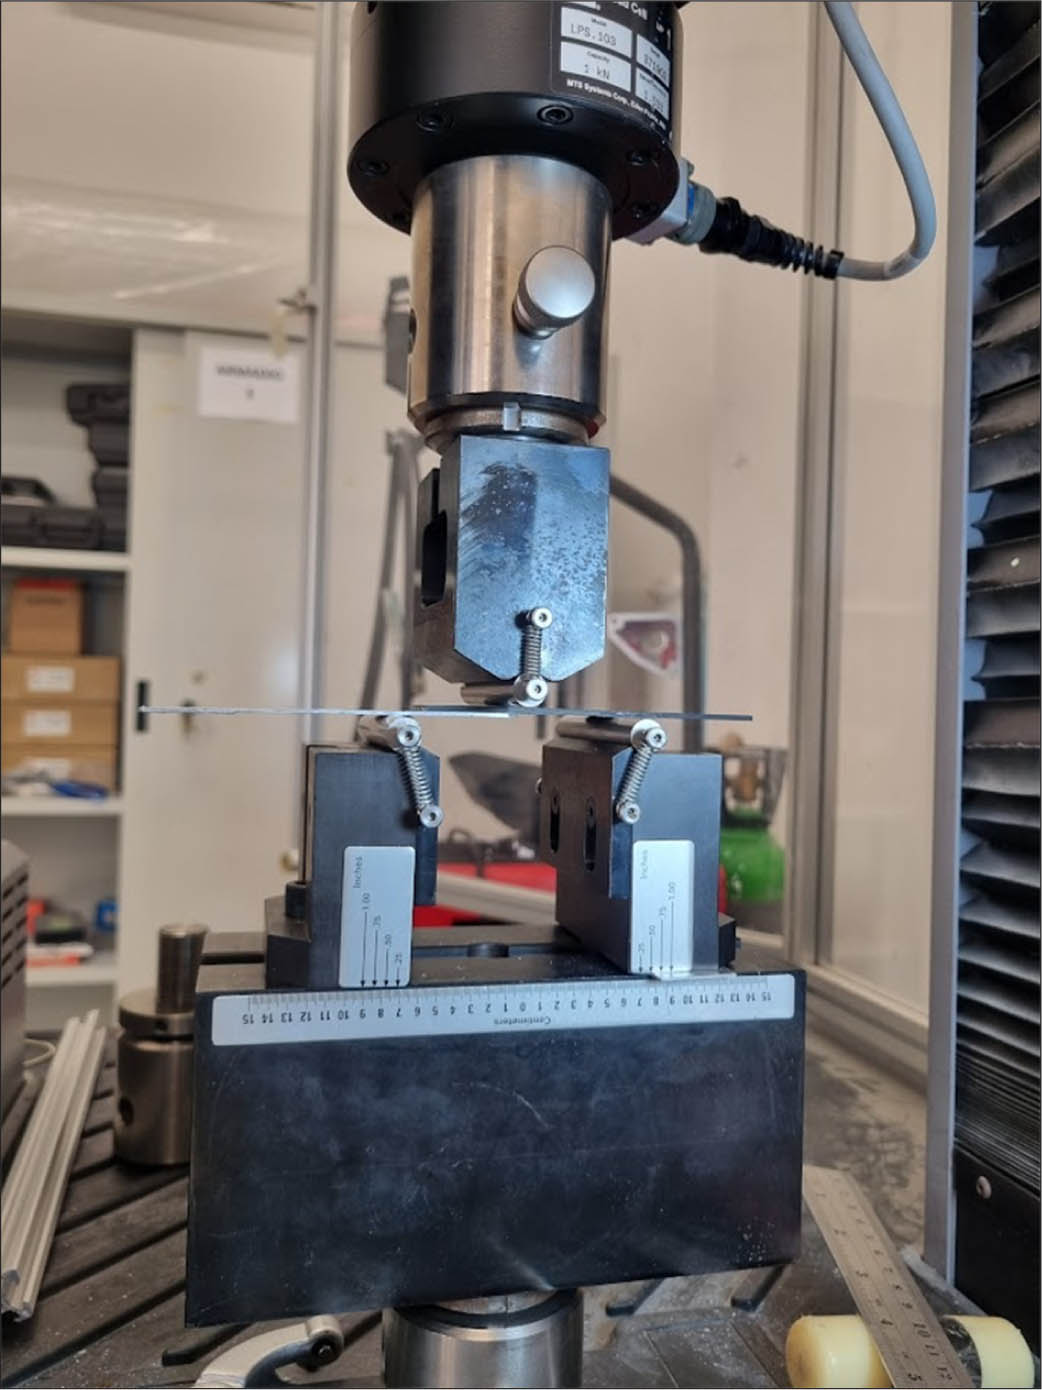
Fig. 3.
Three-point-bending test of a welded PC/CF-Al7075 single-lap coupon.
Standard lap-shear or pure fracture specimens are more appropriate for obtaining nominal joint strength or mode-separated fracture parameters [19,20,21,25–26], but they do not reproduce the concentrated transverse loading condition considered here. In the present configuration, the objective was to evaluate whether the resistance-welded PC/CF-Al7075 interface could transfer load under bending, induce visible adherend deformation and then be represented by an effective cohesive-zone model. The test therefore provided global stiffness, peak force, apparent work, displacement at failure and qualitative debonding behavior.
The method differs from commonly reported research approaches because most available studies concern thermoplastic composite-to-composite welding, adhesive bonding, lap-shear testing or dedicated fracture tests [2,3,4,5,6,9,11,12,13,14]. Direct studies on resistance-welded carbon-fiber-reinforced polycarbonate joined to aluminum 7075 and tested as hybrid single-lap coupons under three-point bending are not widely available in the literature. For this reason, the present test should be treated as an exploratory aerospace-oriented screening method for a specific thermoplastic composite-metal joint rather than as a conventional standardized strength test.
2.4. Data reduction
For a symmetric three-point-bending configuration, the maximum nominal bending moment at the loading point was estimated using the standard beam relation [30]:
where F is the applied force and L is the lower support span. The nominal stress indicator was then calculated as: where y is the distance from the assumed neutral-axis position to the outer surface and I is the second moment of area used for the simplified conversion. These quantities were used only for comparison within the present test campaign. They do not describe the true local stress field at the welded overlap because the coupon contains dissimilar adherends, an overlap step, a welded interface, contact zones and residual stress [19,20,21].The mechanical work up to a selected point of the force-displacement curve was calculated as:
An apparent work per welded area was then written as:
where Ab is the average measured welded overlap area used for experimental data reduction. This value was retained only as a comparative indicator. It was not interpreted as GI, GII or mixed-mode fracture energy because crack length, crack-front position and mode partition were not measured independently. Global force- or stress-displacement curves can be insufficient for unique cohesive-parameter identification when coupled modes are present [25–26].3. EXPERIMENTAL RESULTS
The six three-point-bending curves were analyzed after converting the recorded force to the nominal bending stress indicator. Only the data up to the first post-failure drop of force to zero were retained; all subsequent points were excluded from the analysis. The numerical response was compared with the calculated stress-displacement curves.
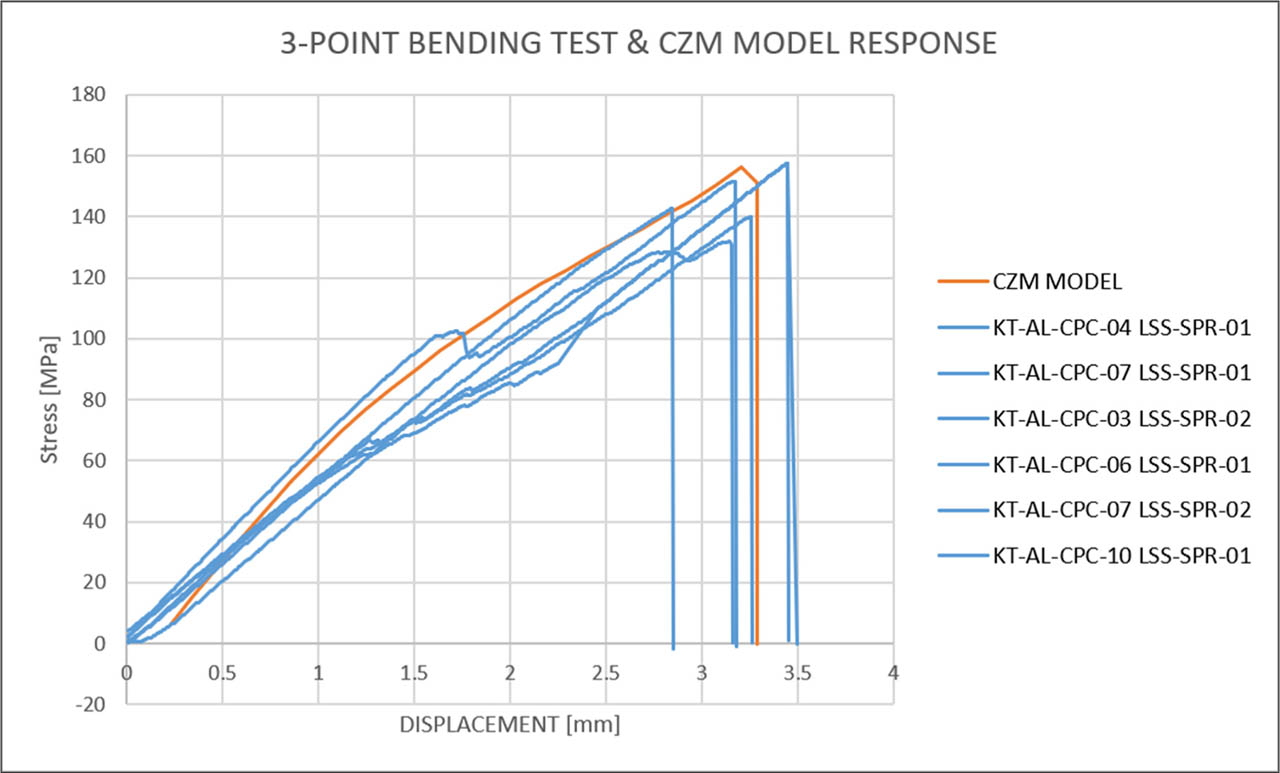
Fig. 4.
Experimental stress [MPa]-displacement [mm] curves obtained from the three-point-bending tests with the CZM model response.
The initial part of each stress-displacement curve was approximately linear, which indicates that the early response was governed by global coupon bending and interface stiffness. The curves then developed local stiffness changes before the final load drop. This confirms that the joint remained sufficiently effective to induce visible adherend bending before complete loss of load transfer.
Table 2.
Experimental indicators obtained from three-point-bending curves.
| Specimen | Work to peak force, N mm | Displacement at peak force, mm | Peak force, N | Calculated bending stress, MPa | Apparent work per overlap area, mJ/mm2 |
|---|---|---|---|---|---|
| K-04 LSS-SPR-01 | 510.1 | 3.45 | 293.7 | 157.3 | 0.791 |
| K-07 LSS-SPR-01 | 455.8 | 3.26 | 261.5 | 140.1 | 0.707 |
| K-03 LSS-SPR-02 | 518.5 | 3.45 | 293.7 | 157.3 | 0.804 |
| K-06 LSS-SPR-01 | 428.4 | 3.14 | 246.1 | 131.8 | 0.664 |
| K-07 LSS-SPR-02 | 507.2 | 3.17 | 282.8 | 151.5 | 0.786 |
| K-10 LSS-SPR-01 | 396.9 | 2.85 | 266.3 | 142.7 | 0.615 |
| Mean | 469.5 | 3.22 | 274.0 | 146.8 | 0.728 |
| SD | 50.2 | 0.22 | 19.2 | 10.3 | 0.078 |
| CV, % | 10.7 | 7.0 | 7.0 | 7.0 | 10.7 |
The average peak force was 274.0 N and the coefficient of variation was 7.0%. The calculated nominal bending stress indicator ranged from 131.8 MPa to 157.3 MPa, with a mean value of 146.8 MPa. These values should be treated as campaign-specific screening metrics. They are not equivalent to interface strength because local peel and shear concentrations at the overlap edge are expected in bending-loaded single-lap configurations [19–20].
The apparent work per overlap area ranged from 0.615 mJ/mm2 to 0.804 mJ/mm2, with a mean value of 0.728 mJ/mm2. This quantity is useful for comparing the six coupons, but it should not be used as fracture toughness. In this geometry, the measured work contains adherend bending, local contact and damage dissipation in addition to any interface-separation work [21,23,25–26].
The effectiveness of the proposed screening and calibration method is shown by the consistency between the experimental curves and the numerical response. The calibrated CZM model reached a peak nominal stress of approximately 156 MPa, corresponding to a peak force of approximately 291 N. The experimental mean values were 146.8 MPa and 274.0 N. The difference between the numerical peak stress and the experimental mean stress was therefore about 6.3%, and the numerical peak remained within the experimental ranges of 131.8–157.3 MPa and 246.1–293.7 N. The method was also effective in reproducing the main qualitative behavior observed during testing: initial stiffness, stress increase up to peak load, sudden post-peak loss of load-carrying capacity and visible adherend deformation. For this reason, the model is considered effective as an engineering representation of this specific coupon response, but not as an independently validated material fracture law.
Six coupons were included in the final stress-displacement comparison. The results should be treated as screening data rather than design allowables. A larger experimental program is required to confirm scatter, reliability and test load levels.
4. FINITE ELEMENT AND COHESIVE-ZONE MODEL
4.1. Model purpose and boundary conditions
The finite element model was developed as a three-dimensional structural representation of the tested PC/CF-Al7075 coupons under three-point bending. The aluminum and PC/CF adherends were represented as separate solid bodies: the aluminum adherend as an elastoplastic body and the PC/CF laminate as a homogenized elastic laminate. The welded overlap was represented by a cohesive contact/debonding region assigned to the contact zone between the aluminum and PC/CF adherends [25,26,27,28,31].
The model was not intended to identify independent constituent or lamina properties. Its purpose was to provide an effective representation of the welded interface in the tested configuration and to reproduce the measured stress-displacement response and deformation pattern.
The material properties used in the structural model are summarized in Table 3. The values were taken from the previous residual-stress workflow and the PC/CF datasheet used in that work [15]. Temperature-dependent aluminum behavior was retained in the post-weld initial-state calculation, while the present mechanical bending model used the resulting initial strain field as the residual-stress input.
Table 3.
Material properties used in the finite element model.
| Model input | PC/CF laminate | Aluminum 7075 | Unit | Source |
|---|---|---|---|---|
| Young's modulus | 48 | 72 | GPa | [15] |
| Poisson's ratio | 0.30 | 0.30 | - | [15] |
| Coefficient of thermal expansion | 1.5 × 10⁻⁶ | 23 × 10−6 | K−1 | [15] |
| Nominal adherend thickness | 1.8 | 1.0 | mm | [15] |
| Material designation | polycarbonate | Al7075 | - | [15] |
| Reinforcement architecture | carbon HT 3k, twill 2/2, 200 g/m2 | - | - | [15] |
| PC/CF tensile strength | 440 | - | MPa | [15] |
| PC/CF flexural strength | 615 | - | MPa | [15] |
| PC/CF compressive strength | 215 | - | MPa | [15] |
| PC/CF glass-transition temperature | 143 | - | °C | [15] |
Table 4.
Finite element mesh statistics used in the ANSYS model.
| Mesh parameter | Value | Description |
|---|---|---|
| Element type | SOLID186 | 20-node higher-order hexahedral solid element |
| Element formulation | Hex20 | Quadratic hexahedral solid element |
| Nominal refined mesh size | 0.25 mm | Element size used in the refined overlap region |
| Total nodes | 344,697 | Total number of mesh nodes |
| Total elements | 67,728 | Total number of finite elements reported in the ANSYS mesh statistics |
The nominal mesh size in the refined overlap region was 0.25 mm. This density was selected to balance computational cost with reliable stress and debonding-gradient representation. The use of quadratic Hex20 elements introduced mid-side nodes, improving the representation of bending and contact deformation in the overlap region.
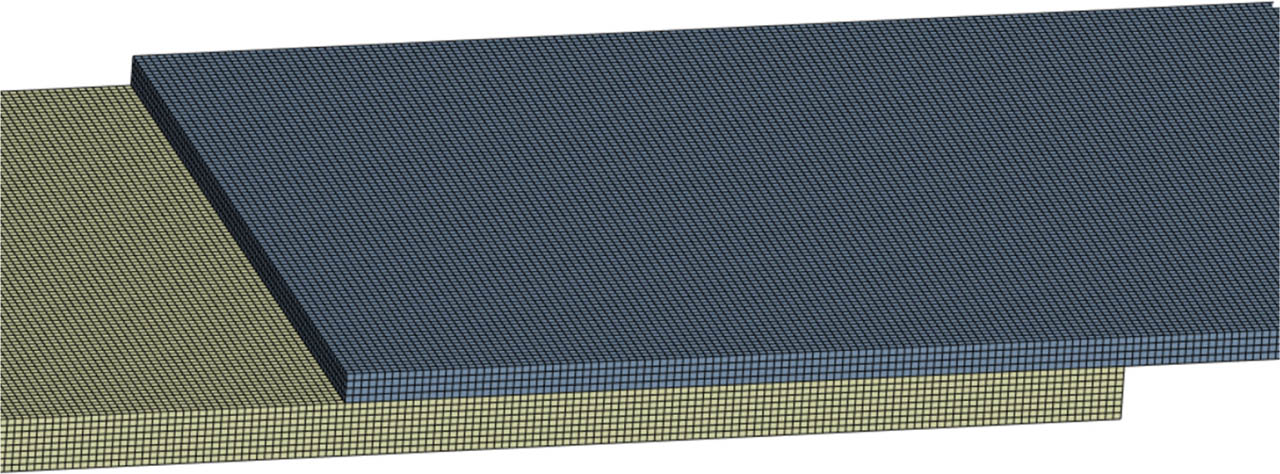
Fig. 5.
Finite element mesh of the overlap region; nominal refined mesh size 0.25 mm.
The lower supports and the loading nose were represented by rigid remote displacement boundary conditions. The lower supports constrained vertical displacement while allowing the specimen to rotate and slide in a manner consistent with the physical bending fixture. The mechanical load was introduced by prescribing vertical displacement to the upper loading nose, and the total reaction force was extracted from the loading boundary condition. The numerical response was converted to the same nominal stress indicator and compared with the experimental stress-displacement response. The initial strain state was applied to represent the post-weld residual stresses.
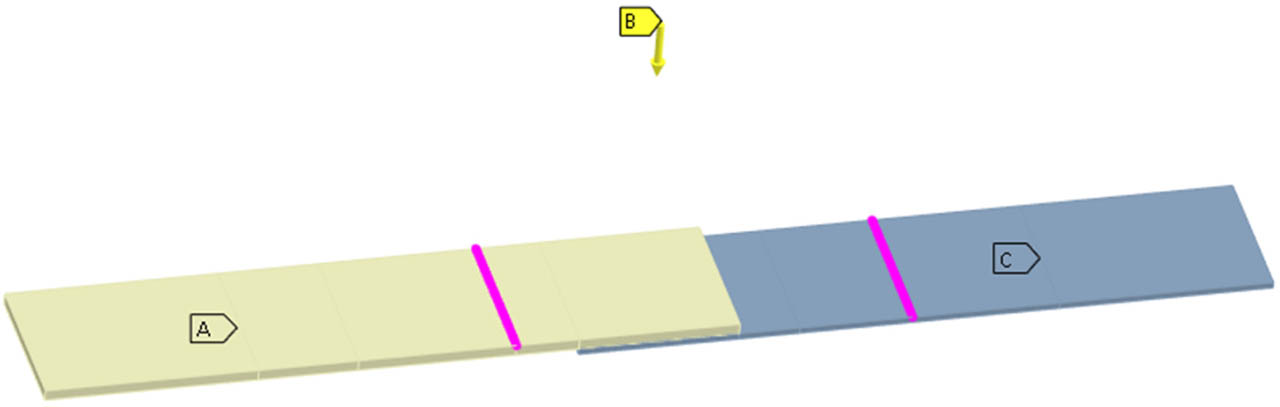
Fig. 6.
ANSYS three-point-bending boundary conditions and displacement actuator position; displacement in mm and reaction force in N.
4.2. Residual stress and initial curvature
The analysis started from a prestressed state rather than from an idealized flat geometry. Resistance welding heats and consolidates the interface. During subsequent cooling, differential thermal contraction between aluminum and PC/CF generates residual stresses and initial curvature [15]. In the present model, this state was introduced through an initial strain condition before applying the mechanical bending load.
Fig. 7 should be interpreted as an equivalent post-weld initial-state representation, not as a complete transient simulation of every physical stage of resistance welding. The post-weld state was introduced before mechanical loading by applying an initial strain condition that reproduced the curvature and residual displacement trend obtained after welding and cooling. This simplified approach was selected because the complete welding process had already been described in the previous work, while the purpose of the present model was to evaluate the influence of that pre-existing state on the three-point-bending response [15,18].
Including the post-weld initial state is important because residual tensile components near the overlap can add to bending-induced peel stresses, while compressive components can delay opening. Residual stresses can also evolve under later cyclic loading, which is relevant for aerospace fatigue and damage-tolerance assessments [16,17,18,32–33].
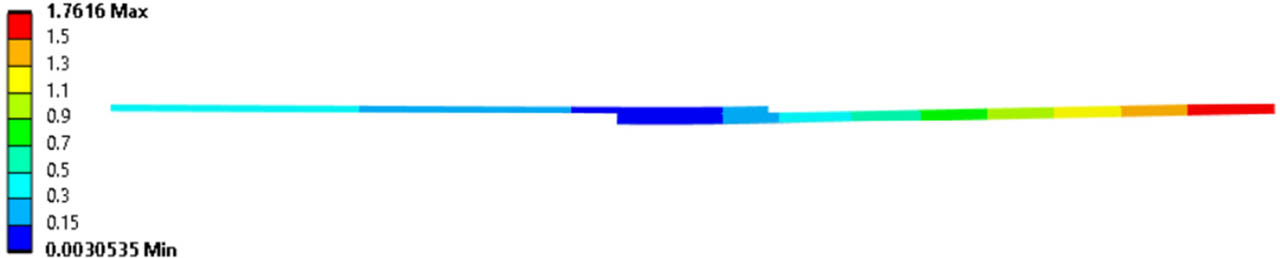
Fig. 7.
Residual displacement contour after simulated welding and cooling; displacement in mm.
4.3. Cohesive-zone calibration
The cohesive parameters could not be calculated uniquely from the experimental curves because normal opening and tangential slip occurred simultaneously. Several combinations of normal strength, tangential strength, normal fracture energy and tangential fracture energy were therefore tested in ANSYS. The calibration targets were the initial slope, onset of nonlinearity, peak force, displacement near peak force, post-peak load drop and qualitative deformation shape.
The final parameter set should be interpreted as an effective engineering fit. It is valid for this specific coupon geometry, welding condition and loading case. Direct transfer to another overlap length, surface condition, welding cycle or fatigue load case would require additional validation [26–27,31].
Table 5.
ANSYS fracture-based debonding parameters used in the calibrated model.
| Parameter | Value | Unit |
|---|---|---|
| Debonding interface mode | Combined normal and tangential | - |
| Tangential slip under normal compression | Enabled | - |
| Maximum normal contact stress | 4 | MPa |
| Critical fracture energy for normal separation | 5.103E-05 | mJ/mm2 |
| Maximum equivalent tangential contact stress | 6 | MPa |
| Critical fracture energy for tangential slip | 0.00065103 | mJ/mm2 |
| Artificial damping coefficient | 0.7 | s |
| Power law exponent for combined debonding | 1.5 | - |
5. DISCUSSION
5.1. Deformation and debonding pattern
The calibrated model reproduced the qualitative character of the bending test. The initial numerical slope corresponded to the global bending stiffness of the hybrid coupon. The maximum force was associated with unstable degradation of the welded interface, and the post-peak response represented progressive loss of load transfer in the overlap.
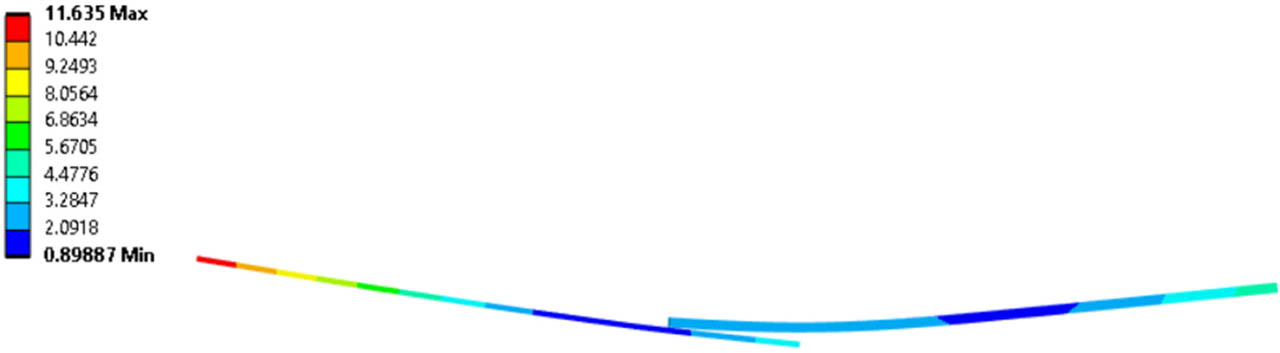
Fig. 8.
Numerical deformation of the specimen near failure; displacement in mm.
The visible gap in Fig. 8 is the simulated debonding zone that developed from the cohesive contact debonding formulation during mechanical loading. Before damage initiation, the interface transferred normal and tangential tractions through the bonded contact formulation. After the debonding criterion was reached, the traction-carrying capability of the interface was progressively reduced according to the calibrated cohesive law, which produced the apparent opening between the adherends.
5.2. Stress redistribution in the overlap
The stress contours show that the welded overlap did not fail under a uniform stress state. Normal and shear components concentrated near the overlap edge and then migrated toward the remaining bonded ligament as the debonded region expanded. This interpretation agrees with single-lap-joint literature, where local peel and edge effects dominate failure rather than average overlap stress [19,20,21].
The line-shaped stress concentrations visible in Figs. 9 and 10 are located in the bonded overlap area immediately before final failure and correspond to the interface transition/debonding front where a small remaining bonded ligament transfers load after partial degradation of the joint. Their orientation is approximately parallel to the supports because the overlap edge and the numerical debonding front are also aligned across the coupon width. These stresses represent the critical load-transfer region and stress migration path. They are not treated as mesh-independent material stresses or as direct fracture parameters.
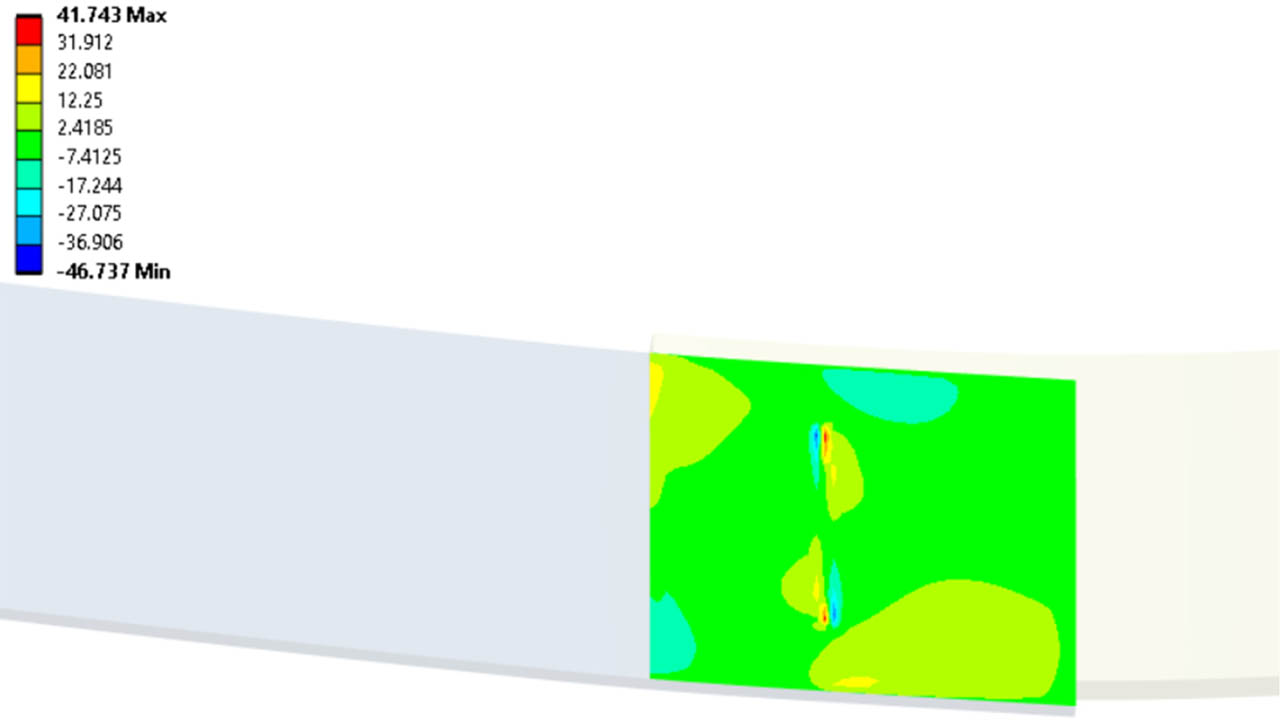
Fig. 9.
Shear stress distribution in the welded overlap region; stress in MPa.
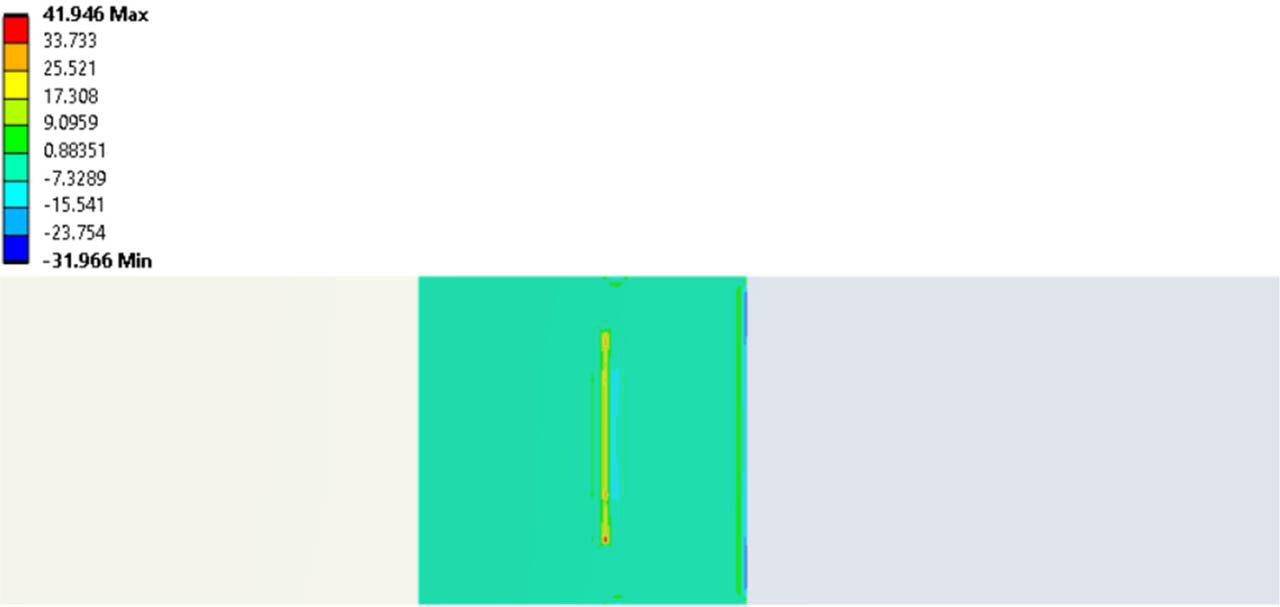
Fig. 10.
Out-of-plane normal stress distribution in the welded overlap region; stress in MPa.
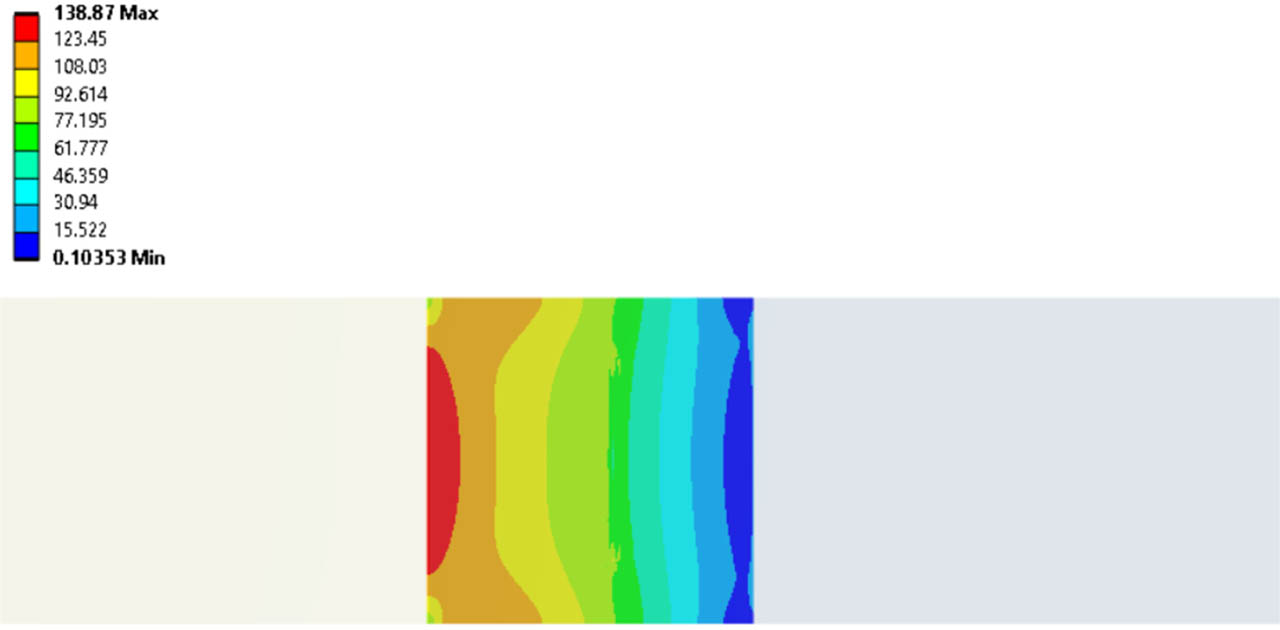
Fig. 11.
Equivalent von Mises stress distribution in the welded overlap region; stress in MPa.
The equivalent von Mises stress is reported only to describe stress redistribution in the aluminum and composite adherends. It is not used as the cohesive failure criterion for the welded interface, which is governed by the calibrated cohesive debonding formulation.
The local stresses near the debonding front were used as qualitative indicators of the critical region and stress migration. They should not be treated as mesh-independent fracture parameters. A more rigorous fracture characterization would require crack-front tracking and mode-separated energy-release rates measured or computed in dedicated fracture specimens [25–26].
For aerospace-oriented development, this screening approach is still useful because it indicates whether the welded interface can force adherend deformation before debonding. It also provides a calibrated numerical baseline that can later be checked under fatigue spectra and repair-relevant loading conditions [18,32–33].
6. SUMMARY
The study is placed in the wider context of aircraft composite repair and reinforcement, including civil and military aircraft. Setlak et al. emphasized that composite materials used in military aircraft require continued investigation because their performance depends on material architecture, manufacturing route, anisotropy and damage mechanisms [1]. For the present joint concept, this means that the repair method cannot be evaluated only by nominal strength; the post-weld state, local load path, failure mode, inspectability and removability must also be considered.
The present work continues the authors' previous research on resistance-welded thermoplastic composite-metal joints. In the earlier residual-stress study, the resistance-welding thermal cycle and the subsequent cooling stage were analyzed to determine how welding-induced residual stresses and initial curvature develop in hybrid aluminum-composite coupons [15,18]. The present article uses that post-weld state as the starting condition for the mechanical assessment: the residual curvature and stress effect were introduced into the ANSYS model through an initial strain condition before applying the three-point-bending load.
In this study, six resistance-welded PC/CF-Al7075 single-lap coupons were tested in an adapted three-point-bending configuration. The test was not used as a pure mode-I or mode-II fracture experiment. Instead, it was used as a screening method that combines adherend bending, local peel, tangential slip, interface degradation and the influence of the post-weld residual state. The recorded force was converted to the nominal bending stress indicator, and only the data up to the first post-failure drop of force to zero were retained. The experimental stress-displacement curves were then used to calibrate an effective cohesive-zone model that reproduces the measured stiffness, peak response, post-peak load loss and simulated debonding pattern.
At the current development stage, these welds should be considered mainly for temporary, secondary or low-demand repair and reinforcement concepts. The thermoplastic character of the PC/CF patch is important because a temporary patch or local reinforcement could in principle be heated, formed, consolidated and later removed or reworked during scheduled maintenance. However, the present results do not justify use as a stand-alone primary structural repair without further static, fatigue, environmental and damage-tolerance validation [32–33].
Three-point bending is suitable as a simple screening test for the global behavior of resistance-welded PC/CF-Al7075 single-lap coupons, but it does not provide a pure mode-I or mode-II fracture property.
The six tested coupons reached peak forces from 246.1 N to 293.7 N. The mean peak force was 274.0 N, with a standard deviation of 19.2 N and a coefficient of variation of 7.0%.
The nominal bending stress indicators ranged from 131.8 MPa to 157.3 MPa, with a mean value of 146.8 MPa and a standard deviation of 10.3 MPa. These values are coupon-level screening indicators, not transferable interface-strength allowables.
The apparent work per overlap area ranged from 0.615 mJ/mm2 to 0.804 mJ/mm2, with a mean value of 0.728 mJ/mm2. This value is useful for comparing coupons within this campaign, but it must not be interpreted as material fracture energy.
The joint was strong enough to produce visible adherend bending before final debonding, which confirms that the measured response combined joint behavior and adherend deformation.
Welding-induced residual stress and initial curvature were included through an initial strain condition because they alter the local opening and sliding state at the overlap before mechanical loading begins.
The ANSYS cohesive-zone model predicted a peak nominal stress of approximately 156 MPa, corresponding to a peak force of approximately 291 N. This is about 6.3% higher than the experimental mean and remains within the experimental ranges of 131.8–157.3 MPa and 246.1–293.7 N.
The highest local stresses appeared near the overlap edge and then moved toward the remaining bonded ligament. These locations should be treated as probable damage-initiation zones in future aerospace fatigue studies.
The current experimental dataset should still be treated as screening-level data. Further work should include a larger coupon population, cyclic loading, environmental conditioning and validation of the cohesive-zone parameters for repair-relevant loading cases.