
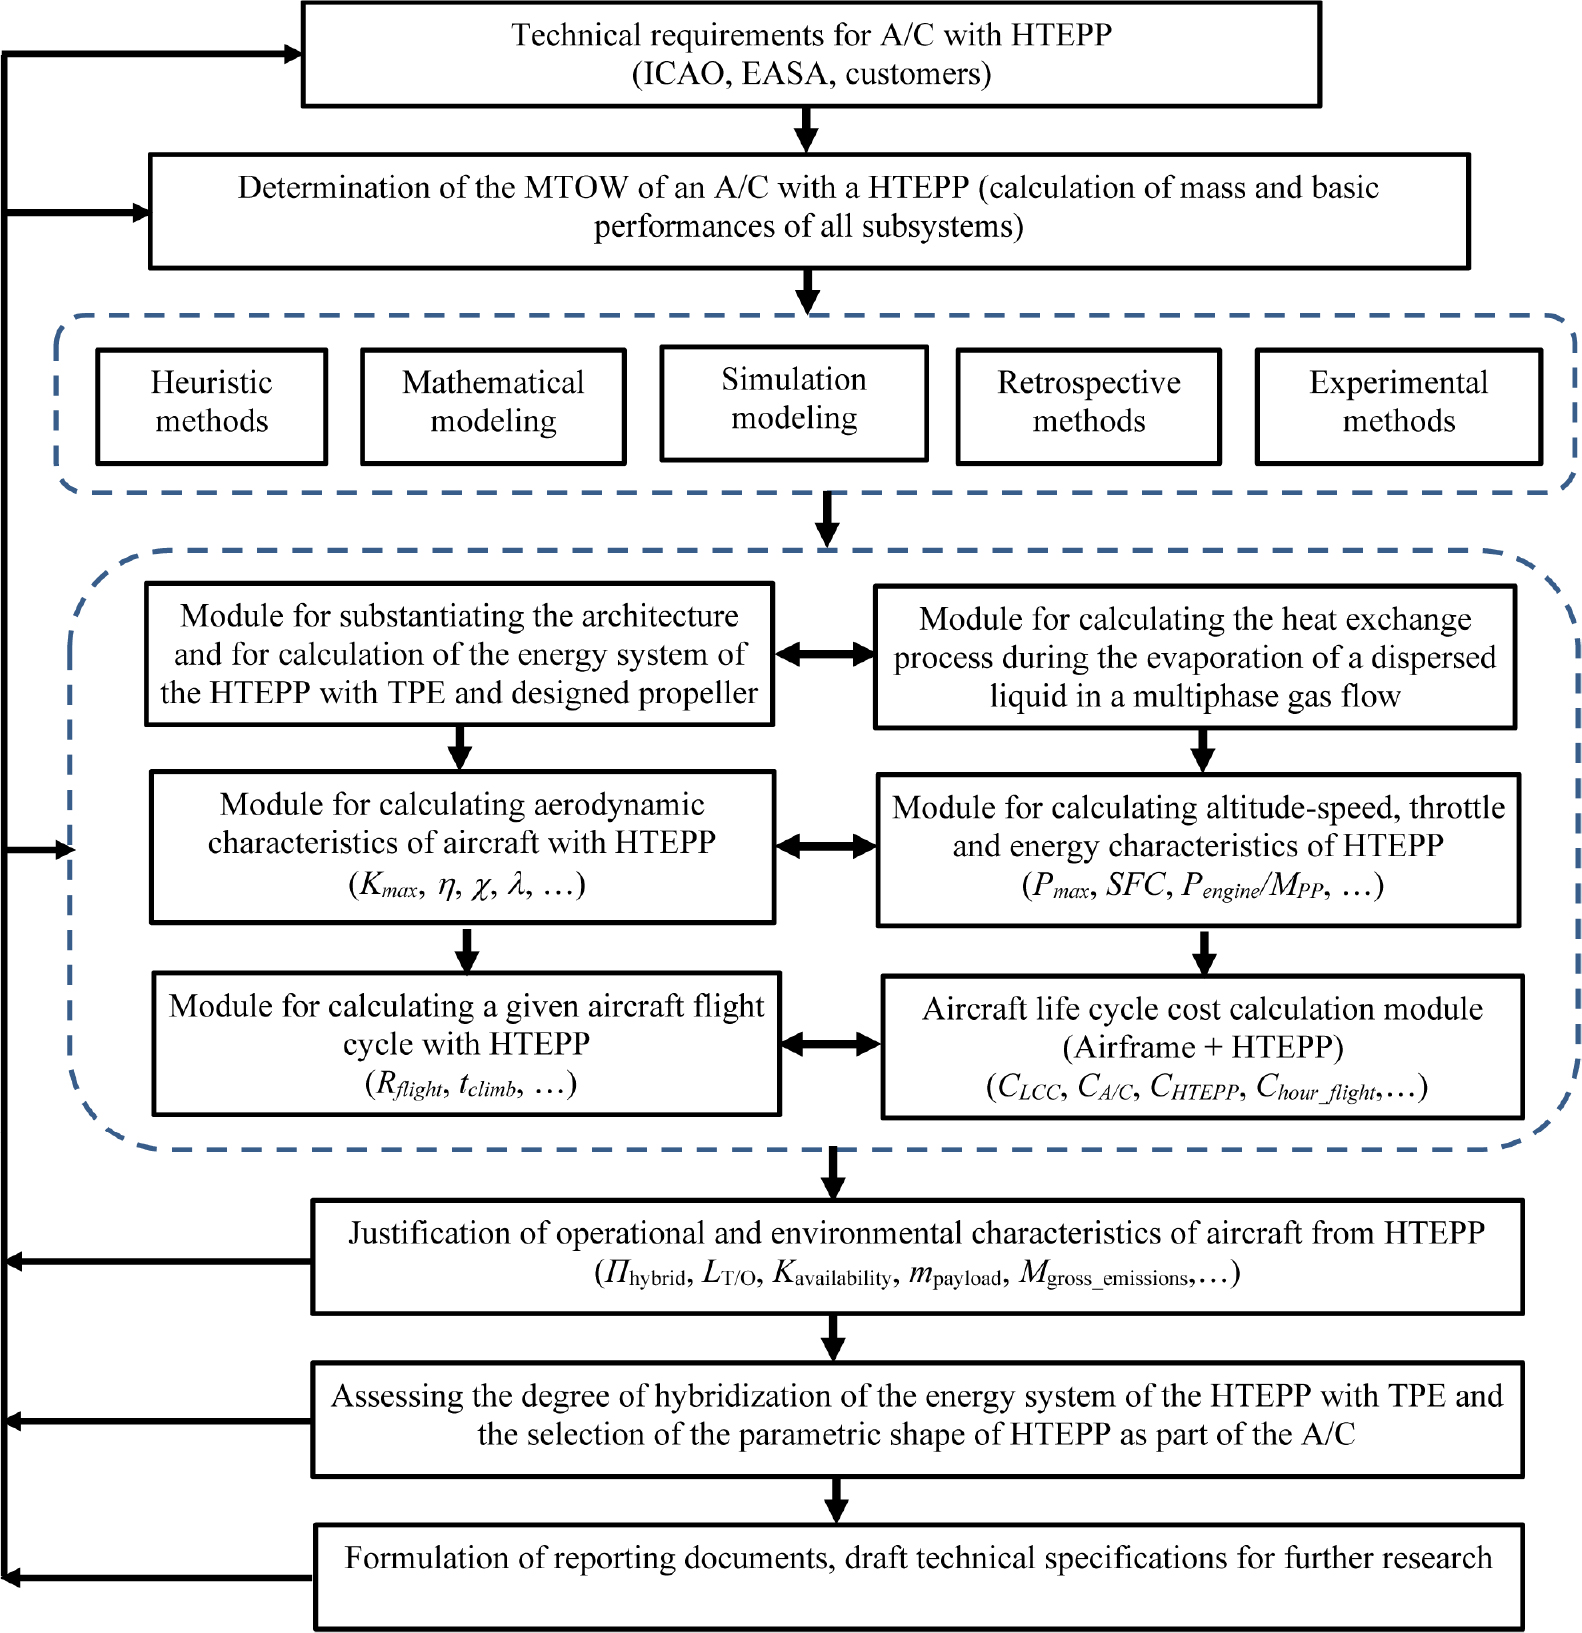
Fig. 1.
Scheme of formation of parametric shape of HTEPP as part of A/C.
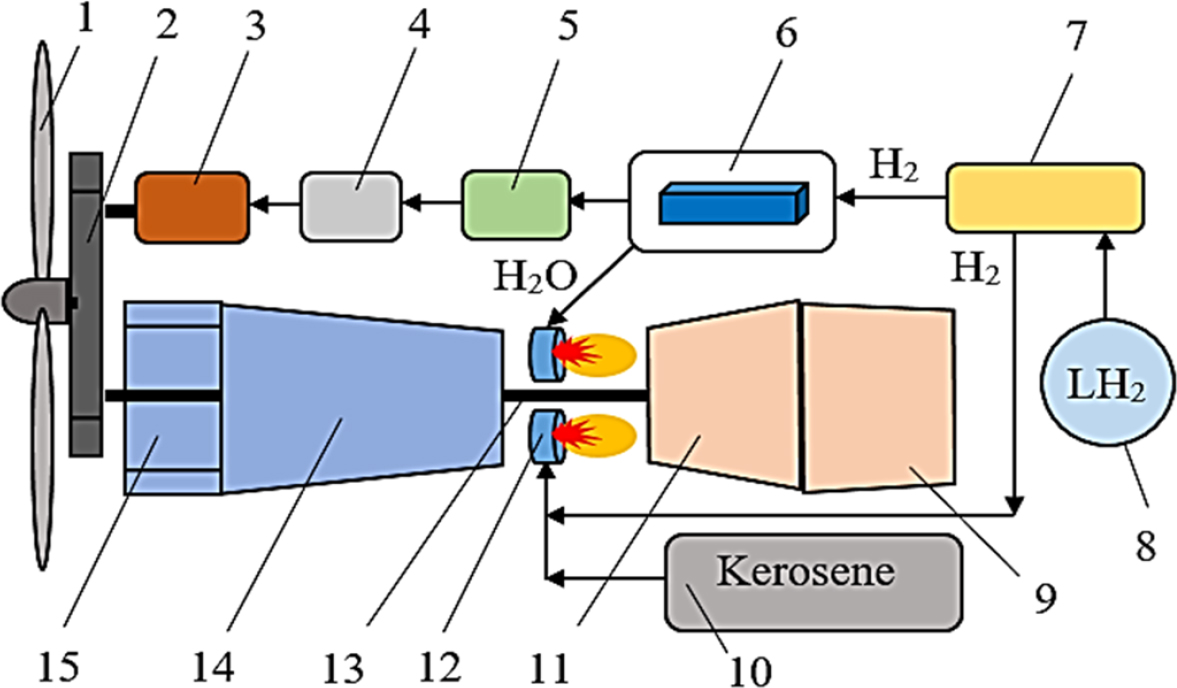
Fig. 2.
Scheme 1 of an HTEPP with a turboprop engine (using kerosene, liquid hydrogen for the combustion chamber and the FC): 1 – Propeller; 2 – Gearbox; 3 – Electric motor; 4 – Power control and distribution system; 5 – Battery; 6 – Power unit with FC; 7 – Hydrogen evaporator; 8 – Liquid hydrogen tank; 9 – Exhaust; 10 – Hydrocarbon fuel tank; 11 – Turbine; 12 – Combustion chamber; 13 – Engine shaft; 14 – Compressor; 15 – Air intake.
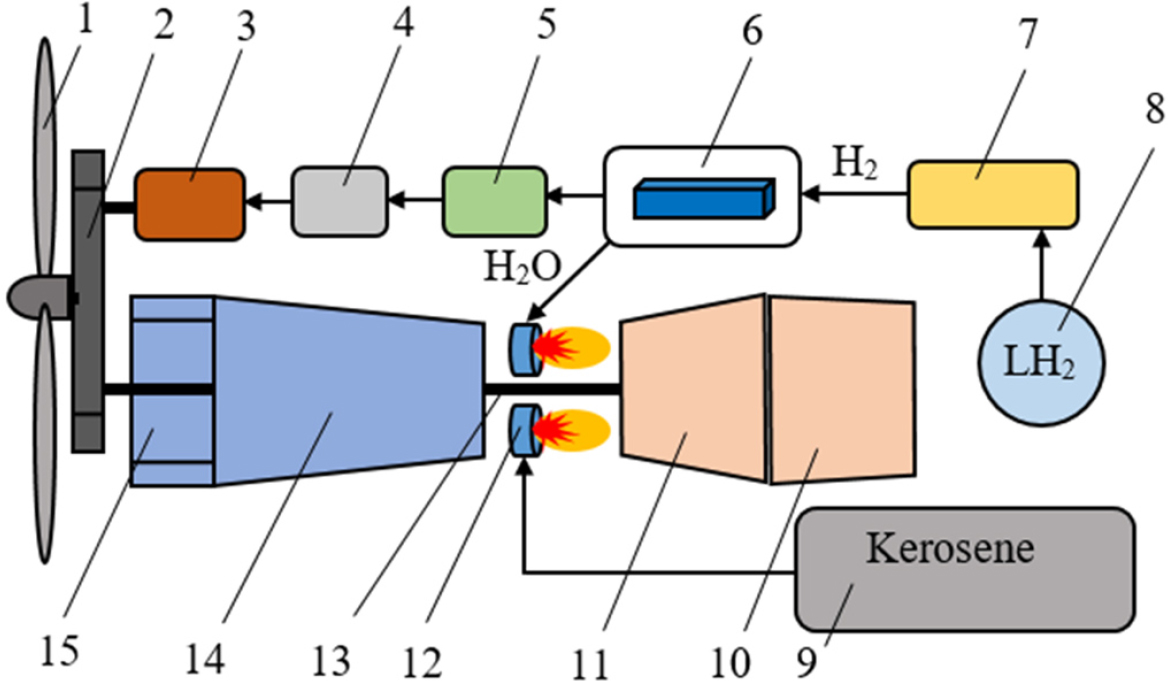
Fig. 3.
Scheme 2 of an HTEPP with a turboprop engine (using kerosene and liquid hydrogen supplied to the FCs): 1 – Propeller; 2 – Gearbox; 3 – Electric motor; 4 – Power control and distribution system; 5 – Battery; 6 – Power unit with FC; 7 – Hydrogen evaporator; 8 – Liquid hydrogen tank; 9 – Hydrocarbon fuel tank; 10 – Exhaust; 11 – Turbine; 12 – Combustion chamber; 13 – Engine shaft; 14 – Compressor; 15 – Air intake.
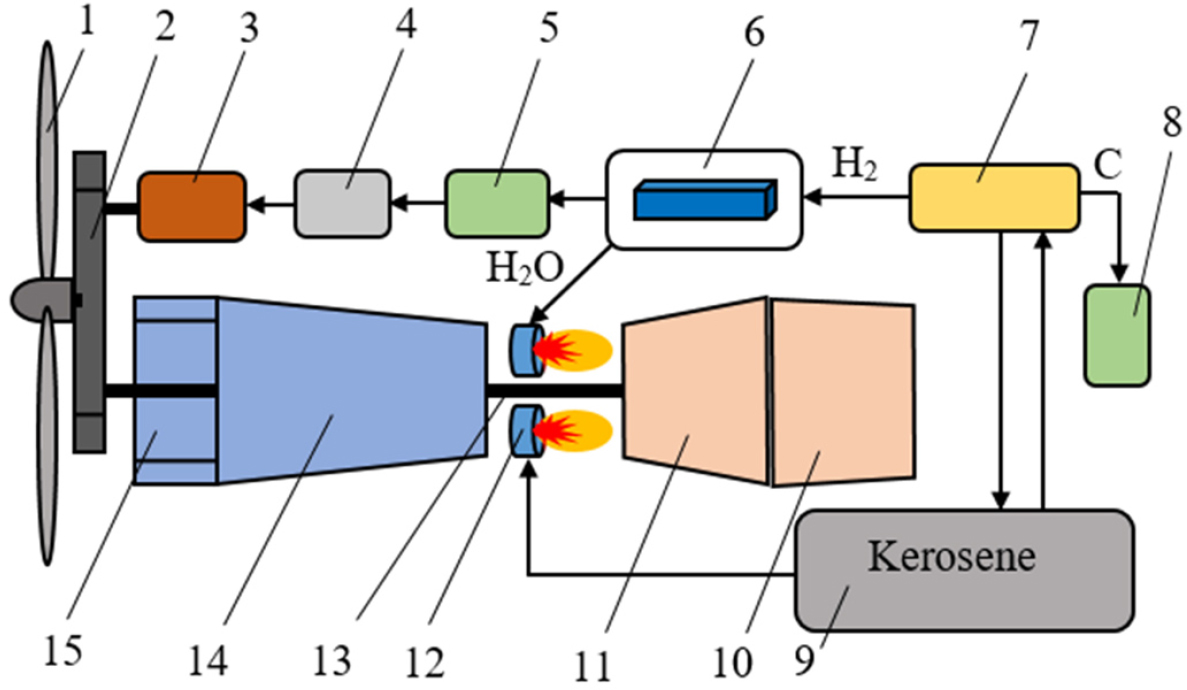
Fig. 4.
Scheme 3 of an HTEPP with a turboprop engine (with hydrogen conversion from kerosene for FC supply): 1 – Propeller; 2 – Gearbox; 3 – Electric motor; 4 – Power control and distribution system; 5 – Battery; 6 – Power unit with FC; 7 – Steam reforming plant; 8 – Soot trap; 9 – Hydrocarbon fuel tank; 10 – Exhaust; 11 – Turbine; 12 – Combustion chamber; 13 – Engine shaft; 14 – Compressor; 15 – Air intake.
Table 1.
Characteristics of HTEPP power at aircraft flight profile stages.
| Aircraft version with HTEPP | Start, warm-up, taxiing | Run-up, takeoff to circuit altitude | Climb to flight level | Cruise flight | Descent to circuit altitude | Landing approach | Taxiing into the parking lot | Total flight hours |
|---|---|---|---|---|---|---|---|---|
| Equivalent power Ne, stage average, kW | 170 | 1060 | 840 | 500 | 150 | 200 | 170 | |
| Stage duration t, min | 8 | 1.5 | 17 | 107.25 | 8 | 1.5 | 8 | 151.25 |
| Ne×t, kWh | 22.67 | 26.50 | 238.00 | 893.75 | 20.00 | 5.00 | 22.67 |
Table 2.
Preliminary calculation results of HTEPP energy system characteristics (Schemes 1 and 2).
| Energy system characteristic | Parameter value | |||
|---|---|---|---|---|
| Share of electric power at flight (hybridization degree), % | 0.35 | 0.4 | 0.5 | 0.6 |
| FC required electric power, kW | 175.0 | 200.0 | 250.0 | 300.0 |
| Total required battery charge during taxiing, takeoff and climb, kWh | 287.17 | |||
| Battery power at takeoff and climb, kW | 10.81 | 21.62 | 43.24 | 64.86 |
| Mass of battery, kg | 13.3 | 26.7 | 53.3 | 80.0 |
| Battery volume, l | 6.7 | 13.3 | 26.7 | 40.0 |
| FC PEMFC high temperature, 150°C | ||||
| Module efficiency, % | 0.65 | |||
| Mass of FC stack, kg | 60.34 | 68.97 | 86.21 | 103.45 |
| Volume of FC stack, l | 54.69 | 62.50 | 78.13 | 93.75 |
| Mass of FC system, kg | 372.34 | 425.53 | 531.91 | 638.30 |
| Volume of FC system, l | 500.00 | 571.43 | 714.29 | 857.14 |
| Required hydrogen consumption, kg/h | 6.825 | 7.800 | 9.749 | 11.699 |
| Water consumption at FC outlet, kg/s | 0.017 | 0.019 | 0.024 | 0.029 |
| Required air consumption at fuel cell inlet, kg/s | 0.065 | 0.075 | 0.093 | 0.112 |
| Mass of required hydrogen, kg | 16.29 | 18.62 | 23.28 | 27.93 |
| Mass of liquid hydrogen tank, kg | 108.63 | 124.14 | 155.18 | 186.21 |
| Volume of liquid hydrogen tank, l | 230.14 | 263.01 | 328.77 | 394.52 |
| Number of electric motors, pcs. | 2 | |||
| Mass of electric motor, kg | 8.75 | 10.00 | 12.50 | 15.00 |
| Volume of electric motor control unit, l | 8.75 | 10.00 | 12.50 | 15.00 |
Table 3.
Balance of fuel cell power consumption.
| Electric power, kW, kW | Thermal losses in FC, kW | H2 flow rate through FC, kg/s | Vapor + heating required energy, kW | Available power, kW | Available H2 flow for engine, kg/s |
|---|---|---|---|---|---|
| 400 | 140 | 0.0015 | 9.42 | 130.58 | 0.0251 |
| 500 | 175 | 0.0019 | 11.77 | 163.23 | 0.0313 |
| 600 | 210 | 0.0023 | 14.12 | 195.88 | 0.0376 |
| 700 | 245 | 0.0027 | 16.48 | 228.52 | 0.0439 |
| 800 | 280 | 0.0030 | 18.83 | 261.17 | 0.0501 |
| 900 | 315 | 0.0034 | 21.19 | 293.81 | 0.0564 |
| 1000 | 350 | 0.0038 | 23.54 | 326.46 | 0.0627 |
| 1100 | 385 | 0.0042 | 25.89 | 359.11 | 0.0690 |
| 1200 | 420 | 0.0045 | 28.25 | 391.75 | 0.0752 |
| 1300 | 455 | 0.0049 | 30.60 | 424.40 | 0.0815 |
| 1400 | 490 | 0.0053 | 32.96 | 457.04 | 0.0878 |
| 1500 | 525 | 0.0057 | 35.31 | 489.69 | 0.0940 |
| 1600 | 560 | 0.0061 | 37.67 | 522.33 | 0.1003 |
Table 4.
Preliminary calculation results of HTEPP energy system characteristics (scheme 3).
| Energy system characteristic | Parameter value | |||
|---|---|---|---|---|
| Share of electric power in flight (hybridization degree), % | 0.35 | 0.4 | 0.5 | 0.6 |
| Required electric power of FC, kW | 175.0 | 200.0 | 250.0 | 300.0 |
| Total battery charge required for taxiing, takeoff and climbing, kWh | 287.17 | |||
| Mass of battery, kg | 13.3 | 26.7 | 53.3 | 80.0 |
| FC SOFC high temperature, 900°C | ||||
| Module efficiency, % | 0.65 | |||
| Mass of FC stack, kg | 175.00 | 200.00 | 250.00 | 300.00 |
| Volume of FC stack, l | 583.33 | 666.67 | 833.33 | 1000.00 |
| Mass of FC system, kg | 250.00 | 285.71 | 357.14 | 428.57 |
| Released thermal power of FC system, kW | 61.25 | 70 | 87.5 | 105 |
| Required hydrogen consumption, kg/h | 6.82 | 7.80 | 9.75 | 11.70 |
| Required kerosene consumption, kg/h | 20.77 | 23.74 | 29.67 | 35.61 |
| Mass of required kerosene, kg | 49.59 | 56.67 | 70.84 | 85.01 |
| Water consumption at FC outlet, kg/s | 0.02 | 0.02 | 0.02 | 0.03 |
| Required water consumption at cracking reactor inlet, kg/s | 0.011 | 0.013 | 0.016 | 0.019 |
| Available water remainder, kg/s | 0.006 | 0.007 | 0.008 | 0.010 |
| Mass of cracking reactor, kg | 6.71 | 7.67 | 9.59 | 11.50 |
| Volume of cracking reactor, l | 11.11 | 12.69 | 15.87 | 19.04 |
| Number of electric motors, pcs | 2 | |||
| Mass of electric motor, kg | 8.75 | 10.00 | 12.50 | 15.00 |
| Mass of electric motor control unit + DC/DC converter, kg | 7.29 | 8.33 | 10.42 | 12.50 |
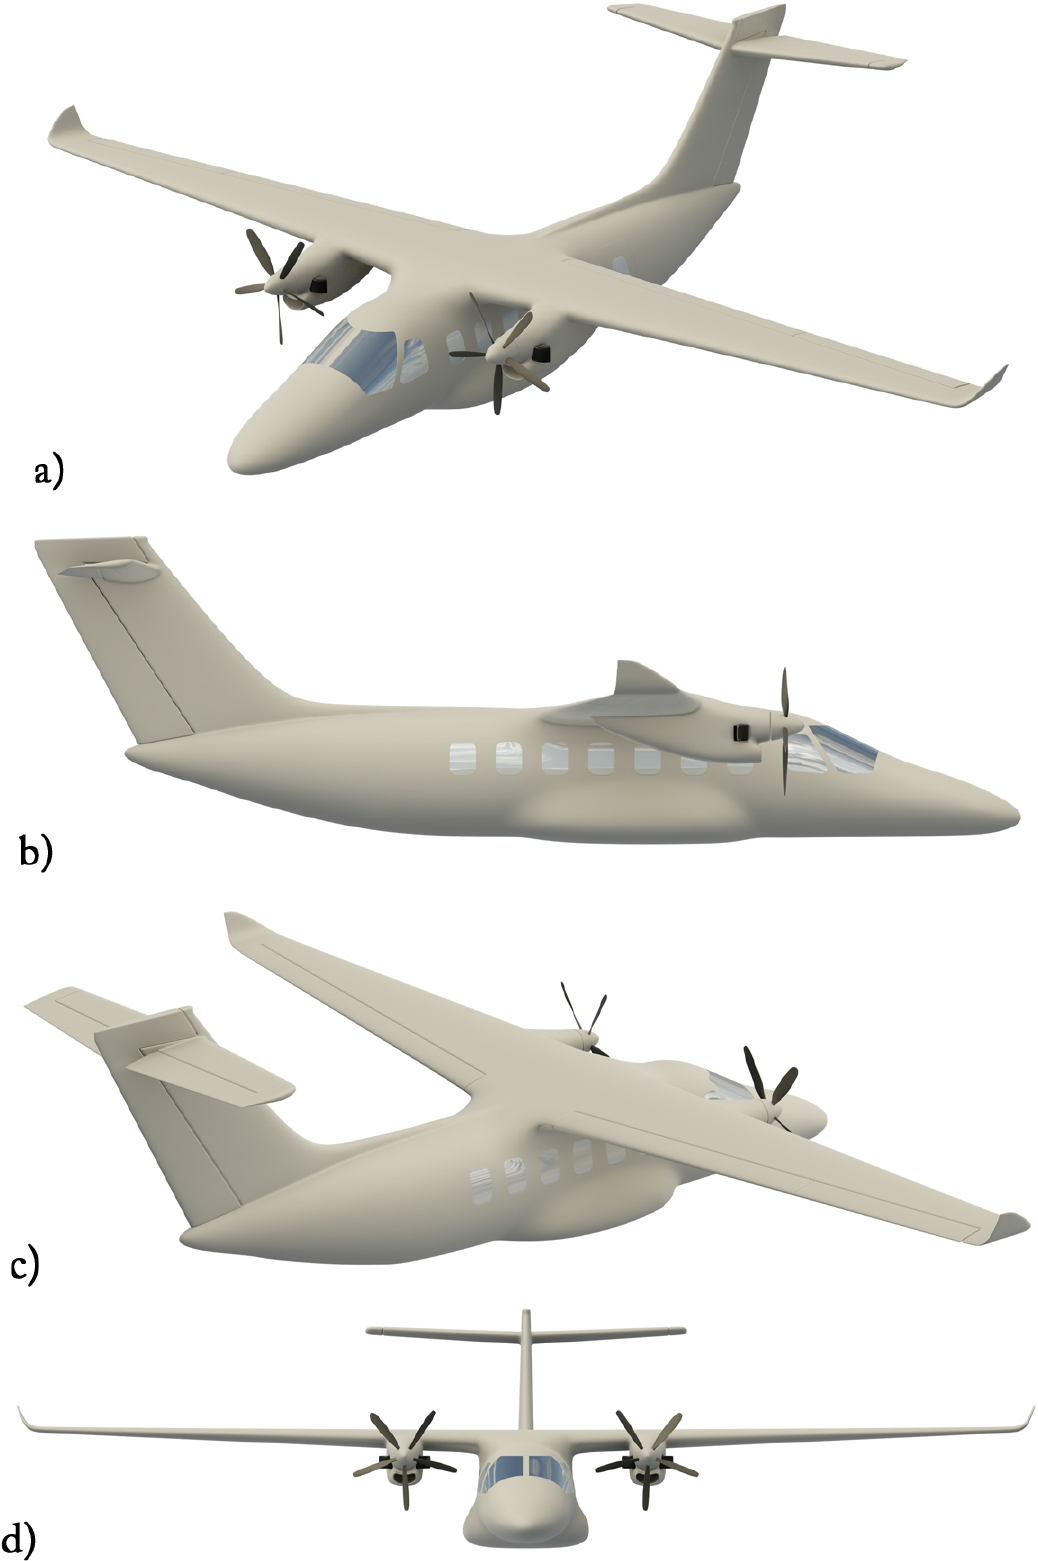
Fig. 5.
Conceptual model of a new light passenger aircraft equipped with an HTEPP.
Table 5.
Comparison of calculated results and experimental data for the L-410UVP-E20 aircraft.
| Performance parameter | Experimental data | Calculated data | Relative error, % |
|---|---|---|---|
| Takeoff length, m | 390 | 389 | 0.25 |
| Take-off distance, m | 560 | 558 | 0.35 |
| Fuel consumption per kilometer, kg/km | 0.76 | 0.785 | 3.29 |
| Hourly fuel consumption, kg/h | 249 | 244 | 2.0 |
Table 6.
Mass balance of the aircraft design for different energy schemes (hybridization degree = 0.4).
| Energy system scheme | Take-off mass, kg | Airframe mass, kg | PP mass (engine, propellers, systems), kg | Mass of the energy system and battery, kg | Crew mass, kg | Fuel mass, kg | Commercial load mass, kg |
|---|---|---|---|---|---|---|---|
| base model | 6600 | 2920 | 700 | 0 | 180 | 1000 | 1800 |
| Scheme 1 | 7380 | 2870 | 660 | 1410 | 180 | 460 | 1800 |
| Scheme 2 | 7415 | 2870 | 660 | 1360 | 180 | 545 | 1800 |
| Scheme 3 | 7160 | 2870 | 660 | 1110 | 180 | 540 | 1800 |
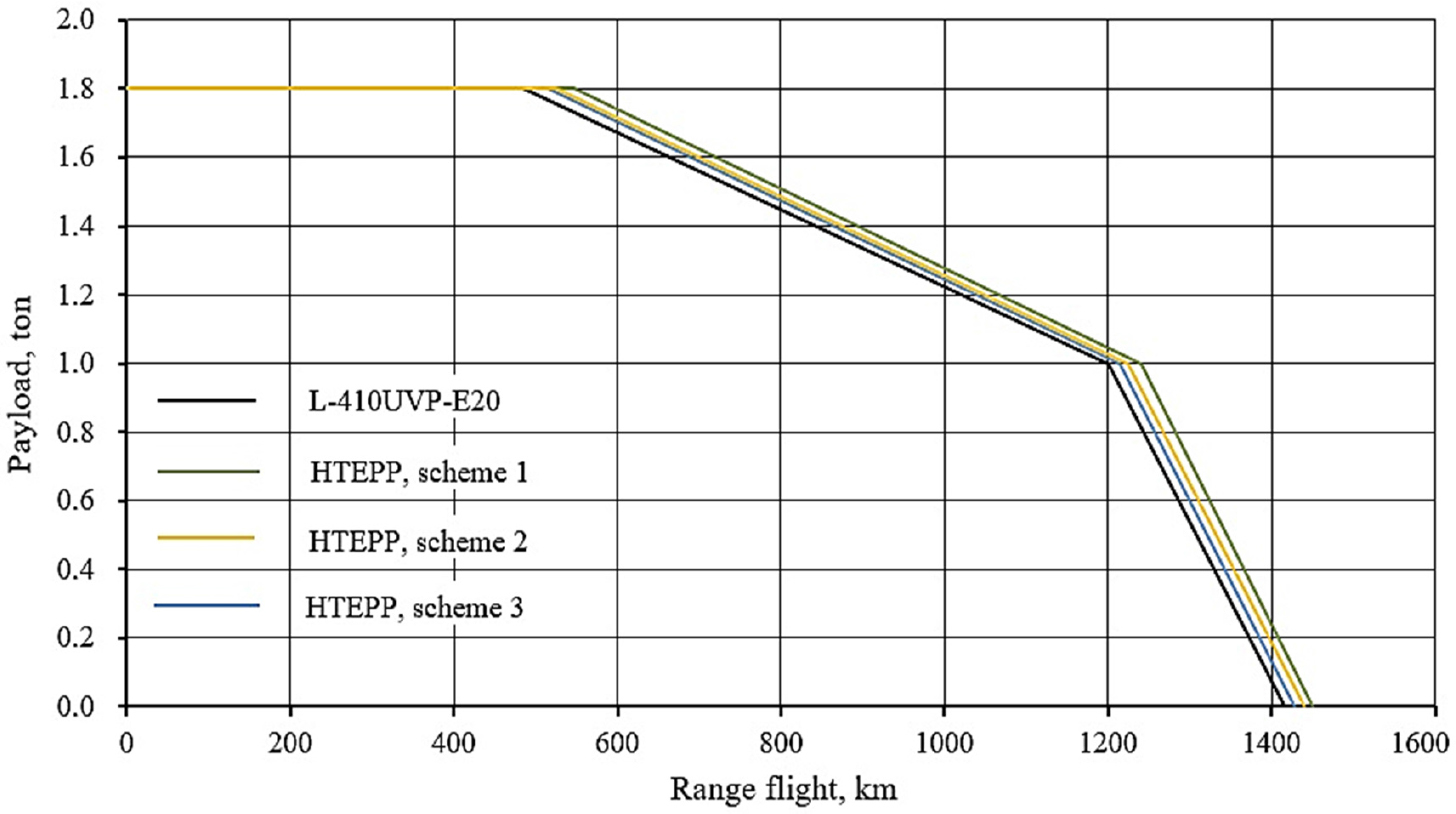
Fig. 6.
Payload–range diagram.
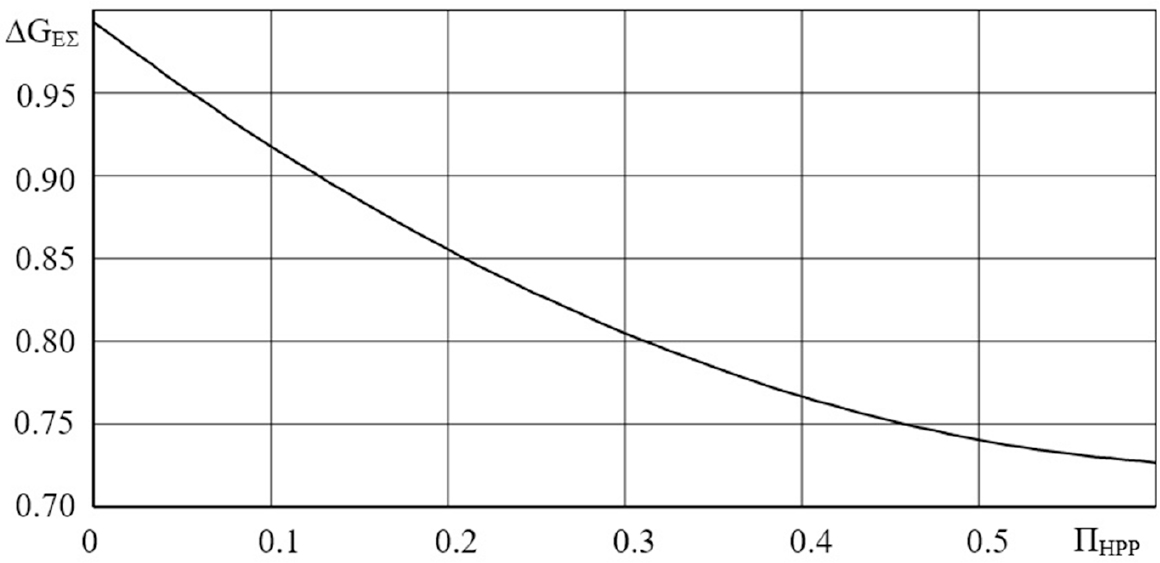
Fig. 7.
Dependence of the change in gross harmful emissions of the upgraded aircraft on the degree of hybridization.
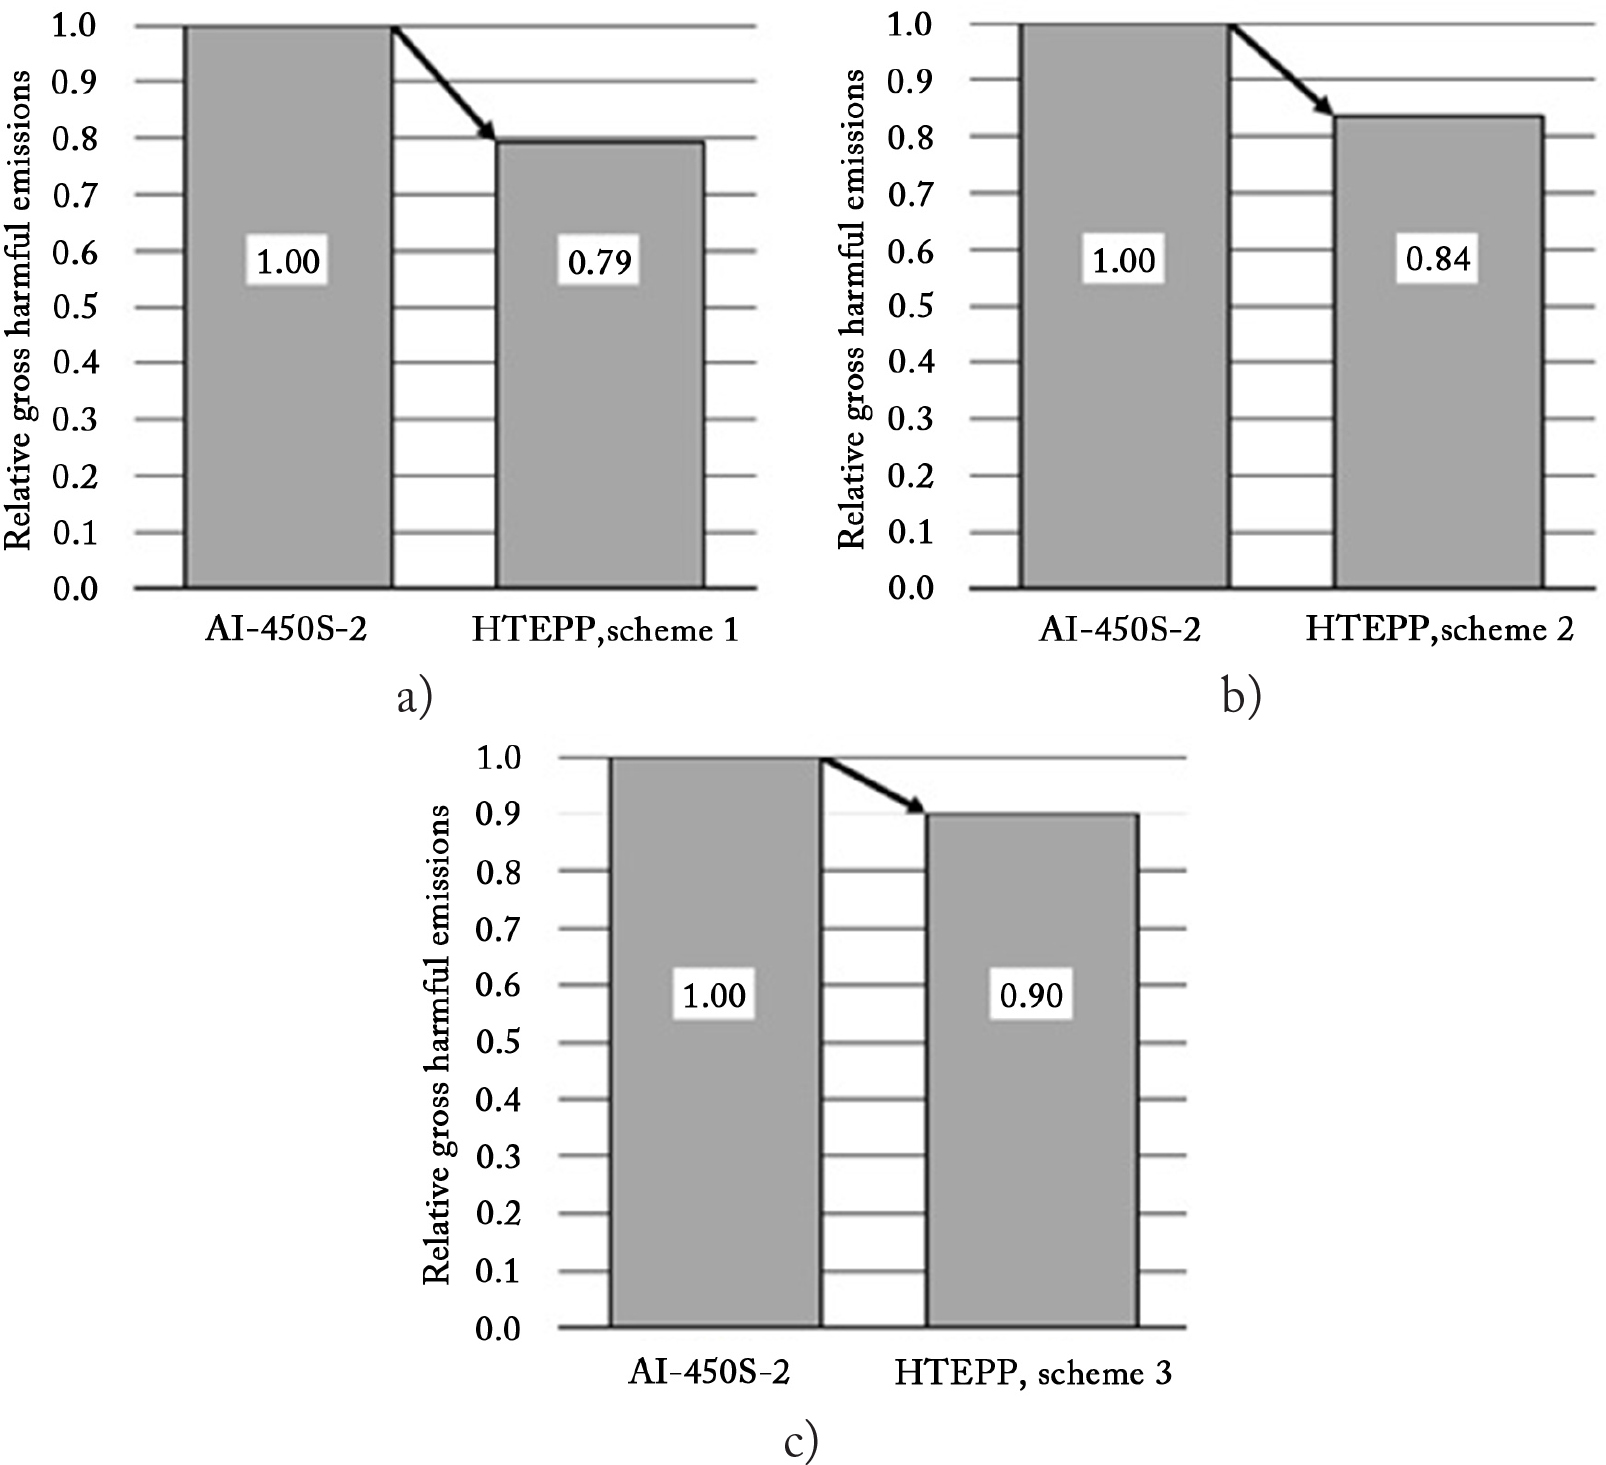
Fig. 8.
Comparative evaluation of gross harmful emissions for HTEPP configurations using energy Scheme 1 (a), Scheme 2 (b), Scheme 3 (c).