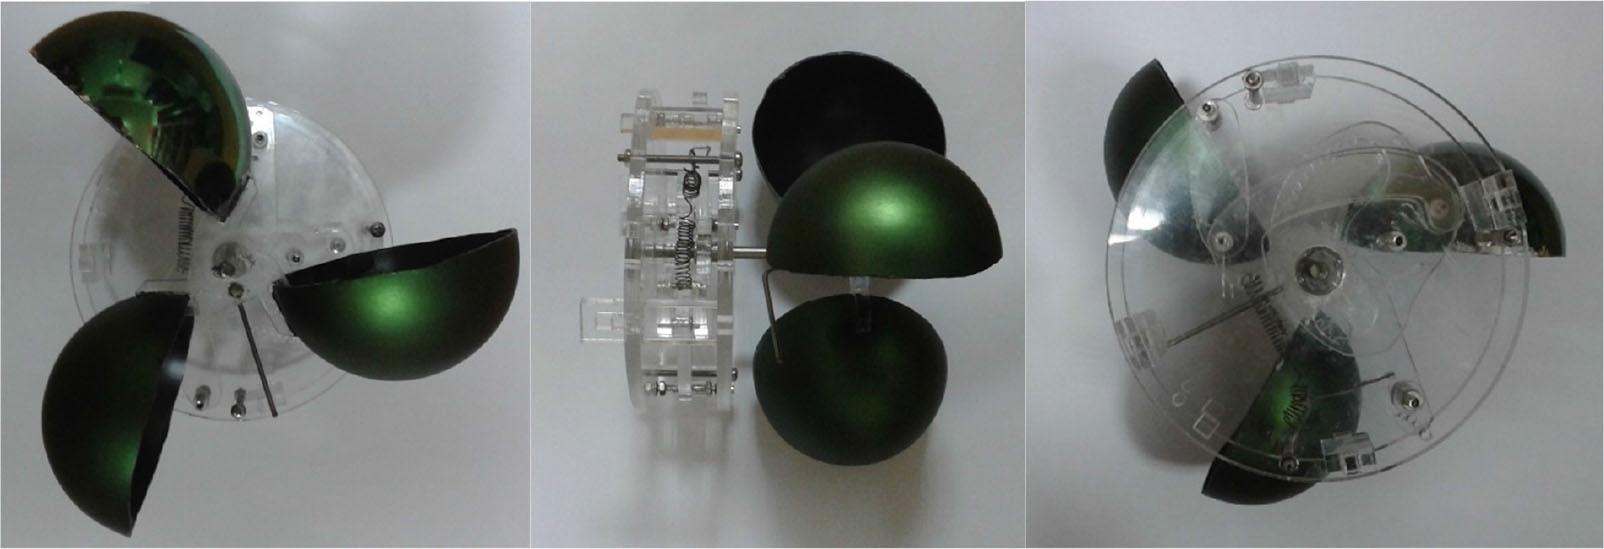
Fig. 1.

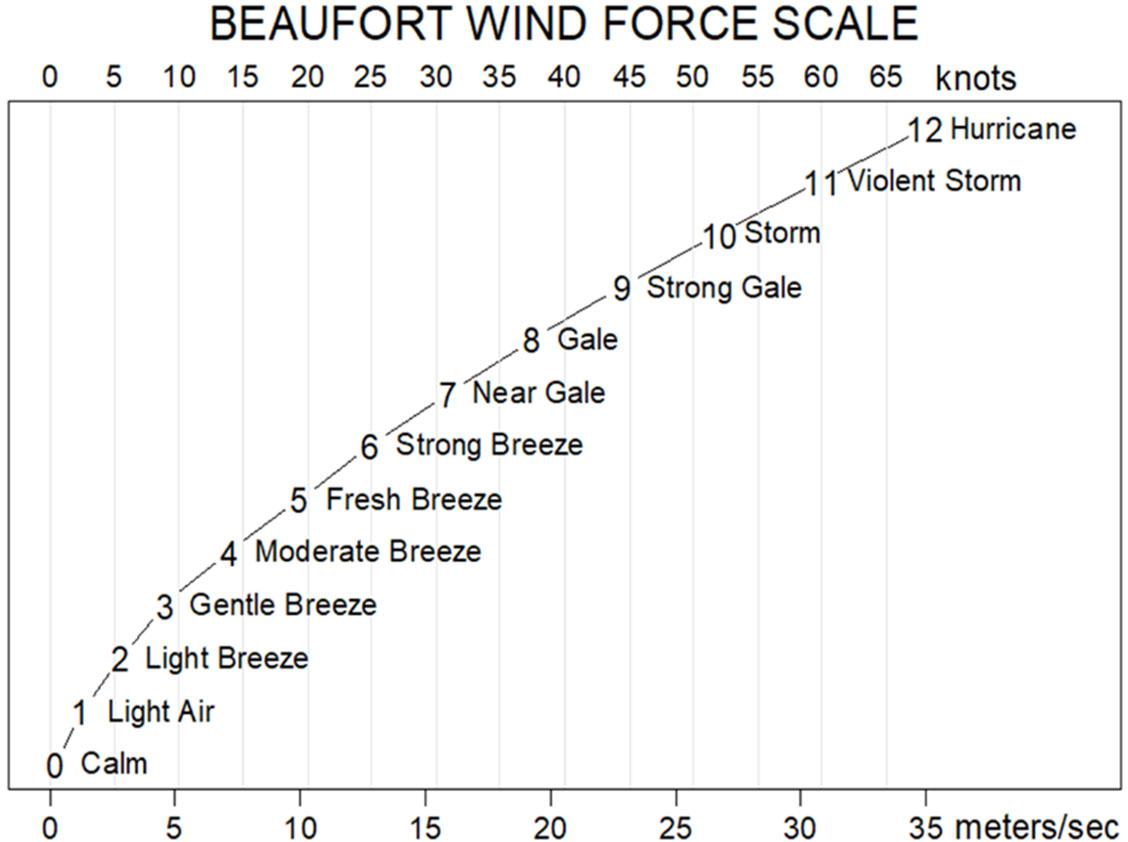
Fig. 2.

Fig. 3.

Fig. 4.
![Wind speed distribution for different K. Taken from [12].](https://sciendo-parsed.s3.eu-central-1.amazonaws.com/65f1cb26812d8816c96acf71/j_tar-2024-0006_fig_004.jpg?X-Amz-Algorithm=AWS4-HMAC-SHA256&X-Amz-Content-Sha256=UNSIGNED-PAYLOAD&X-Amz-Credential=AKIA6AP2G7AKOUXAVR44%2F20251205%2Feu-central-1%2Fs3%2Faws4_request&X-Amz-Date=20251205T191339Z&X-Amz-Expires=3600&X-Amz-Signature=2d893026e875f517f1e04109d6e892fba9300dc0dbbb1283953e6d8333cb8d65&X-Amz-SignedHeaders=host&x-amz-checksum-mode=ENABLED&x-id=GetObject)
Fig. 5.
![Taken from Ref. [19]. https://www.nssl.noaa.gov/projects/hazard/img/ttor9599.gif](https://sciendo-parsed.s3.eu-central-1.amazonaws.com/65f1cb26812d8816c96acf71/j_tar-2024-0006_fig_005.jpg?X-Amz-Algorithm=AWS4-HMAC-SHA256&X-Amz-Content-Sha256=UNSIGNED-PAYLOAD&X-Amz-Credential=AKIA6AP2G7AKOUXAVR44%2F20251205%2Feu-central-1%2Fs3%2Faws4_request&X-Amz-Date=20251205T191339Z&X-Amz-Expires=3600&X-Amz-Signature=18c3c92737b79ea86555a8e406d464551c58ab93c6898790d9fe2b827359178e&X-Amz-SignedHeaders=host&x-amz-checksum-mode=ENABLED&x-id=GetObject)
Fig. 6.
![Seif dune (barkhans) is a consequence of uneven wind on a scale of hundreds of meters. Image from Ref. [10].](https://sciendo-parsed.s3.eu-central-1.amazonaws.com/65f1cb26812d8816c96acf71/j_tar-2024-0006_fig_006.jpg?X-Amz-Algorithm=AWS4-HMAC-SHA256&X-Amz-Content-Sha256=UNSIGNED-PAYLOAD&X-Amz-Credential=AKIA6AP2G7AKOUXAVR44%2F20251205%2Feu-central-1%2Fs3%2Faws4_request&X-Amz-Date=20251205T191339Z&X-Amz-Expires=3600&X-Amz-Signature=46171cfac42dc062c6d5efe1cda483720a6ab70303c7dcc9d0c6197b1bdfedbc&X-Amz-SignedHeaders=host&x-amz-checksum-mode=ENABLED&x-id=GetObject)
Fig. 7.
![Average wind power. Mexico (up), Latvia (down). Pictures are taken from Ref. [15].](https://sciendo-parsed.s3.eu-central-1.amazonaws.com/65f1cb26812d8816c96acf71/j_tar-2024-0006_fig_007.jpg?X-Amz-Algorithm=AWS4-HMAC-SHA256&X-Amz-Content-Sha256=UNSIGNED-PAYLOAD&X-Amz-Credential=AKIA6AP2G7AKOUXAVR44%2F20251205%2Feu-central-1%2Fs3%2Faws4_request&X-Amz-Date=20251205T191339Z&X-Amz-Expires=3600&X-Amz-Signature=0adb86c13152ee488dab14c1516796a5cf3e8191311e5e8691d6615523e6ab73&X-Amz-SignedHeaders=host&x-amz-checksum-mode=ENABLED&x-id=GetObject)
Fig. 8.
![Taken from the study by Baseer et al.[3].](https://sciendo-parsed.s3.eu-central-1.amazonaws.com/65f1cb26812d8816c96acf71/j_tar-2024-0006_fig_008.jpg?X-Amz-Algorithm=AWS4-HMAC-SHA256&X-Amz-Content-Sha256=UNSIGNED-PAYLOAD&X-Amz-Credential=AKIA6AP2G7AKOUXAVR44%2F20251205%2Feu-central-1%2Fs3%2Faws4_request&X-Amz-Date=20251205T191339Z&X-Amz-Expires=3600&X-Amz-Signature=9f8e38ba903b2302b2b53804ea4aa81fe1ee9d91150a176d1863c5d47b573e40&X-Amz-SignedHeaders=host&x-amz-checksum-mode=ENABLED&x-id=GetObject)


![Wind speed distribution for different K. Taken from [12].](https://sciendo-parsed.s3.eu-central-1.amazonaws.com/65f1cb26812d8816c96acf71/j_tar-2024-0006_fig_004.jpg?X-Amz-Algorithm=AWS4-HMAC-SHA256&X-Amz-Content-Sha256=UNSIGNED-PAYLOAD&X-Amz-Credential=AKIA6AP2G7AKOUXAVR44%2F20251205%2Feu-central-1%2Fs3%2Faws4_request&X-Amz-Date=20251205T191339Z&X-Amz-Expires=3600&X-Amz-Signature=2d893026e875f517f1e04109d6e892fba9300dc0dbbb1283953e6d8333cb8d65&X-Amz-SignedHeaders=host&x-amz-checksum-mode=ENABLED&x-id=GetObject)
![Taken from Ref. [19]. https://www.nssl.noaa.gov/projects/hazard/img/ttor9599.gif](https://sciendo-parsed.s3.eu-central-1.amazonaws.com/65f1cb26812d8816c96acf71/j_tar-2024-0006_fig_005.jpg?X-Amz-Algorithm=AWS4-HMAC-SHA256&X-Amz-Content-Sha256=UNSIGNED-PAYLOAD&X-Amz-Credential=AKIA6AP2G7AKOUXAVR44%2F20251205%2Feu-central-1%2Fs3%2Faws4_request&X-Amz-Date=20251205T191339Z&X-Amz-Expires=3600&X-Amz-Signature=18c3c92737b79ea86555a8e406d464551c58ab93c6898790d9fe2b827359178e&X-Amz-SignedHeaders=host&x-amz-checksum-mode=ENABLED&x-id=GetObject)
![Seif dune (barkhans) is a consequence of uneven wind on a scale of hundreds of meters. Image from Ref. [10].](https://sciendo-parsed.s3.eu-central-1.amazonaws.com/65f1cb26812d8816c96acf71/j_tar-2024-0006_fig_006.jpg?X-Amz-Algorithm=AWS4-HMAC-SHA256&X-Amz-Content-Sha256=UNSIGNED-PAYLOAD&X-Amz-Credential=AKIA6AP2G7AKOUXAVR44%2F20251205%2Feu-central-1%2Fs3%2Faws4_request&X-Amz-Date=20251205T191339Z&X-Amz-Expires=3600&X-Amz-Signature=46171cfac42dc062c6d5efe1cda483720a6ab70303c7dcc9d0c6197b1bdfedbc&X-Amz-SignedHeaders=host&x-amz-checksum-mode=ENABLED&x-id=GetObject)
![Average wind power. Mexico (up), Latvia (down). Pictures are taken from Ref. [15].](https://sciendo-parsed.s3.eu-central-1.amazonaws.com/65f1cb26812d8816c96acf71/j_tar-2024-0006_fig_007.jpg?X-Amz-Algorithm=AWS4-HMAC-SHA256&X-Amz-Content-Sha256=UNSIGNED-PAYLOAD&X-Amz-Credential=AKIA6AP2G7AKOUXAVR44%2F20251205%2Feu-central-1%2Fs3%2Faws4_request&X-Amz-Date=20251205T191339Z&X-Amz-Expires=3600&X-Amz-Signature=0adb86c13152ee488dab14c1516796a5cf3e8191311e5e8691d6615523e6ab73&X-Amz-SignedHeaders=host&x-amz-checksum-mode=ENABLED&x-id=GetObject)
![Taken from the study by Baseer et al.[3].](https://sciendo-parsed.s3.eu-central-1.amazonaws.com/65f1cb26812d8816c96acf71/j_tar-2024-0006_fig_008.jpg?X-Amz-Algorithm=AWS4-HMAC-SHA256&X-Amz-Content-Sha256=UNSIGNED-PAYLOAD&X-Amz-Credential=AKIA6AP2G7AKOUXAVR44%2F20251205%2Feu-central-1%2Fs3%2Faws4_request&X-Amz-Date=20251205T191339Z&X-Amz-Expires=3600&X-Amz-Signature=9f8e38ba903b2302b2b53804ea4aa81fe1ee9d91150a176d1863c5d47b573e40&X-Amz-SignedHeaders=host&x-amz-checksum-mode=ENABLED&x-id=GetObject)
© 2024 Vladimirs Vorohobovs, published by ŁUKASIEWICZ RESEARCH NETWORK – INSTITUTE OF AVIATION
This work is licensed under the Creative Commons Attribution-NonCommercial-NoDerivatives 4.0 License.