

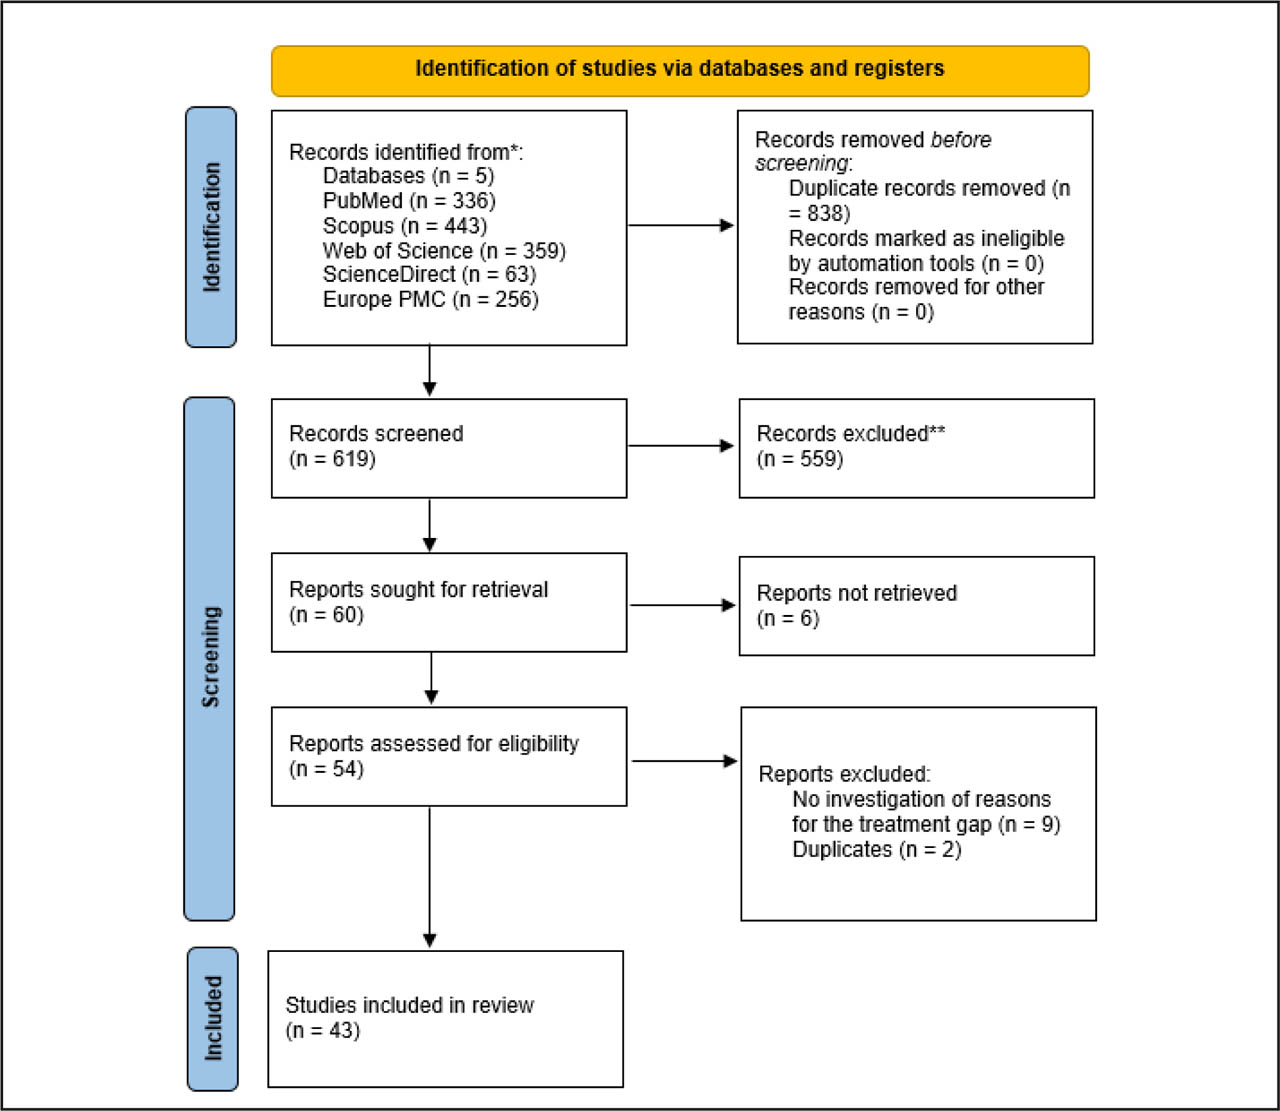
Figure 1:
PRISMA 2020 flow diagram (7) representing the selection of 43 (20,21,22,23,24,25,26,27,28,29,30,31,32,33,34,35,36,37,38,39,40,41,42,43,44,45,46,47,48,49,50,51,52,53,54,55,56,57,58,59,60,61,62) original research studies included in the systematic review.
Table 1:
Overview of patient-related (demographic and clinical), physician-related, system-level, and organisational factors associated with variations in osteoporosis treatment rate (20,21,22,23,24,25,26,27,28,29,30,31,32,33,34,35,36,37,38,39,40,41,42,43,44,45,46,47,48,49,50,51,52,53,54,55,56,57,58,59,60,61,62).
| Dimensions | Factors contributing to lower treatment rates | Factors contributing to higher treatment rates | |
|---|---|---|---|
| Patient-level factors (demographic and clinical) | Patient Demographics |
| |
| Social History |
| ||
| Family History | |||
| Fracture Type | |||
| Past Medical History and Investigations | |||
| Pharmacotherapy | |||
| Economic Factors | |||
| Patient Belief & Behaviour | |||
| Healthcare professionals and healthcare system-level factors | Physician-related factors |
| Both physician and system-related factors: |
| System/Institutional factors |
Table 2:
Country-wise summary of treatment gap estimates in included studies (20,21,22,23,24,25,26,27,28,29,30,31,32,33,34,35,36,37,38,39,40,41, 43,44,45,46,47,48, 51–52, 56, 58, 60,61,62).
| Author & Year | Country | Treatment Gap Estimate | Treatment Gap Type* | Author & Year | Country | Treatment Gap Estimate | Treatment Gap Type* |
|---|---|---|---|---|---|---|---|
| Feldstein 2005 (58) | USA | 84% (post-hip or vertebral fracture) | Post-fracture secondary prevention | Leslie 2020 (61) | Canada | 77.1% of cancer patients and 78.2% of non-cancer patients | Post-fracture secondary prevention |
| Papaioannou 2008 (43) | Canada | 90% | Post-fracture secondary prevention | McCloskey 2020 (48) | Belgium, France, Germany, Ireland, Poland, Slovakia, UK | 74.6% (varying from 53% in Ireland to 91% in Germany) | Osteoporosis/high-risk population |
| Bessette 2009 (41) | Canada | 84% | Post-fracture secondary prevention | Skjødt 2020 (30) | Denmark, Spain (Catalonia), UK | Denmark: 88–90% (2005–2014) | Post-fracture secondary prevention |
| Curtis 2009 (52) | USA | 74% even among the highest risk group (Caucasian men with prior fracture) | Osteoporosis/high-risk population | Malle 2021 (47) | Austria | 82% in women, 92% in men | Post-fracture secondary prevention |
| Leslie 2011 (40) | Canada | 93.9% in 1996/1997, 87.7% in 2001/2002, 94.1% in 2007/2008 | Post-fracture secondary prevention | Nakatoh 2021 (26) | Japan | 68.4% (hip fracture), 38.3% (vertebral fracture) | Post-fracture secondary prevention |
| Leslie 2012 (39) | Canada | 94.6% in First Nations peoples vs 87.5% in non-Indigenous | Post-fracture secondary prevention | Papaioannou 2021 (60) | Canada | 63% | Osteoporosis/high-risk population |
| Roux 2013 (37) | Canada | 81.2% in the standard care group | Post-fracture secondary prevention | Skjødt 2021 (27) | Denmark | 85% (2005), 79% (2014) | Post-fracture secondary prevention |
| Siris 2013 (38) | USA | 64.3% | Osteoporosis/high-risk population | Walsh 2021 (28) | Ireland | 79% | Osteoporosis/high-risk population |
| Cunningham 2014 (51) | USA | 38.8% | Osteoporosis/high-risk population | Hoit 2022 (24) | USA | 74% (30 days after operation) | Post-fracture secondary prevention |
| Yusuf 2016 (36) | USA | 85.1% | Post-fracture secondary prevention | Martinez-Laguna 2022 (45) | Spain | 56.8% | Post-fracture secondary prevention |
| Gani 2017 (32) | Singapore | 68.5% | Post-fracture secondary prevention | Wu 2022 (25) | Taiwan | 64.4% | Post-fracture secondary prevention |
| Keshishian 2017 (33) | USA | 72.2% | Post-fracture secondary prevention | Yavropoulou 2022 (46) | Greece | 58% | Osteoporosis/high-risk population |
| Mendis 2017 (56) | Australia | 87% | Post-fracture secondary prevention | Bliuc 2023 (20) | Australia | 78% (women), 86% (men) | Post-fracture secondary prevention |
| Sattari 2017 (34) | USA | 78.4% | Osteoporosis/high-risk population | Cheah 2023 (21) | Malaysia | 82.9% | Post-fracture secondary prevention |
| Wang 2017 (35) | Taiwan | > 60% for women, 90% for men | Osteoporosis/high-risk population | El Miedany 2023 (44) | Egypt | 82.1% | Post-fracture secondary prevention |
| Cheung 2018 (62) | Hong Kong | From 91% to 85% between 2009 and 2012 | Post-fracture secondary prevention | Fujii 2023 (22) | Japan | 60% | Post-fracture secondary prevention |
| Bougioukli 2019 (31) | Greece | 78.6% | Post-fracture secondary prevention | Mahaisavariya 2023 (23) | Thailand | 68.4% | Post-fracture secondary prevention |
| Iconaru 2020 (29) | Belgium | 74.6%–76.5% | Post-fracture secondary prevention |
* Post-fracture secondary prevention refers to treatment eligibility assessed following a fragility fracture. Osteoporosis/high-risk population refers to individuals identified through osteoporosis diagnosis, low bone mineral density, fracture-risk assessment tools (FRAX or CAROC), or population-based estimates of osteoporosis prevalence.
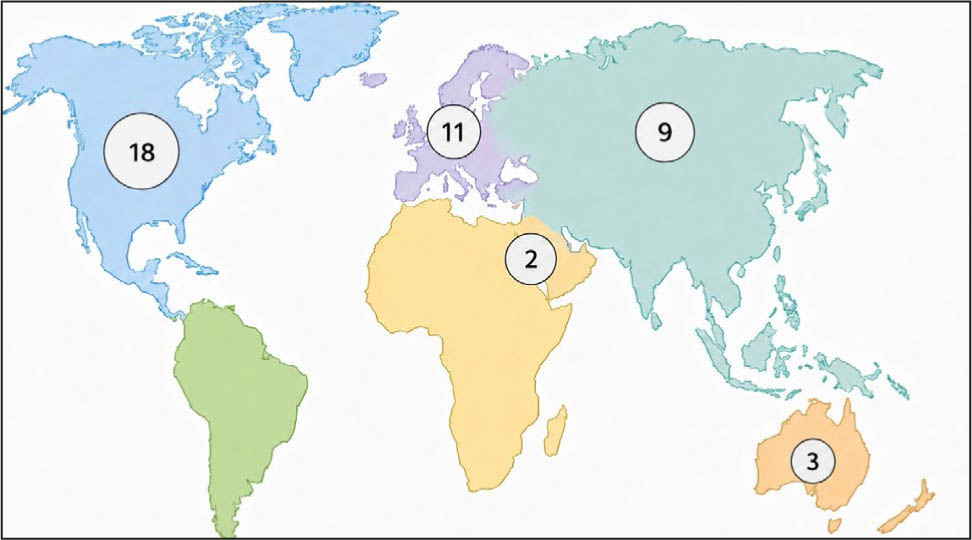
Figure 2:
Geographical distribution of included studies (20,21,22,23,24,25,26,27,28,29,30,31,32,33,34,35,36,37,38,39,40,41,42,43,44,45,46,47,48,49,50,51,52,53,54,55,56,57,58,59,60,61,62).