

1. INTRODUCTION
Osteoporosis is the most prevalent metabolic bone disease, characterised by decreased bone mass and microarchitectural deterioration of bone tissue, which increases fracture risk (1). Approximately one in three women and one in six men will experience an osteoporotic fracture during their lifetime. In the European Union, more than 23 million individuals are at high risk of such fractures (1, 2). Globally, 178 million new fractures occurred in 2019, representing a 33.4% increase since 1990 and accounting for 25.8 million years lived with disability (YLDs), a 65.3% increase over the same period (2).
Osteoporotic fractures predominantly affect older adults, particularly women, and typically result from low-energy trauma (2, 3). The most common sites include the hip, vertebrae, distal radius, and proximal humerus. These fractures are associated with chronic pain, functional decline, loss of independence, and reduced quality of life (3). Hip fractures in particular frequently require hospitalisation and are associated with complications such as thrombosis (27%), urinary tract infections (12–61%), and pneumonia (7%) (4). Osteoporosis is diagnosed based on low bone mineral density measured by DXA or the presence of a fragility fracture, particularly at the hip or vertebra. Treatment decisions are additionally informed by fracture risk assessment tools such as FRAX (1, 4).
Despite advances in fracture risk assessment, preventive strategies, and clinical guidelines, a large proportion of individuals at high risk remain untreated (1, 5). The SCOPE 21 report estimates an average treatment gap of 71% across Europe among women at high fracture risk (predominantly postmenopausal), ranging from 87% in Bulgaria to 32% in Ireland; in Slovenia, it is approximately 57% (1). The treatment gap is widest among older adults, particularly those in long-term care (5). This gap contrasts with other areas of secondary prevention, such as post–myocardial infarction care, where treatment rates have improved substantially over time (6). Reducing the osteoporosis treatment gap is essential, given its substantial contribution to fracture burden and associated healthcare costs (1).
This systematic review aims to identify and categorise the reported reasons for the osteoporosis treatment gap, intending to inform future interventions to address this issue.
2. METHODOLOGY
This review was conducted as a systematic review of observational studies addressing determinants of the osteoporosis treatment gap and is reported according to PRISMA guidelines (7). The study protocol was registered in PROSPERO (8) on the 3rd of April 2025.
2.1. Search strategy and information sources
The electronic search strategy was developed using combinations of MeSH terms and free-text keywords related to osteoporosis and treatment gaps. A representative PubMed (9) search strategy was as follows: (“Osteoporosis”[Mesh] OR osteoporosis[tiab]) AND (“treatment gap”[tiab] OR “care gap”[tiab] OR “treatment disparity”[tiab] OR “under-treatment”[tiab] OR “under-diagnosis”[tiab]). Equivalent search strategies were adapted for Scopus (10), Web of Science (11), ScienceDirect (12), and Europe PMC (13). Searches included studies published up to the 7th of April 2025. Full search strategies for all databases are available from the authors upon reasonable request. Grey literature was not systematically searched; however, reference lists of included studies were screened for additional eligible publications. A total of 1457 references were imported to the Systematic Review Accelerator (SRA) platform (14), where duplicates were removed using the Deduplicator Tool (15). Non-English studies were excluded during initial screening due to feasibility constraints.
2.2. Eligibility criteria
Studies were eligible if they met the following criteria:
Addressed the osteoporosis treatment gap;
Investigated reasons for the treatment gap;
Possibly provided an estimate of the treatment gap size.
Adult populations at risk of osteoporosis, with or without prior fragility fractures, were included. “Treatment” was defined as pharmacological therapy for osteoporosis as reported in individual studies. There is no universally accepted definition of the “treatment gap” in osteoporosis. Across studies, it variably refers either to non-treatment following a fragility fracture or to non-treatment among individuals at high fracture risk (based on FRAX, with or without DXA). We therefore did not impose a single definition, but extracted and reported study-specific definitions and interpreted findings within their respective contexts.
2.3. Screening and selection process
Two authors (K.G.R. and L.P.) independently screened titles and abstracts. Discrepancies were resolved through discussion. Full texts of potentially eligible studies were then retrieved and assessed independently for inclusion by the same reviewers. Non-original research articles and non-English publications were excluded. The selection process was recorded in sufficient detail to complete a PRISMA (7) flow diagram (Figure 1).
2.4. Data extraction
A standardised data extraction form was developed and piloted on a subset of included studies. Data were independently extracted by two reviewers (K.G.R. and L.P.) using Microsoft Office 365 Excel (16). Missing data were not sought from the study authors. Given the heterogeneity of included studies, a narrative thematic synthesis was conducted.
2.5. Risk of Bias Assessment
Risk of bias (RoB) was assessed using the Newcastle-Ottawa scale for cohort (17) and cross-sectional studies (18) and the Critical Appraisal Skills Programme (CASP) checklist for qualitative studies (19).
3. RESULTS
A total of 1,457 records were identified across five databases. After screening, 43 original research studies were included (20,21,22,23,24,25,26,27,28,29,30,31,32,33,34,35,36,37,38,39,40,41,42,43,44,45,46,47,48,49,50,51,52,53,54,55,56,57,58,59,60,61,62). The PRISMA flow diagram is presented in Figure 1 (7).
3.1. Study analysis
Of the included studies, 5 were prospective cohort studies (20, 29, 37, 41, 43), 22 were retrospective cohort studies (21,22,23,24,25,26,27,28, 30,31,32,33,34,35,36, 38,39,40, 42, 58, 61–62), 15 were cross-sectional studies (44,45,46,47,48,49,50,51,52,53,54,55,56,57, 60), and 1 was a qualitative study (59). 11 studies were conducted in European countries (27,28,29,30,31, 45,46,47,48, 50, 57), 17 in the United States and Canada (24, 33–34, 36,37,38,39,40,41,42,43, 51,52,53, 58, 60–61), 9 in Asian countries (21,22,23, 25–26, 32, 35, 49, 62), 3 in Australia (20, 56, 59), 2 in northern Africa (44, 54) and 1 study combined data from the US, Canada and India (55) (Figure 2). Most studies were conducted in secondary or tertiary care settings (21,22,23,24, 31–32, 37, 41–42, 47, 53) or in mixed healthcare settings (20, 25,26,27, 29–30, 33,34,35,36, 38,39,40, 43–44, 46, 49, 51–52, 54,55,56,57,58,59, 61–62), while five studies were performed exclusively in primary care settings (28, 45, 48, 50, 60). The majority of studies included both male and female participants (20,21,22,23,24,25,26,27,28, 30,31,32, 35,36,37, 39–40, 42, 44,45,46,47, 50,51,52, 58,59,60, 62). Seven studies focused specifically on postmenopausal women (29, 33–34, 38, 41, 48–49), one included only male patients (43), and one examined patients with cancer of both sexes (61). Several studies were survey-based and targeted healthcare professionals (53,54,55,56,57). The summary data from the 43 included studies were organised by outcomes.
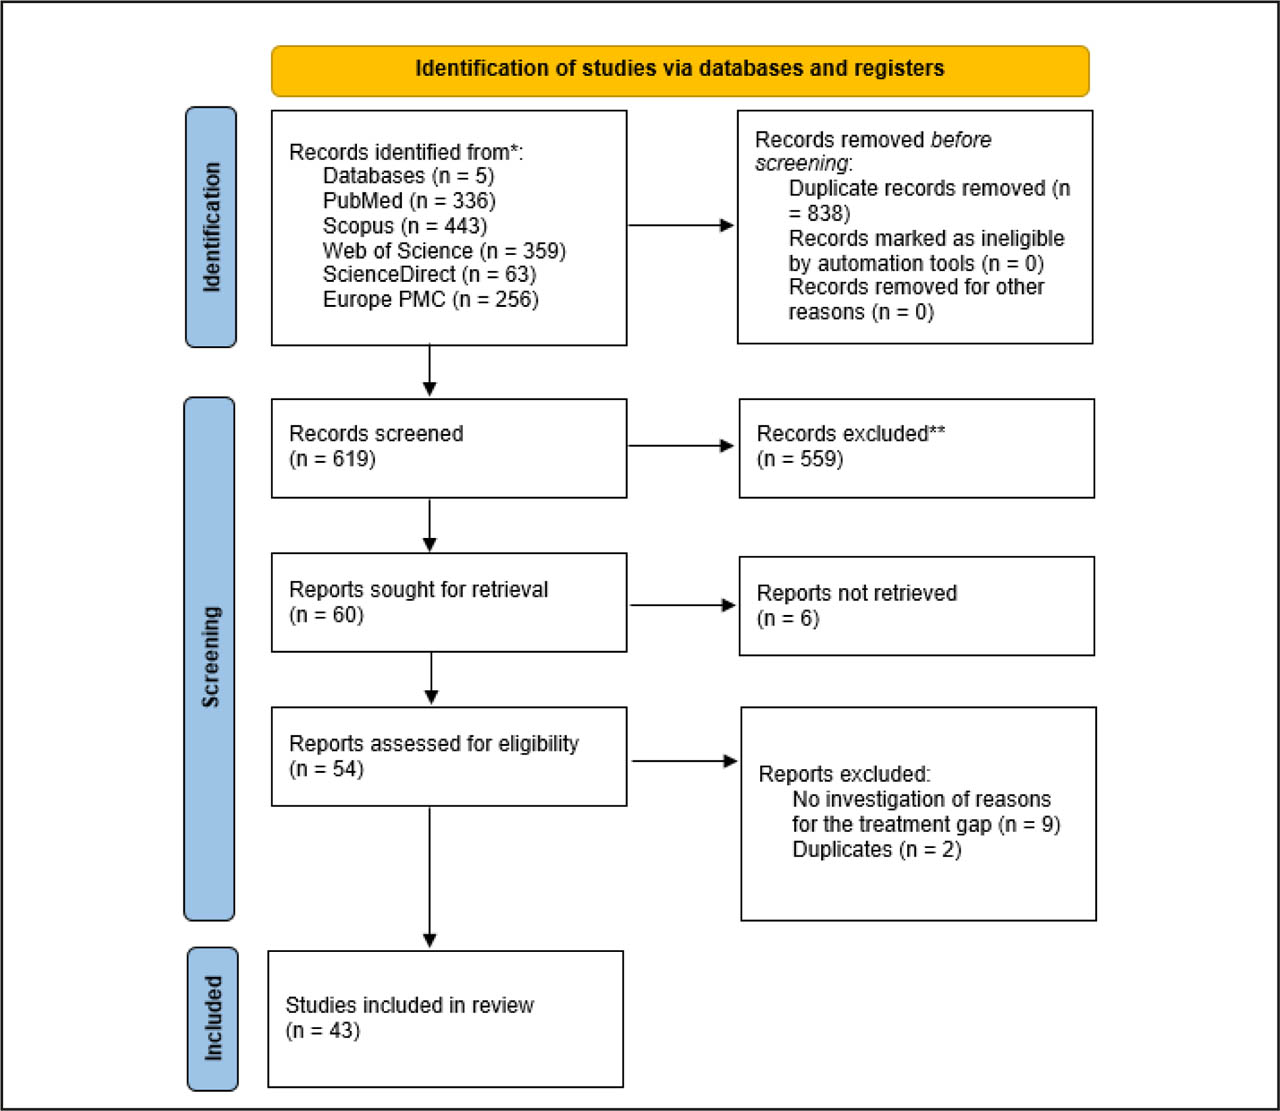
Figure 1:
PRISMA 2020 flow diagram (7) representing the selection of 43 (20,21,22,23,24,25,26,27,28,29,30,31,32,33,34,35,36,37,38,39,40,41,42,43,44,45,46,47,48,49,50,51,52,53,54,55,56,57,58,59,60,61,62) original research studies included in the systematic review.
3.2. Primary outcome
The factors contributing to the treatment gap were categorised (Table 1). Patient-level factors were defined broadly to include both demographic characteristics and clinical or disease-related factors, as these were not consistently distinguished across studies.
Table 1:
Overview of patient-related (demographic and clinical), physician-related, system-level, and organisational factors associated with variations in osteoporosis treatment rate (20,21,22,23,24,25,26,27,28,29,30,31,32,33,34,35,36,37,38,39,40,41,42,43,44,45,46,47,48,49,50,51,52,53,54,55,56,57,58,59,60,61,62).
| Dimensions | Factors contributing to lower treatment rates | Factors contributing to higher treatment rates | |
|---|---|---|---|
| Patient-level factors (demographic and clinical) | Patient Demographics |
| |
| Social History |
| ||
| Family History | |||
| Fracture Type | |||
| Past Medical History and Investigations | |||
| Pharmacotherapy | |||
| Economic Factors | |||
| Patient Belief & Behaviour | |||
| Healthcare professionals and healthcare system-level factors | Physician-related factors |
| Both physician and system-related factors: |
| System/Institutional factors |
3.3. Secondary outcome
The treatment gap estimates are presented in Table 2. Because treatment gap estimates were derived from clinically distinct populations, including post-fracture secondary prevention cohorts and broader osteoporosis/high-risk populations, direct comparison of estimates across these categories should be interpreted with caution.
Table 2:
Country-wise summary of treatment gap estimates in included studies (20,21,22,23,24,25,26,27,28,29,30,31,32,33,34,35,36,37,38,39,40,41, 43,44,45,46,47,48, 51–52, 56, 58, 60,61,62).
| Author & Year | Country | Treatment Gap Estimate | Treatment Gap Type* | Author & Year | Country | Treatment Gap Estimate | Treatment Gap Type* |
|---|---|---|---|---|---|---|---|
| Feldstein 2005 (58) | USA | 84% (post-hip or vertebral fracture) | Post-fracture secondary prevention | Leslie 2020 (61) | Canada | 77.1% of cancer patients and 78.2% of non-cancer patients | Post-fracture secondary prevention |
| Papaioannou 2008 (43) | Canada | 90% | Post-fracture secondary prevention | McCloskey 2020 (48) | Belgium, France, Germany, Ireland, Poland, Slovakia, UK | 74.6% (varying from 53% in Ireland to 91% in Germany) | Osteoporosis/high-risk population |
| Bessette 2009 (41) | Canada | 84% | Post-fracture secondary prevention | Skjødt 2020 (30) | Denmark, Spain (Catalonia), UK | Denmark: 88–90% (2005–2014) | Post-fracture secondary prevention |
| Curtis 2009 (52) | USA | 74% even among the highest risk group (Caucasian men with prior fracture) | Osteoporosis/high-risk population | Malle 2021 (47) | Austria | 82% in women, 92% in men | Post-fracture secondary prevention |
| Leslie 2011 (40) | Canada | 93.9% in 1996/1997, 87.7% in 2001/2002, 94.1% in 2007/2008 | Post-fracture secondary prevention | Nakatoh 2021 (26) | Japan | 68.4% (hip fracture), 38.3% (vertebral fracture) | Post-fracture secondary prevention |
| Leslie 2012 (39) | Canada | 94.6% in First Nations peoples vs 87.5% in non-Indigenous | Post-fracture secondary prevention | Papaioannou 2021 (60) | Canada | 63% | Osteoporosis/high-risk population |
| Roux 2013 (37) | Canada | 81.2% in the standard care group | Post-fracture secondary prevention | Skjødt 2021 (27) | Denmark | 85% (2005), 79% (2014) | Post-fracture secondary prevention |
| Siris 2013 (38) | USA | 64.3% | Osteoporosis/high-risk population | Walsh 2021 (28) | Ireland | 79% | Osteoporosis/high-risk population |
| Cunningham 2014 (51) | USA | 38.8% | Osteoporosis/high-risk population | Hoit 2022 (24) | USA | 74% (30 days after operation) | Post-fracture secondary prevention |
| Yusuf 2016 (36) | USA | 85.1% | Post-fracture secondary prevention | Martinez-Laguna 2022 (45) | Spain | 56.8% | Post-fracture secondary prevention |
| Gani 2017 (32) | Singapore | 68.5% | Post-fracture secondary prevention | Wu 2022 (25) | Taiwan | 64.4% | Post-fracture secondary prevention |
| Keshishian 2017 (33) | USA | 72.2% | Post-fracture secondary prevention | Yavropoulou 2022 (46) | Greece | 58% | Osteoporosis/high-risk population |
| Mendis 2017 (56) | Australia | 87% | Post-fracture secondary prevention | Bliuc 2023 (20) | Australia | 78% (women), 86% (men) | Post-fracture secondary prevention |
| Sattari 2017 (34) | USA | 78.4% | Osteoporosis/high-risk population | Cheah 2023 (21) | Malaysia | 82.9% | Post-fracture secondary prevention |
| Wang 2017 (35) | Taiwan | > 60% for women, 90% for men | Osteoporosis/high-risk population | El Miedany 2023 (44) | Egypt | 82.1% | Post-fracture secondary prevention |
| Cheung 2018 (62) | Hong Kong | From 91% to 85% between 2009 and 2012 | Post-fracture secondary prevention | Fujii 2023 (22) | Japan | 60% | Post-fracture secondary prevention |
| Bougioukli 2019 (31) | Greece | 78.6% | Post-fracture secondary prevention | Mahaisavariya 2023 (23) | Thailand | 68.4% | Post-fracture secondary prevention |
| Iconaru 2020 (29) | Belgium | 74.6%–76.5% | Post-fracture secondary prevention |
* Post-fracture secondary prevention refers to treatment eligibility assessed following a fragility fracture. Osteoporosis/high-risk population refers to individuals identified through osteoporosis diagnosis, low bone mineral density, fracture-risk assessment tools (FRAX or CAROC), or population-based estimates of osteoporosis prevalence.
3.4. Risk of bias assessment
For cohort studies, NOS scores (17) of 7–9 were considered “good”, 5–6 “fair”, and ≤ 4 “poor”. For cross-sectional studies, adapted NOS scores (18) of 8–10 were considered “good”, 6–7 “fair”, and < 6 “poor”. CASP checklist (19) gives a descriptive rather than a numerical grade. Overall, 32 of 43 studies were rated as “good” quality (21,22,23,24,25,26,27,28,29,30, 33, 35,36,37,38,39,40,41,42, 44,45,46,47,48,49,50,51,52, 56,57,58,59, 61), 8 as “fair” (20, 32, 34, 43, 53, 55, 60), and 4 as “poor” (31, 54, 57, 62). The use of non-validated measurement tools, the lack of sample size justification, and inadequate reporting of response rates limited the two cross-sectional studies, which were rated as poor quality (54, 57). The two cohort studies rated as poor quality (31, 62) were affected by issues including non-representative sampling, failure to ensure absence of the outcome at baseline, reliance on self-reported data, absence of a non-exposed cohort, and insufficient adjustment for confounding factors. Risk of bias assessments informed interpretation, with greater emphasis placed on higher-quality studies. Determinants from studies with a higher risk of bias were generally consistent with those from higher-quality studies; however, all findings were interpreted with caution.
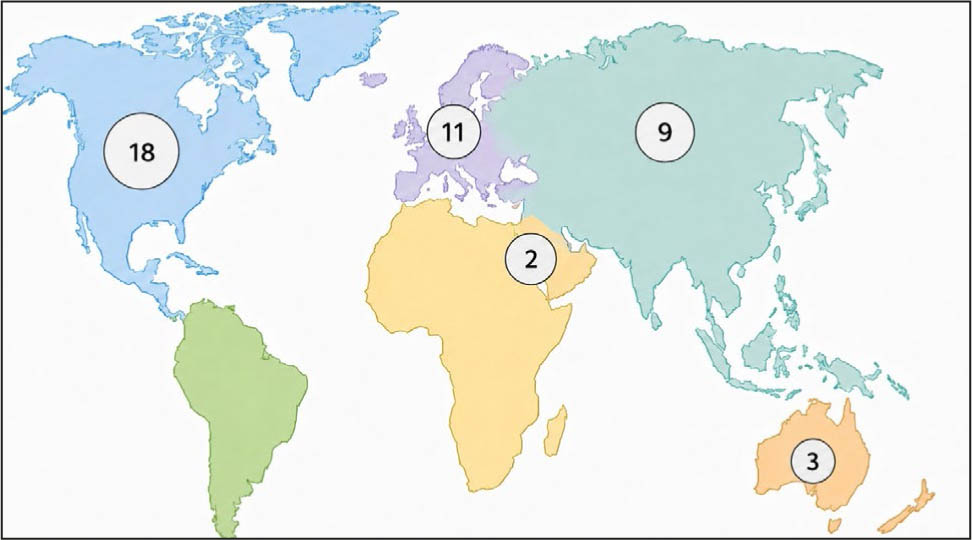
Figure 2:
Geographical distribution of included studies (20,21,22,23,24,25,26,27,28,29,30,31,32,33,34,35,36,37,38,39,40,41,42,43,44,45,46,47,48,49,50,51,52,53,54,55,56,57,58,59,60,61,62).
4. DISCUSSION
Despite growing awareness of the importance of fracture prevention (63), substantial treatment gaps in osteoporosis care persist globally. These gaps are consistently driven by patient-, physician-, and system-level factors, in line with previous reviews (64–65).
4.1. Treatment gap estimates
This systematic review found reported treatment rates ranging from 38.8% to 94.6% across studies. However, comparisons between studies are limited by substantial methodological heterogeneity. To facilitate interpretation, treatment gap estimates were classified according to whether they were derived from post-fracture secondary prevention populations or broader osteoporosis/high-risk populations. Nevertheless, direct comparisons between these categories should be interpreted with caution due to differences in study populations, eligibility criteria, and treatment gap definitions.
There is no uniform definition or approach to calculating the osteoporosis treatment gap. Some studies assessed treatment following fragility fractures as a form of secondary prevention (20,21,22,23,24,25,26,27,28,29,30,31,32, 36–37, 39,40,41, 43, 47, 56, 58, 61–62), while others included broader high-risk populations, including individuals defined by DXA criteria or FRAX-based risk (29). In several studies, the timing of fracture or treatment initiation was unclear (34–35, 38, 44,45,46, 48, 50,51,52).
Despite these differences, similar treatment gaps were observed across clinically distinct groups. For example, one study reported comparable gaps in postmenopausal women defined by T-score ≤ −2.5 and those defined by prior major osteoporotic fracture (29), suggesting that undertreatment is systemic across both diagnosed osteoporosis and high-risk populations.
Overall, variability in definitions and methodologies limits direct comparison and highlights the need for standardised approaches to defining and reporting the treatment gap.
4.2. Factors contributing to the treatment gap
The identified determinants were grouped into patient-, physician-, and system-level factors to aid interpretation; this categorisation is descriptive and does not imply causal relationships.
4.2.1. Patient-level factors (demographic and clinical)
Male sex, comorbidity burden, socio-economic disadvantage, and reduced health literacy were consistently associated with lower treatment rates. Male sex was repeatedly linked to lower treatment likelihood despite substantial fracture burden in men (22, 24,25,26, 30,31,32, 34,35,36,37, 40, 45–46, 50,51,52, 61), consistent with evidence that up to 40% of osteoporotic fractures occur in men (66). Age showed a non-linear association with treatment. Most studies reported higher treatment rates with increasing age (21, 28–29, 35, 37, 40–41, 46, 49, 50–51, 61), likely reflecting greater recognition of increased fracture risk. However, very advanced age and multimorbidity were sometimes associated with lower treatment rates (23, 26, 31, 38), suggesting competing clinical priorities and concerns regarding frailty, polypharmacy, and life expectancy. Comorbid conditions, especially dementia, diabetes, cardiovascular and chronic illnesses, were consistently associated with lower treatment rates (20, 22,21,23, 28, 31, 33–34, 38, 45, 60, 62). The same can be said for polypharmacy (26, 45, 57), with physicians often withholding treatment due to concerns over side effects, drug interactions, and life expectancy considerations.
In multiple studies (21, 33–34, 39, 50,51,52), minority and Indigenous populations were consistently less likely to receive treatment compared to white/Caucasian peers, even after a fracture. This disparity highlights structural inequities and cultural or healthcare system barriers in osteoporosis care. Racial and ethnic characteristics are inextricably linked to socio-economic status (SES). Lower SES (40, 61), lower education (23) and lower income (49) were strongly associated with osteoporosis treatment gaps. Cost concerns (49, 54, 60) were explicitly cited by patients as reasons for treatment refusal, especially among lower-income groups. A lower SES is indicative of less frequent and lower-quality care and reduce access to care (67). Additionally, health professionals' implicit bias against patients with low SES has a negative effect on clinical decision-making (68).
Additionally, limited health literacy and awareness of osteoporosis and fracture risk were pervasive across both high- and low-income countries (31, 40, 47, 49, 51). Patient perceptions, attitudes towards osteoporosis, and health behaviours were frequently cited as barriers to assessment and treatment initiation. Malle et al. (47) found that patients lacked an understanding of the indications for treatment or its potential to prevent future fractures. Patients often discontinued medications early due to side effects or a misunderstanding of benefits. Commonly reported issues included a belief that osteoporosis is not a serious condition, particularly in the absence of symptoms or fractures, leading many to decline treatment offers. Roh et al. (49) highlighted that women who believed osteoporosis was a minor health concern or inconvenient to assess were significantly less likely to undergo evaluation or treatment, even when at high risk. A study of postmenopausal women treated with monthly bisphosphonates (69) found that patients' belief in the importance of osteoporosis treatment was a key predictor of adherence.
Clinical severity influenced treatment likelihood. Vertebral and major osteoporotic fractures were more likely to trigger treatment than non-major fractures (21, 26–27, 33, 37, 58, 61). Prior diagnosis of osteoporosis, lower BMD, or prior fractures also increased the likelihood of treatment (21, 25, 29, 31, 36, 41, 43–44, 48, 58).
4.2.2. Physician and system-level factors
Healthcare professionals and system factors emerged as major contributors to the treatment gap. Physician-related barriers were frequently identified, ranging from limited familiarity with osteoporosis management guidelines to concerns about medication side effects, particularly in older or comorbid patients. Beshyah et al. (54) reported that fear of medication adverse effects, workload constraints, and discomfort with protocol-based management approaches were commonly cited reasons. Papaioannou et al. (60) found that many primary physicians intentionally deferred treatment decisions due to perceived appropriateness of current care plans, concerns about intolerance, or uncertainty about modifying specialist-initiated regimens. Interprofessional communication challenges also negatively impacted care continuity. One study (59) highlighted role ambiguity and poor information transfer between system levels, contributing to delayed or missed treatment opportunities. A lack of integrated care pathways and post-fracture assessment services further exacerbated care gaps.
System-level barriers included logistical obstacles such as long waiting times for specialist consultations, limited access to bone density testing, and regional disparities in service provision. Leslie et al. (40) demonstrated marked geographic differences in treatment rates across urban, rural, and remote populations. Furthermore, logistical difficulties, including transportation challenges in older and disabled patients (23) and the absence of community-based fracture prevention programmes (55), compound inequities in access to osteoporosis care.
The observational nature of the included studies limits the interpretation of these determinants. Reported associations do not allow clear separation of confounding from causation, particularly for variables such as age, comorbidity burden, and polypharmacy, which may reflect underlying clinical complexity or competing care priorities rather than independent effects. Furthermore, the distinction between modifiable and non-modifiable factors is not always clear-cut, as observed differences (by sex, age, socio-economic status, or other factors) may reflect broader structural or healthcare system influences. Therefore, these findings should be interpreted cautiously and primarily as indicators of patterns within osteoporosis care rather than direct targets for intervention.
4.3. Limitations and strengths
This systematic review has several limitations. First, the review was restricted to English-language publications, which may introduce language bias. This is particularly relevant in a global context, as non-English studies may capture underrepresented healthcare settings and system-level barriers. Consequently, the findings may not fully reflect the global diversity of osteoporosis care and may have limited generalisability. Second, no additional data were sought from the original study authors, which may have limited the completeness of extracted data and the risk of bias assessment. Although the risk of bias was systematically assessed, its impact on the interpretation of findings should be considered. Studies rated as having a higher risk of bias were retained to ensure a comprehensive overview, but were interpreted with caution. Most determinants identified in fair- and poor-quality studies were also reported in studies of good methodological quality, including male sex, ethnicity, comorbidity burden, prior osteoporosis diagnosis or bone mineral density testing, treatment costs, and the lack of routine fracture risk assessment. In contrast, several healthcare professional and organisational factors, including limited familiarity with osteoporosis treatment, knowledge gaps, workload concerns, perceptions regarding responsibility for osteoporosis management, referral and prescription practices, and constraints related to specialist-led treatment plans, were identified primarily in studies with a higher risk of bias (53, 57, 60, 62) and should therefore be interpreted with greater caution. Nevertheless, these factors may represent important hypotheses for future research.
The observational design of included studies, variability in study quality, heterogeneity in outcome definitions, population characteristics and follow-up time limit the strength of inference.
However, the review has notable strengths. It employed a comprehensive search strategy across five major databases, ensuring broad coverage. It includes a diverse, multinational dataset comprising 43 original research studies (20,21,22,23,24,25,26,27,28,29,30,31,32,33,34,35,36,37,38,39,40,41,42,43,44,45,46,47,48,49,50,51,52,53,54,55,56,57,58,59,60,61,62) from a wide range of healthcare systems and populations, thereby improving the findings' generalizability. The categorisation of factors into patient, physician, and system-level domains allowed for a structured analysis of the multifactorial nature of osteoporosis under-treatment. RoB was systematically assessed using validated tools (17,18,19), adding methodological rigour.
4.4. Contributions to the field
This review synthesises evidence on gaps in osteoporosis treatment across multiple healthcare systems, providing a comprehensive overview of the determinants of undertreatment. By structuring these into patient-, physician-, and system-level domains, it highlights the multifactorial nature of the problem.
It also demonstrates substantial international variability in post-fracture care, reflecting differences in healthcare organisation, clinical practice, and access to fracture prevention services. Physician-level barriers, such as uncertainty about treatment initiation and inconsistent care pathways, represent actionable targets for intervention. Finally, the review identifies key research gaps, including the optimisation of care for men, improved risk stratification, and the development of scalable post-fracture care models.
5. CONCLUSIONS
This systematic review confirms that substantial osteoporosis treatment gaps persist globally, particularly following fragility fractures. These gaps are driven by a combination of patient-, physician-, and system-level factors, including demographic disparities, comorbidity burden, socio-economic disadvantage, and healthcare system limitations.
Marked international variability in post-fracture treatment reflects differences in healthcare organisation, clinical guidelines, and access to diagnostic and treatment services. Physician-related barriers, including concerns about treatment safety, limited confidence in osteoporosis management, and fragmented care pathways, further contribute to undertreatment.
Future research should focus on optimising management for high-risk groups, such as men, improving risk-stratification tools, and developing scalable models of integrated post-fracture care to reduce global disparities in treatment.
ACKNOWLEDGEMENT
We thank the Public Health Department at the University of Ljubljana Medical Faculty for invaluable advice and guidance.
Notes
[2] Conflicts of interest CONFLICTS OF INTEREST
The authors declare that no conflicts of interest exist.
[4] ETHICAL APPROVAL
Ethical approval was not required for this study, as it is a systematic review of previously published data.
[5] DATA AVAILABILITY STATEMENT
All data and materials supporting the results of this study are presented in the main text, with any additional information available from the corresponding author upon reasonable request.
[6] AI USAGE STATEMENT
During the preparation of this manuscript, the authors used the GPT language model to check grammar and spelling, refine wording, and assist with reference formatting. The authors subsequently reviewed and edited all content and accept full responsibility for the final version of the publication.