

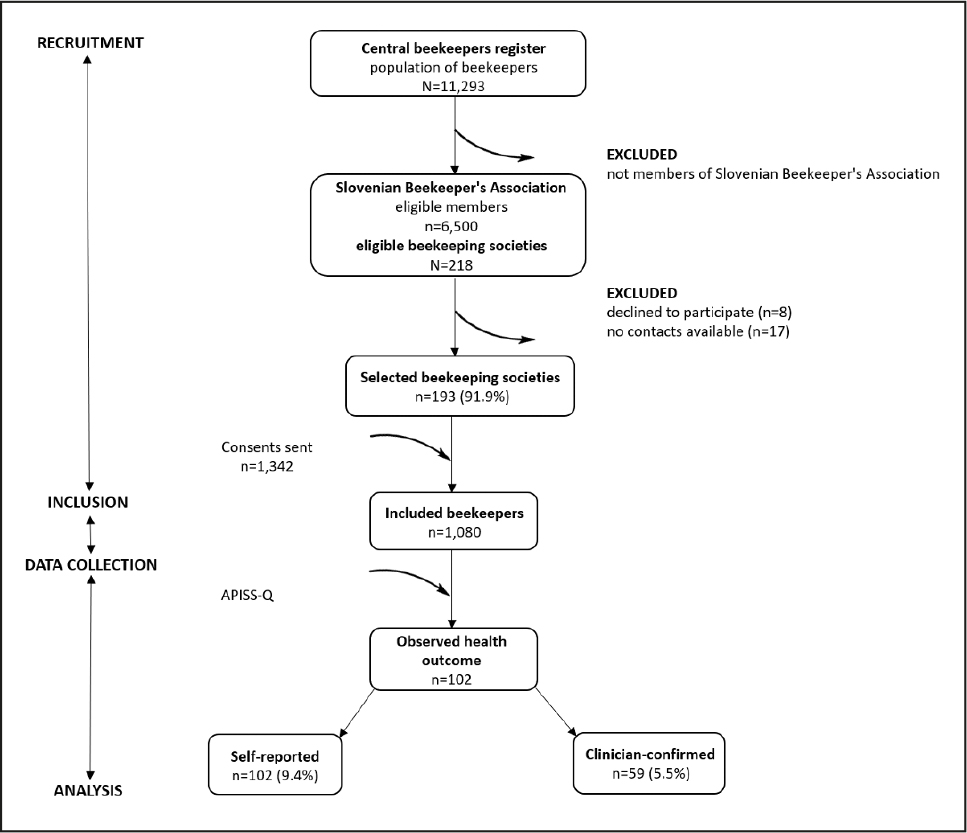
Figure 1.
Study flow diagram.
Legend: APISS-Q–Apis for “bee”, the letter “S” for “Slovenia” and the letter “Q” for ”questionnaire”.
Table 1.
The characteristics of the study population according to the categories of selected potential risk factors (N=1,080).
| Category | Variable | Total Ncat (%) |
|---|---|---|
| Demography | Age | |
| 18-39 | 123 (11.4) | |
| 40-64 | 507 (46.9) | |
| ≥65 | 450 (41.7) | |
| Sex | ||
| Female | 163 (15.1) | |
| Male | 917 (84.9) | |
| Education | ||
| Lower | 651 (60.3) | |
| Upper | 429 (39.7) | |
| BMI | ||
| 18.5-24.9 | 295 (27.3) | |
| 25-29.9 | 547 (50.7) | |
| ≥30 | 238 (22.0) | |
| Environmental exposure | Smoking status | |
| Yes | 365 (33.8) | |
| No | 715 (66.2) | |
| Beekeeping status | ||
| Hobby | 1058 (98.0) | |
| Professional | 22 (2.0) | |
| Type of beekeeping | ||
| Stationary | 894 (82.8) | |
| Other | 186 (17.2) | |
| Beekeeping duration (yr) | ||
| ≤10 | 356 (33.0) | |
| >11 | 724 (67.0) | |
| No. of active working days in a week | ||
| 1-2 | 843 (78.1) | |
| ≥3 | 237 (21.9) | |
| Use of protective equipment | ||
| Some elements | 629 (58.2) | |
| Complete outfit | 252 (23.3) | |
| None | 199 (18.5) | |
| Beekeeping among | ||
| FDRa and FMb | ||
| Bee contact | 825 (76.4) | |
| No bee contact | 255 (23.6) | |
| Host predisposition to SAR | Symptoms when working at hives | |
| Nasal | 17 (1.6) | |
| Other | 9 (0.8) | |
| None | 1054 (97.6) | |
| Personal history of LLR | ||
| Yes | 175 (16.2) | |
| No | 905 (83.8) | |
| Personal history of atopic disease | ||
| Yes | 126 (11.7) | |
| No | 954 (88.3) | |
| Personal history of other allergic diseases | ||
| Yes | 89 (8.2) | |
| No | 991 (91.8) | |
| History of AR to bee venom among FDRa | ||
| Yes | 174 (16.1) | |
| No | 906 (83.9) | |
| History of atopic disease among FDRa | ||
| Yes | 91 (8.4) | |
| No | 989 (91.6) | |
| History of other allergic diseases among FDRa | ||
| Yes | 32 (3.0) | |
| No | 1048 (97.0) |
Table 2.
The estimated lifetime prevalence of self-reported first systemic allergic reaction to bee venom in 1,080 beekeepers and graded for severity according to Mueller.
| Grade | Ncat (%) | 95% CI |
|---|---|---|
| SAR I | 27 (26.5) | 24.5-28.5 |
| SAR II | 29 (28.4) | 28.4-28.4 |
| SAR III | 26 (25.5) | 23.5-27.5 |
| SAR IV | 20 (19.6) | 17.4-21.4 |
| TOTAL | 102 (100.0) |
Table 3.
Multiple logistic regression analysis of the overall lifetime prevalence of self-reported first systemic allergic reaction to bee venom associated with risk factors among the Slovenian population of beekeepers (N=1,080).
| Risk factor | Variable | OR | 95% CI | p-value | |
|---|---|---|---|---|---|
| lower | upper | ||||
| Estimated number of bee stings per season | >51 | 1 | |||
| ≤50 | 5.274 | 3.250 | 8.559 | <0.001 | |
| Demography | Agea | ||||
| ≥65 | 1 | ||||
| 18-39 | 1.477 | 1.160 | 1.881 | <0.002 | |
| 40-64 | 1.270 | 1.055 | 1.527 | <0.011 | |
| Sexa | |||||
| Female | 1 | ||||
| Male | 1.712 | 1.007 | 2.911 | 0.047 | |
| Environmental exposure | Beekeeping duration (yr) | ||||
| >11 | 1 | ||||
| ≤10 | 1.235 | 0.759 | 2.010 | 0.395 | |
| Host predisposition to SAR | Symptoms when working at hives | ||||
| None | 1 | ||||
| Nasal | 9.693 | 2.469 | 38.045 | 0.001 | |
| Personal history of LLR | |||||
| No | 1 | ||||
| Yes | 20.654 | 4.747 | 89.877 | <0.001 | |
| Personal history of atopic disease | |||||
| No | 1 | ||||
| Physician-confirmed asthma | 1.288 | 0.707 | 2.346 | 0.408 | |
| Personal history of other allergic diseases | |||||
| No | 1 | ||||
| Yes | 1.664 | 0.841 | 3.291 | 0.143 | |