
Table 1.
Characteristics of the RCT study
| Time peroid 2018–2023 | Vejle | Aabenraa | Odense |
|---|---|---|---|
| Number of randomized families | 49 | 32 | 12 |
| Number of COS-P interventions programs | 11 | 7 | 2 |
| Number of participating parnets | 33 | 21 | 7 |
Table 2.
Participant characteristics (parents)
| Parent pseudonym | Age | Gender | Number of children | Referred child gender | Child age | Referred child diagnosis | Months since COS-P | Completed COS-P with partner |
|---|---|---|---|---|---|---|---|---|
| Ann | 43 | F | 4 | M | 5 | + | < 12 | + |
| Ben | 42 | M | 2 | M | 7 | − | > 1 | ÷ |
| Charlotte | 33 | F | 2 | M | 8 | + | > 1 | + |
| David | 36 | M | 2 | F | 8 | + | > 1 | + |
| Emma | 39 | F | 3 | F | 5 | − | < 12 | ÷ |
| Frederik | 37 | M | 2 | M | 4 | + | > 1 | ÷ |
[i] Note. Table 2 presents participant characteristics (parents), including gender, age, number of children, and characteristics of the referred child (gender, age, and diagnosis). Diagnosis is coded as present (+) or absent (−) and refferes to if the child has received a diagnosis (yet). Time since participation in COS-P is reported in months, and partner participation is indicated (+ = yes, ÷ = no). COS-P: Circle of Security–Parenting.
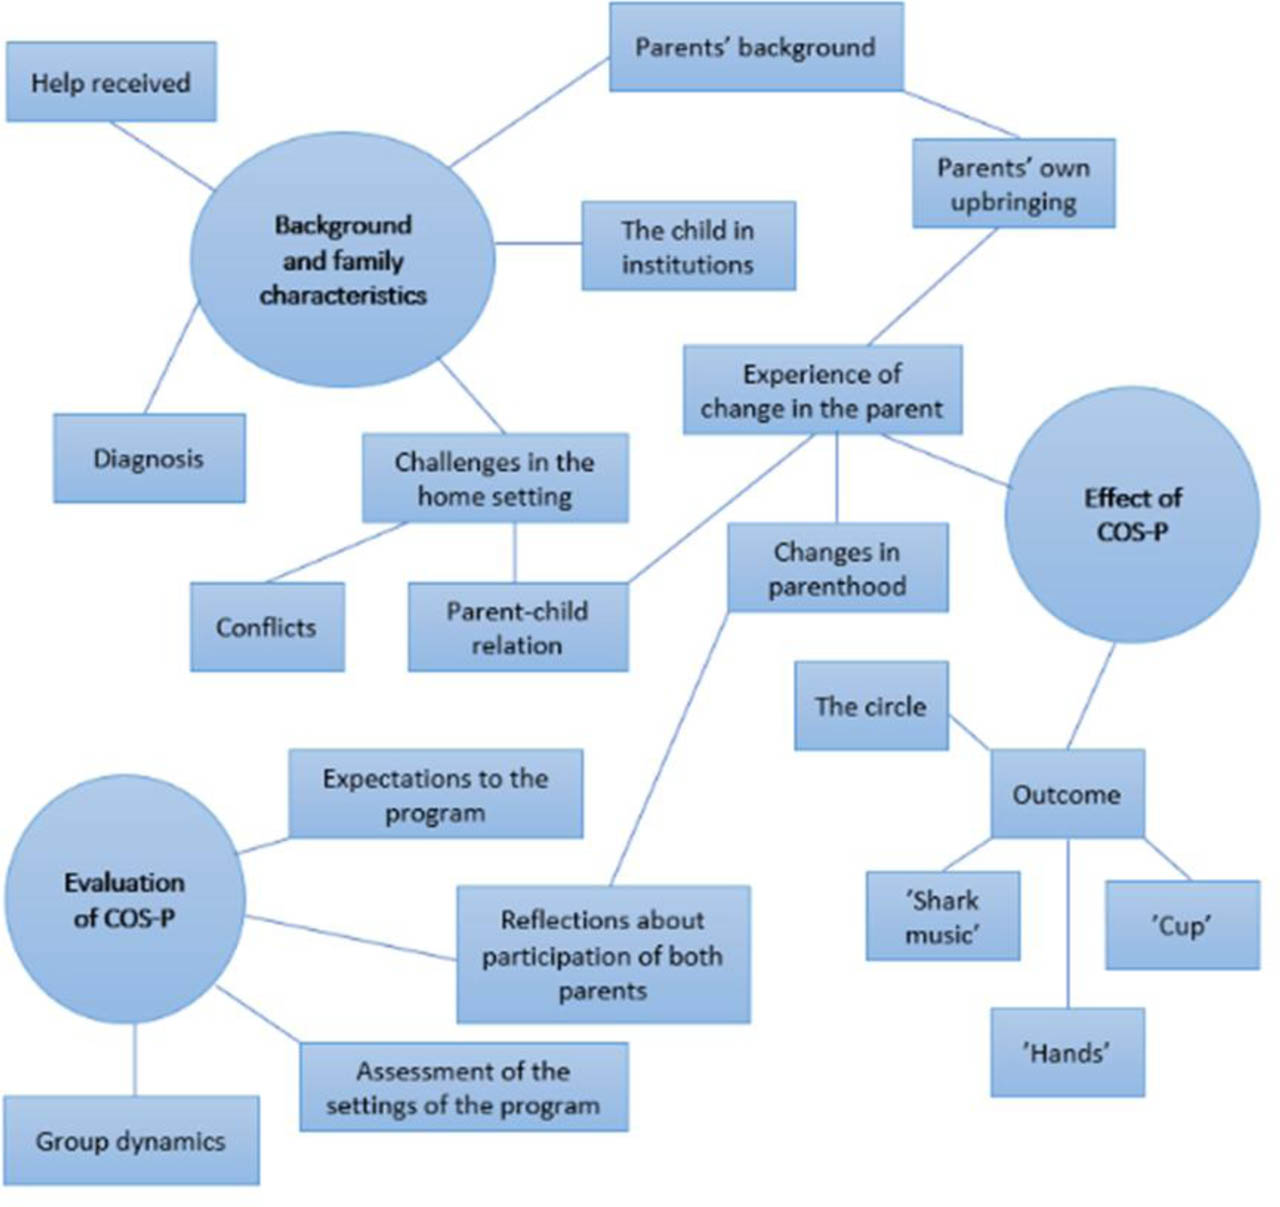
Figure 1.
Thematic map of the coding process