
TABLE 1.
Characteristics and presence of SCID-based diagnoses by gender.
| Variable | Males | Females | Total |
|---|---|---|---|
| Participants | 202 | 550 | 752 |
| Age, mean | 16.74 | 16.47 | 16.55 |
| Age, SD | 1.67 | 1.62 | 1.64 |
| Major depressive disorder | 84 (42%) | 294 (53%) | 378 (50%) |
| Dysthymia | 24 (12%) | 87 (16%) | 111(15%) |
| Other depressive disorder | 7 (3.5%) | 29 (5%) | 36 (5%) |
| Exclusion diagnosis | 6 (3%) | 61 (11%) | 67 (9%) |
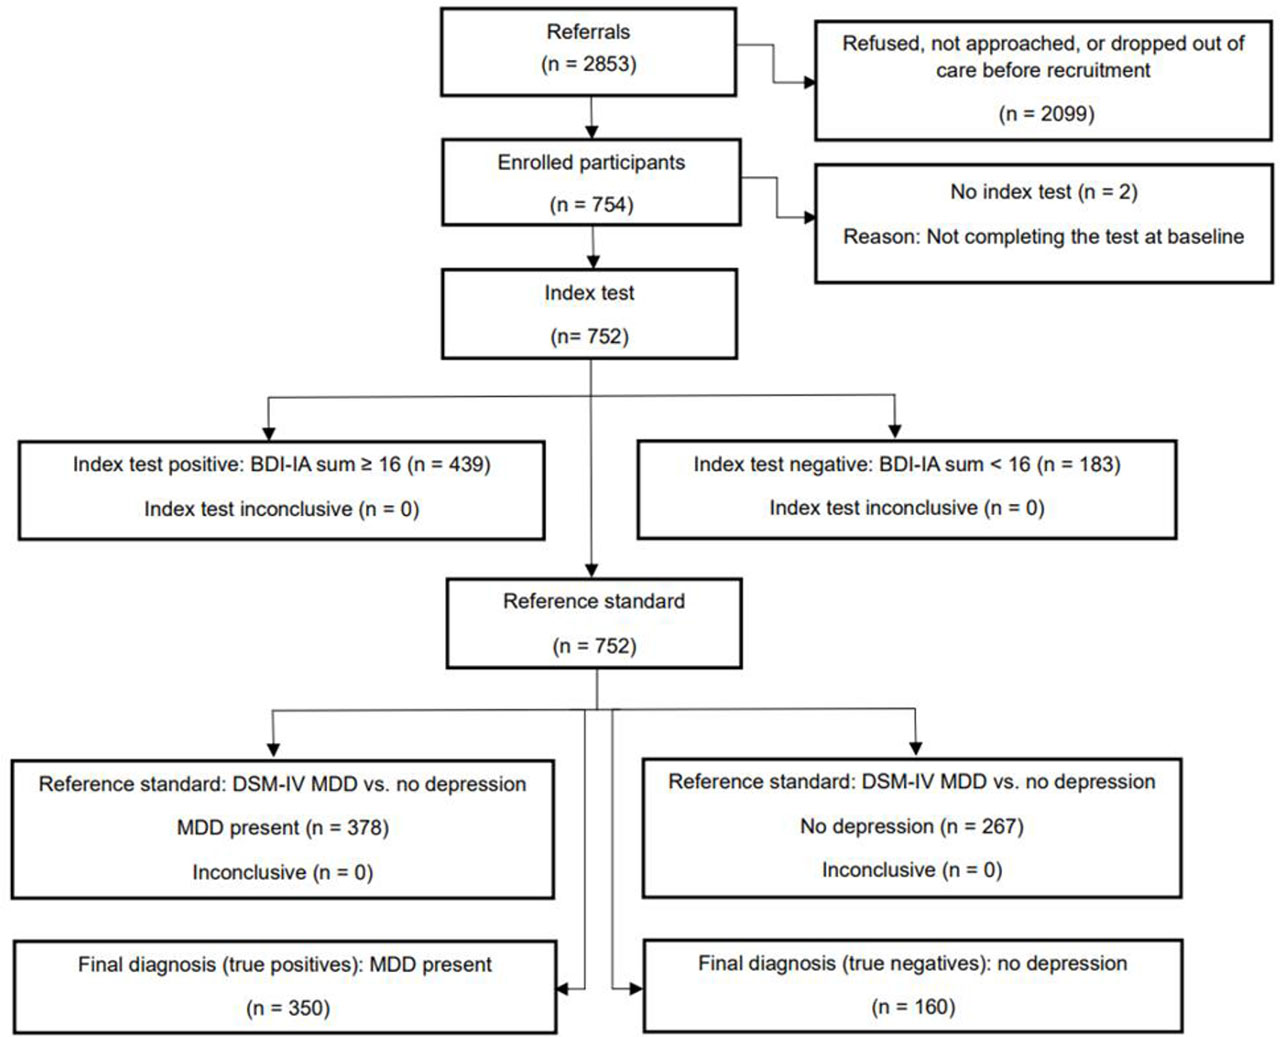
FIGURE 1.
Flow diagram of participants based on the primary diagnostic categorization (MDD vs. no depression). Note: MDD vs. no depression diagnosis refers to the main comparison categorization used in the analysis. For more details, see Methods section: Research Diagnoses.
TABLE 2.
BDI sum score distributions by version and diagnostic category.
| Condition* | Version | Diagnosis + | Diagnosis − | Brunner–Munzel test | Stochastic Superiority | ||||||
|---|---|---|---|---|---|---|---|---|---|---|---|
| n | M | SD | n | M | SD | Statistic | p | Estimate | CI | ||
| MDD vs. no depr. | BDI-1A | 351 | 30.22 | 9.64 | 239 | 12.13 | 9.49 | 31.7 | < 0.001 | 0.902 | [0.88, 0.93] |
| MDD vs. no depr. | BDI-SF | 359 | 20.24 | 6.60 | 243 | 7.75 | 6.56 | 32.3 | < 0.001 | 0.902 | [0.88, 0.93] |
| MDD vs. no depr. | BDI-PC | 361 | 11.58 | 3.91 | 245 | 4.54 | 3.91 | 29.5 | < 0.001 | 0.892 | [0.87, 0.92] |
| MDD vs. no depr. | BDI-6 | 368 | 10.02 | 3.04 | 246 | 4.00 | 3.29 | 32.7 | < 0.001 | 0.899 | [0.88, 0.92] |
| Depr. vs. none | BDI-1A | 389 | 29.13 | 10.04 | 239 | 12.13 | 9.49 | 28.3 | < 0.001 | 0.884 | [0.86, 0.91] |
| Depr. vs. none | BDI-SF | 397 | 19.53 | 6.87 | 243 | 7.75 | 6.56 | 28.7 | < 0.001 | 0.885 | [0.86, 0.91] |
| Depr. vs. none | BDI-PC | 399 | 11.20 | 4.03 | 245 | 4.54 | 3.91 | 26.8 | < 0.001 | 0.876 | [0.85, 0.90] |
| Depr. vs. none | BDI-6 | 406 | 9.74 | 3.12 | 246 | 4.00 | 3.29 | 29.8 | < 0.001 | 0.886 | [0.86, 0.91] |
| MDD vs. no MDD | BDI-1A | 351 | 30.22 | 9.64 | 275 | 13.04 | 9.55 | 30.7 | < 0.001 | 0.892 | [0.87, 0.92] |
| MDD vs. no MDD | BDI-SF | 359 | 20.24 | 6.60 | 279 | 8.42 | 6.63 | 30.9 | < 0.001 | 0.891 | [0.87, 0.92] |
| MDD vs. no MDD | BDI-PC | 361 | 11.58 | 3.91 | 281 | 4.95 | 3.96 | 28.1 | < 0.001 | 0.880 | [0.85, 0.91] |
| MDD vs. no MDD | BDI-6 | 368 | 10.02 | 3.04 | 282 | 4.40 | 3.35 | 30.2 | < 0.001 | 0.883 | [0.86, 0.91] |
[i] MDD = Major Depressive Disorder; BDI-IA= Beck Depression Inventory (revised version); BDI-SF = Beck Depression Inventory – Short Form; BDI-PC = Beck Depression Inventory for Primary Care; BDI-6 = Beck Depression Inventory-6; MDD = Major Depressive Disorder; Depr = Depression; M = Mean; SD = Standard deviation; P = P-value; CI = Confidence interval.
[ii] Note: Missingness of BDI responses was minimal, with only 85 responses of the 752 respondents missing (0.5%).
[iv] For more details, see Methods section 2.2.1: Research Diagnoses.
TABLE 3.
Version membership and standardized one-factor model parameters of BDI-IA items
| Item | Content | Item included in version | Factor loading | Item thresholds | ||||
|---|---|---|---|---|---|---|---|---|
| BDI-SF | BDI-PC | BDI-6 | 1 | 2 | 3 | |||
| 1 | Mood | ✓ | ✓ | ✓ | 0.80 | −0.51 | 0.64 | 1.52 |
| 2 | Pessimism | ✓ | ✓ | – | 0.75 | −0.83 | 0.25 | 1.12 |
| 3 | Sense of failure | ✓ | ✓ | – | 0.84 | −0.74 | 0.45 | 1.11 |
| 4 | Lack of satisfaction | ✓ | ✓ | – | 0.83 | −0.55 | 0.44 | 1.46 |
| 5 | Guilty feeling | ✓ | – | ✓ | 0.88 | −0.46 | 0.28 | 1.00 |
| 6 | Sense of punishment | – | – | – | 0.65 | 0.07 | 0.74 | 1.27 |
| 7 | Negative self-view | ✓ | ✓ | – | 0.84 | −0.69 | 0.32 | 0.96 |
| 8 | Self-accusations | – | ✓ | – | 0.81 | −0.90 | −0.21 | 0.31 |
| 9 | Self-destructiveness | ✓ | ✓ | – | 0.70 | −0.68 | 1.12 | 2.11 |
| 10 | Crying | – | – | – | 0.71 | −0.48 | 0.26 | 0.69 |
| 11 | Irritability | – | – | ✓ | 0.66 | −0.92 | 0.32 | 1.31 |
| 12 | Social withdrawal | ✓ | – | – | 0.74 | −0.36 | 0.64 | 1.82 |
| 13 | Indecisiveness | ✓ | – | ✓ | 0.75 | −0.68 | 0.05 | 1.60 |
| 14 | Negative body image | ✓ | – | – | 0.73 | −0.13 | 0.36 | 0.63 |
| 15 | Work inhibition | ✓ | – | ✓ | 0.71 | −0.91 | −0.03 | 1.49 |
| 16 | Sleep disturbance | – | – | – | 0.56 | −0.67 | 0.81 | 1.34 |
| 17 | Fatigability | ✓ | – | ✓ | 0.78 | −0.78 | 0.08 | 1.26 |
| 18 | Loss of appetite | ✓ | – | – | 0.58 | −0.05 | 0.73 | 1.54 |
| 19 | Weight loss | – | – | – | 0.24 | 0.68 | 1.19 | 1.73 |
| 20 | Somatic preoccupation | – | – | – | 0.42 | 0.25 | 1.48 | 1.93 |
| 21 | Loss of libido | – | – | – | 0.58 | 0.20 | 0.93 | 1.62 |
TABLE 4.
Diagnostic test results, MDD vs. no depressive disorder, mean score cut-off equivalent to BDI-1A sum ≥ 16.
| Version | Items | Mean cut-off | AP | Confusion matrix | Basic ratios | κ | Diagnostic odds ratio | Number needed to diagnose | Global test | Individual test adjusted p-values | ||||||||||
|---|---|---|---|---|---|---|---|---|---|---|---|---|---|---|---|---|---|---|---|---|
| TP | FP | FN | TN | Sens. | Spec. | PPV | NPV | DOR | 95% Cl | NND | 95% Cl | Stat. | Adj. p | Sens. | Spec. | |||||
| BDI-1A | 21 | 0.76 | 71% | 350 | 89 | 23 | 160 | 0.938 | 0.643 | 0.797 | 0.874 | 0.608 | 27.36 | [16.67, 44.89] | 1.72 | [1.51, 2.05] | – | – | – | – |
| BDI-SF | 13 | 0.82 | 69% | 348 | 84 | 25 | 165 | 0.933 | 0.663 | 0.806 | 0.868 | 0.620 | 27.34 | [16.86, 44.34] | 1.68 | [1.48, 1.99] | 2.22 | 0.329 | – | – |
| BDI-PC | 7 | 0.86 | 72% | 354 | 95 | 19 | 154 | 0.949 | 0.618 | 0.788 | 0.890 | 0.598 | 30.20 | [17.82, 51.19] | 1.76 | [1.54, 2.10] | 3.12 | 0.211 | – | – |
| BDI-6 | 6 | 1.00 | 69% | 349 | 81 | 24 | 168 | 0.936 | 0.675 | 0.812 | 0.875 | 0.634 | 30.16 | [18.45, 49.29] | 1.64 | [1.45, 1.93] | 2.36 | 0.307 | – | – |
[i] Mean cut-off = smallest mean score yielding a positive test; AP = apparent prevalence; TP = true positives; FP = false positives; FN = false negatives; TN = true negatives; Sens. = sensitivity; Spec. = specificity; PPV/NPV = positive/negative predictive value; κ = Cohen's kappa; Global test = joint comparison of sensitivity and specificity against the BDI-1A in this condition; Stat. = test statistic; Adj. p = adjusted p-value
TABLE 5.
Diagnostic test results, MDD vs. no depressive disorder, factor score cut-off equivalent to BDI-1A sum ≥ 16.
| Version | Items | Factor score cut-off | AP | Confusion matrix | Basic ratios | κ | Diagnostic odds ratio | Number needed to diagnose | Global test | Individual test adjusted p-values | ||||||||||
|---|---|---|---|---|---|---|---|---|---|---|---|---|---|---|---|---|---|---|---|---|
| TP | FP | FN | TN | Sens. | Spec. | PPV | NPV | DOR | 95% Cl | NND | 95% Cl | Stat. | Adj. p | Sens. | Spec. | |||||
| BDI-1A | 21 | −0.35 | 70% | 350 | 85 | 23 | 164 | 0.938 | 0.659 | 0.805 | 0.877 | 0.623 | 29.36 | [17.87, 48.24] | 1.68 | [1.48, 1.98] | 2.70 | 0.250 | – | – |
| BDI-SF | 13 | −0.33 | 70% | 350 | 85 | 23 | 164 | 0.938 | 0.659 | 0.805 | 0.877 | 0.623 | 29.36 | [17.87, 48.24] | 1.68 | [1.48, 1.98] | 1.34 | 0.512 | – | – |
| BDI-PC | 7 | −0.32 | 71% | 350 | 90 | 23 | 159 | 0.938 | 0.639 | 0.795 | 0.874 | 0.604 | 26.88 | [16.39, 44.09] | 1.73 | [1.52, 2.06] | 0.04 | 0.980 | – | – |
| BDI-6 | 6 | −0.35 | 70% | 350 | 86 | 23 | 163 | 0.938 | 0.655 | 0.803 | 0.876 | 0.619 | 28.84 | [17.56, 47.37] | 1.69 | [1.48, 2.00] | 0.36 | 0.835 | – | – |
[i] Mean cut-off = smallest mean score yielding a positive test; AP = apparent prevalence; TP = true positives; FP = false positives; FN = false negatives; TN = true negatives; Sens. = sensitivity; Spec. = specificity; PPV/NPV = positive/negative predictive value; κ = Cohen's kappa; Global test = joint comparison of sensitivity and specificity against the BDI-1A in this condition; Stat. = test statistic; Adj. p = adjusted p-value
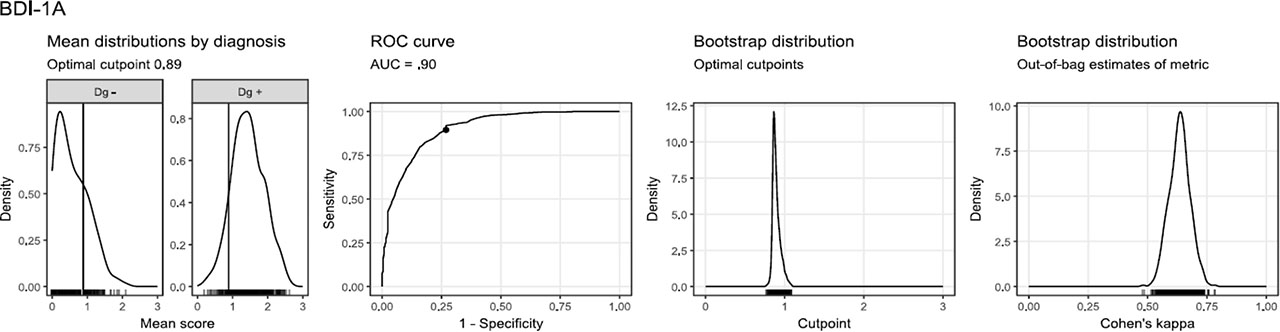
FIGURE 2a.
Sample-optimal cut-offs for the main diagnostic condition, MDD vs. no depression diagnosis, criterion Cohen's kappa, all participants together.
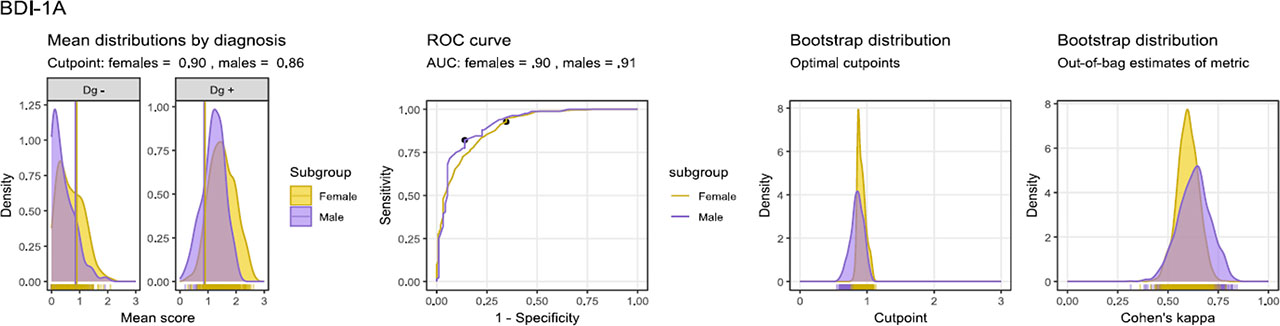
FIGURE 2b.
Sample-optimal cut-offs for the main diagnostic condition, MDD vs. no depression diagnosis, criterion Cohen's kappa, by gender.
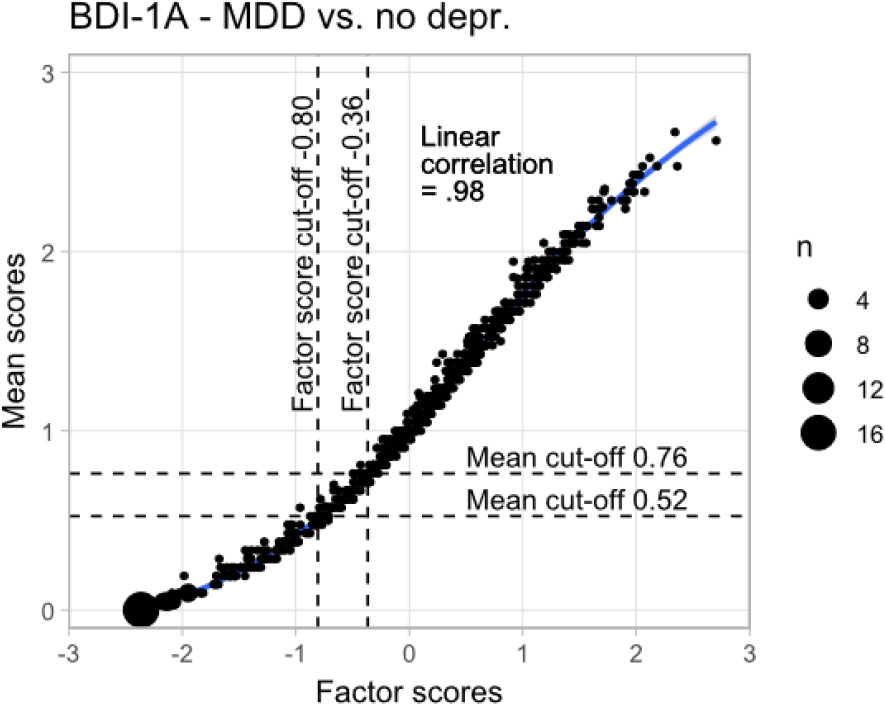
Figure 3.
BDI mean scores versus factor scores with fit lines. Note: The higher and lower horizontal cut-off lines correspond to BDI-IA sums 16 and 11, respectively, and the factor score cut-offs to the matched sensitivities.
TABLE 6.
Optimal cut-off results.
| BDI version | Optimization criterion | Subgroup | Optimal cut-off | κ | Sensitivity | Specificity | AUC | DOR | NND |
|---|---|---|---|---|---|---|---|---|---|
| BDI-1A | Cohen's kappa | - | 0.89 | 0.638 | 0.895 | 0.731 | 0.902 | – | 1.60 |
| BDI-SF | Cohen's kappa | - | 1.01 | 0.619 | 0.845 | 0.775 | 0.903 | – | 1.61 |
| BDI-PC | Cohen's kappa | - | 1.10 | 0.634 | 0.861 | 0.771 | 0.893 | – | 1.58 |
| BDI-6 | Cohen's kappa | - | 1.04 | 0.615 | 0.866 | 0.743 | 0.900 | – | 1.64 |
| BDI-1A | Cohen's kappa | Male | 0.86 | 0.682 | 0.821 | 0.860 | 0.910 | – | 1.47 |
| BDI-1A | Cohen's kappa | Female | 0.90 | 0.611 | 0.927 | 0.654 | 0.896 | – | 1.72 |
| BDI-SF | Cohen's kappa | Male | 0.79 | 0.629 | 0.869 | 0.763 | 0.912 | – | 1.58 |
| BDI-SF | Cohen's kappa | Female | 1.07 | 0.597 | 0.886 | 0.699 | 0.896 | – | 1.71 |
| BDI-PC | Cohen's kappa | Male | 1.01 | 0.646 | 0.738 | 0.903 | 0.893 | – | 1.56 |
| BDI-PC | Cohen's kappa | Female | 1.12 | 0.605 | 0.896 | 0.692 | 0.890 | – | 1.70 |
| BDI-6 | Cohen's kappa | Male | 0.95 | 0.650 | 0.857 | 0.796 | 0.895 | – | 1.53 |
| BDI-6 | Cohen's kappa | Female | 1.14 | 0.623 | 0.910 | 0.692 | 0.899 | – | 1.66 |
| BDI-1A | Misclassification cost 1:1 | - | 0.86 | 0.638 | 0.895 | 0.731 | 0.902 | – | 1.60 |
| BDI-SF | Misclassification cost 1:1 | - | 0.89 | 0.606 | 0.893 | 0.699 | 0.903 | – | 1.69 |
| BDI-PC | Misclassification cost 1:1 | - | 1.05 | 0.634 | 0.861 | 0.771 | 0.893 | – | 1.58 |
| BDI-6 | Misclassification cost 1:1 | - | 1.02 | 0.615 | 0.866 | 0.743 | 0.900 | – | 1.64 |
| BDI-1A | Misclassification cost 1:3 | - | 0.62 | 0.599 | 0.962 | 0.602 | 0.902 | – | 1.77 |
| BDI-SF | Misclassification cost 1:3 | - | 0.68 | 0.611 | 0.979 | 0.594 | 0.903 | – | 1.75 |
| BDI-PC | Misclassification cost 1:3 | - | 0.72 | 0.594 | 0.949 | 0.614 | 0.893 | – | 1.77 |
| BDI-6 | Misclassification cost 1:3 | - | 0.74 | 0.565 | 0.957 | 0.574 | 0.900 | – | 1.88 |