
TABLE 1.
Study characteristics
| Community-based | Healthy controls | |
|---|---|---|
| Number of studies – n | 20 | 14 |
| Total number of participants – n | 6,960 | 766 |
| Age – mean (SD)1 | 15.25 (1.7) | 14.77 (1.8) |
| Sex – n (%) | ||
| Female | 4221 (60.6) | 381 (49.7) |
| Male | 2732 (39.3) | 385 (50.3) |
| Other | 7 (0.1) | 0 (0) |
| Main nationality – n | Australia (1) | Denmark (1) |
| China (2) | Norway (1) | |
| Hungary (1) | Turkey (12) | |
| India (1) | ||
| Iran (1) | ||
| Italy (4) | ||
| Portugal (1) | ||
| Spain (1) | ||
| Sweden (1) | ||
| Turkey (1) | ||
| UK (2) | ||
| USA (4) | ||
| DERS-T score – weighted mean (SD) | 84.4 (23.4) | 76.5 (20.0) |
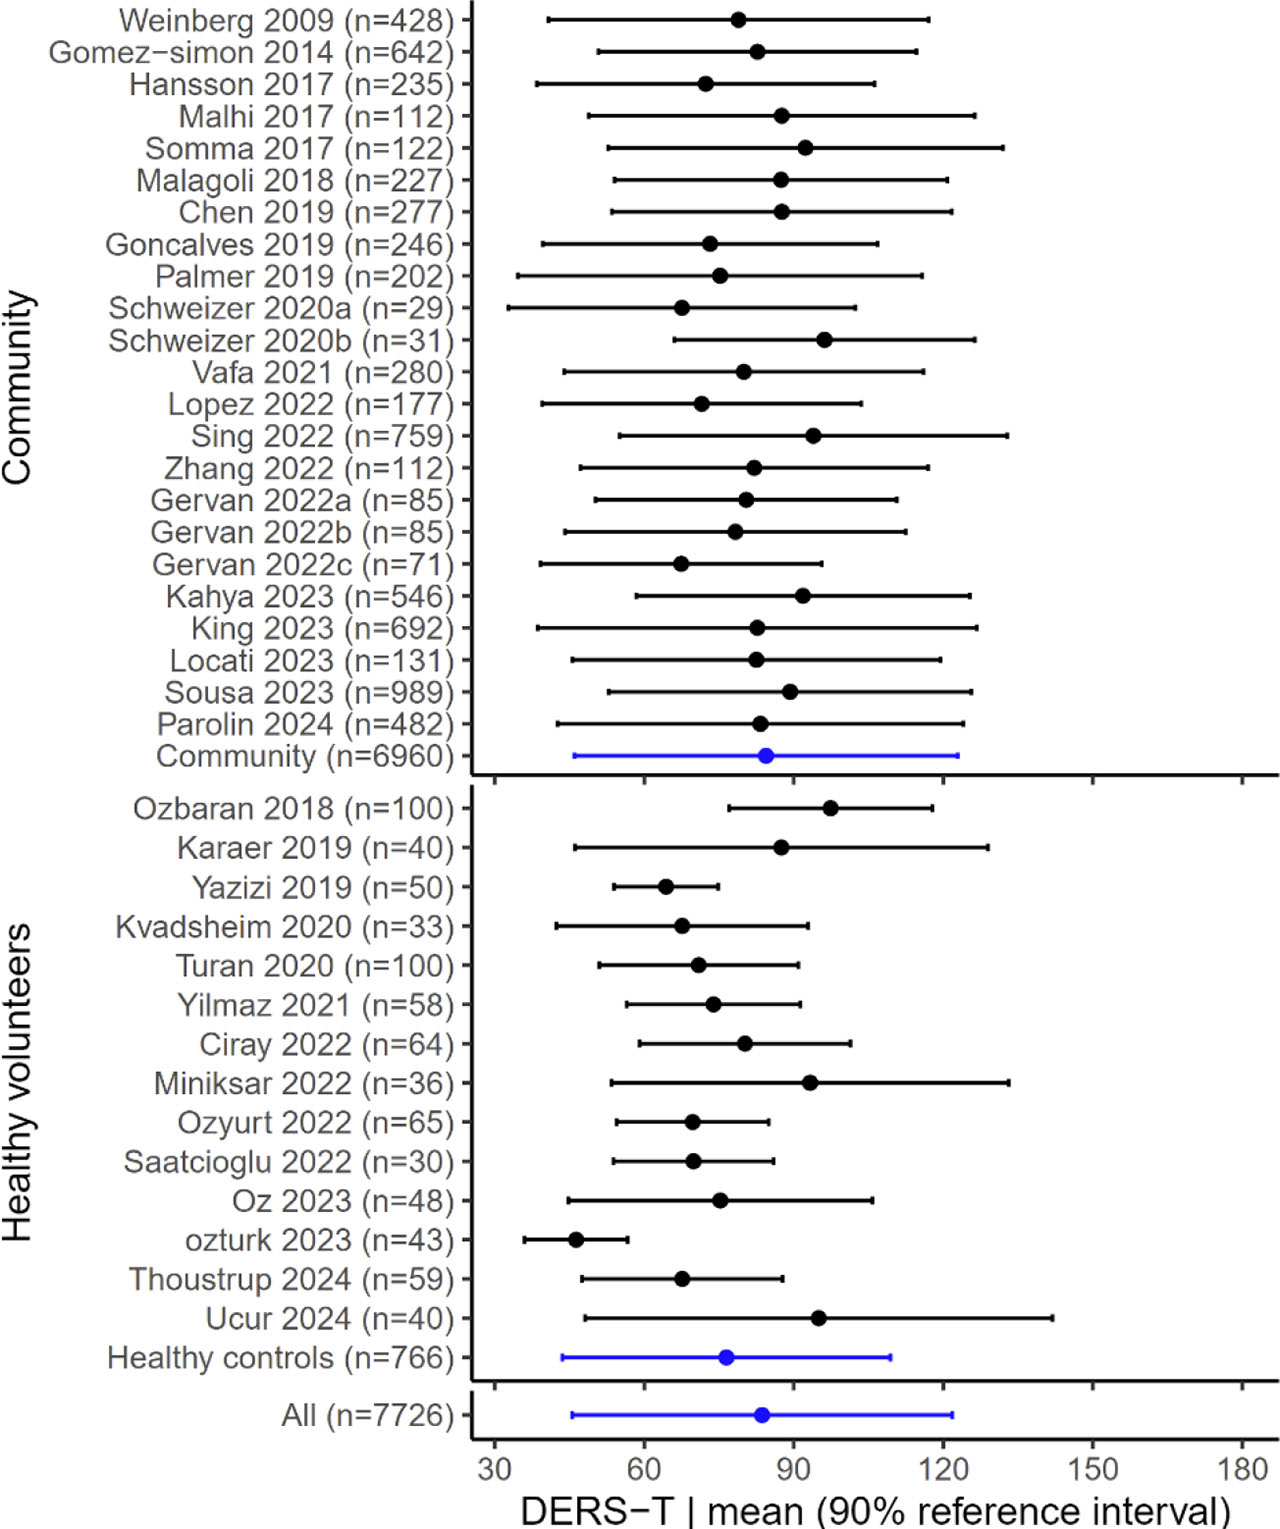
FIGURE 1.
Reference interval for DERS-T in youths from community-based populations and healthy volunteers.
The range for the DERS-T is 36 to 180. The reference interval for Community stems from studies using background population data including youths experiencing heightened levels of psychopathology. The reference interval for healthy volunteers stem from studies including youths as symptom-free and psychiatrically healthy. The black reference intervals represent the dispersion of DERS-T from individual studies. The blue reference intervals represent the combined dispersion from three groups respectively: Community-based population (46.0–122.9), healthy volunteers (43.6–109.4), and all (45.5–121.8).