
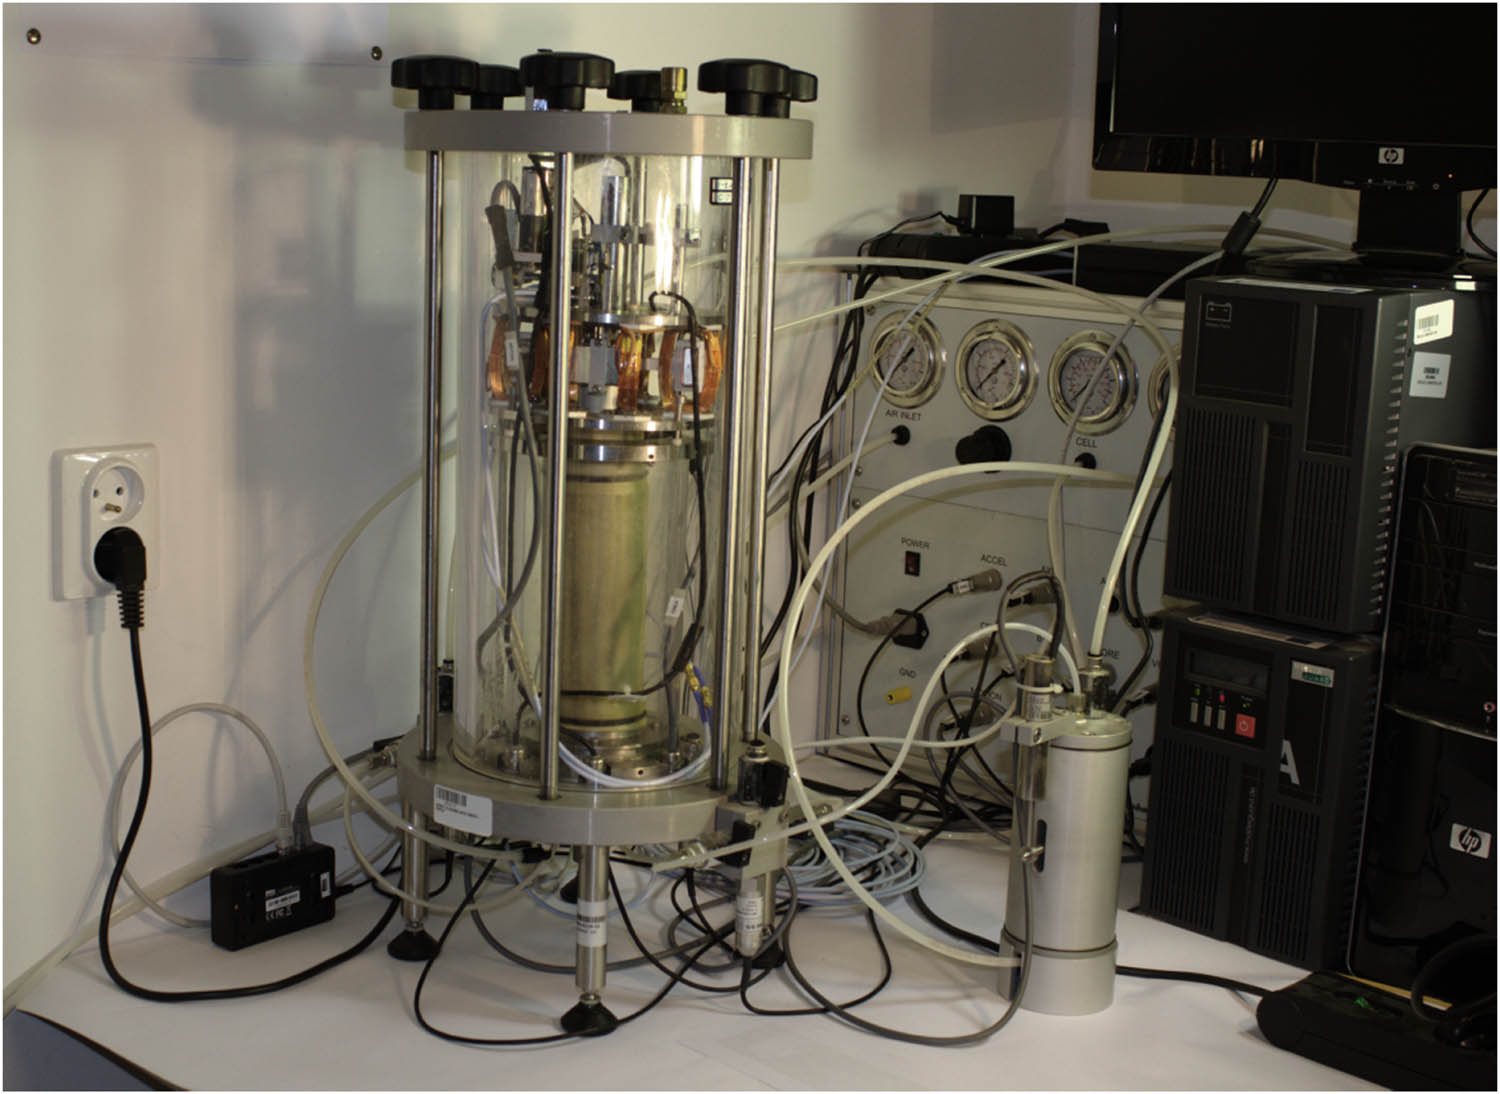
Figure 1
31-WF8500 device.
Source: Authors’ contribution.
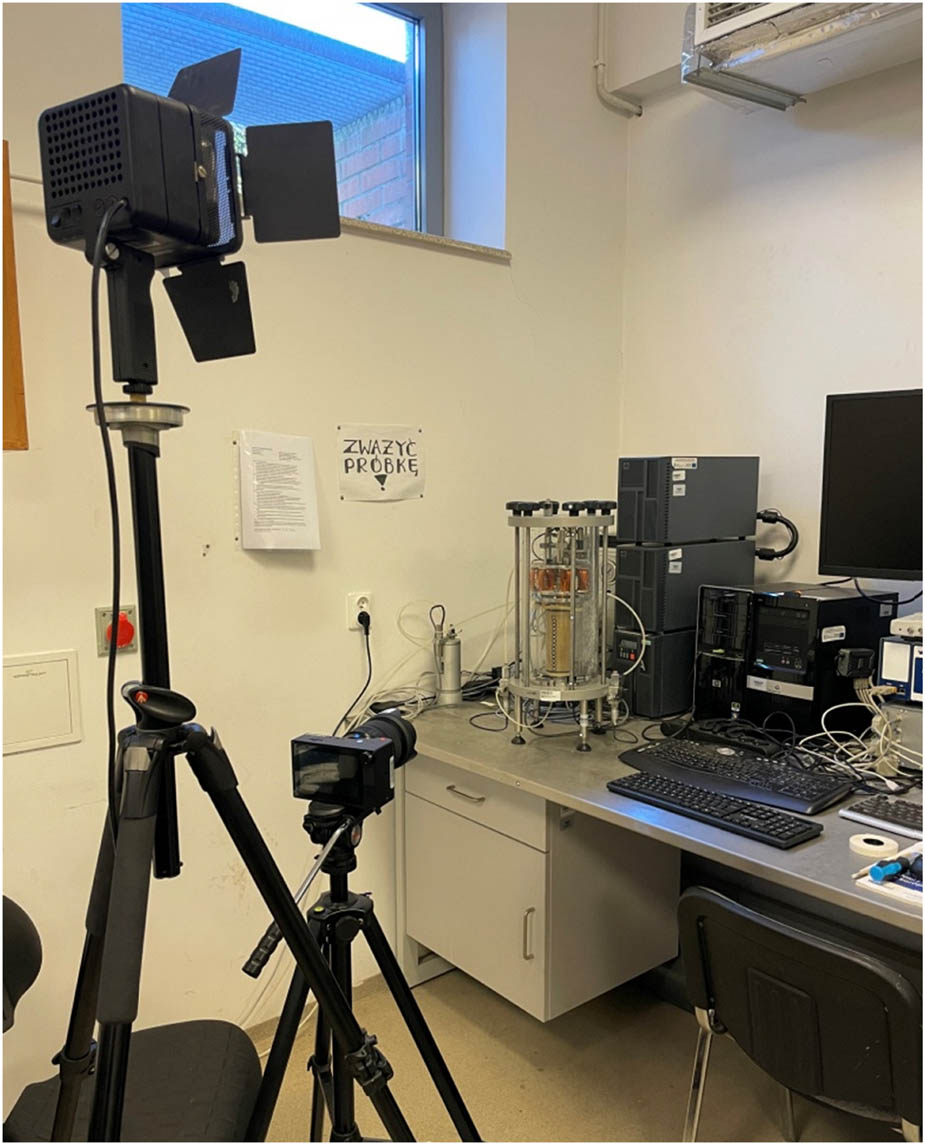
Figure 2
Image recording system.
Source: Authors’ contribution.
Table 1
Properties of the tested soil.
| Soil properties | G s [−] | d 50 [mm] | d 60 [mm] | d 10 [mm] | C U [−] | e max [−] | e min [−] | ρ [g/cm3] |
|---|---|---|---|---|---|---|---|---|
| Sand | 2.65 | 0.60 | 0.80 | 0.20 | 4.0 | 0.70 | 0.41 | 1.94 |
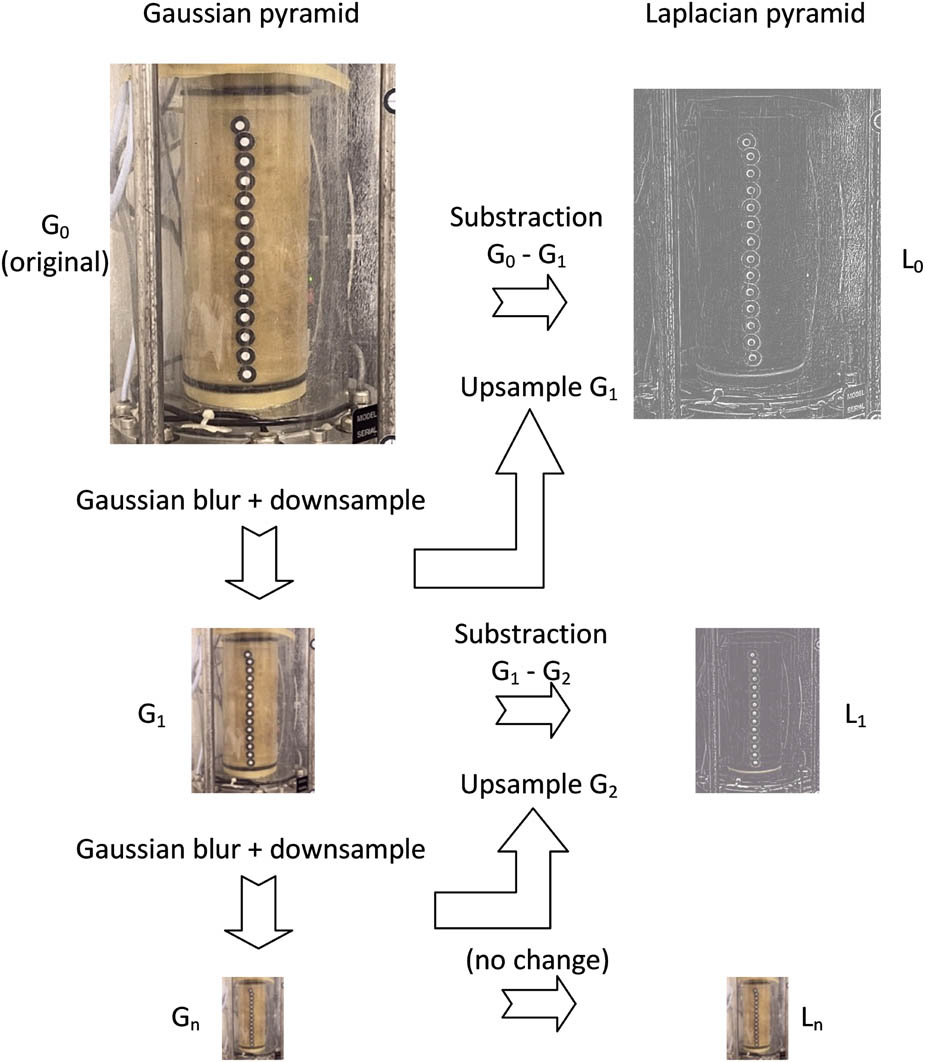
Figure 3
Laplacian pyramid – a multiresolution image representation.
Source: Authors’ contribution.
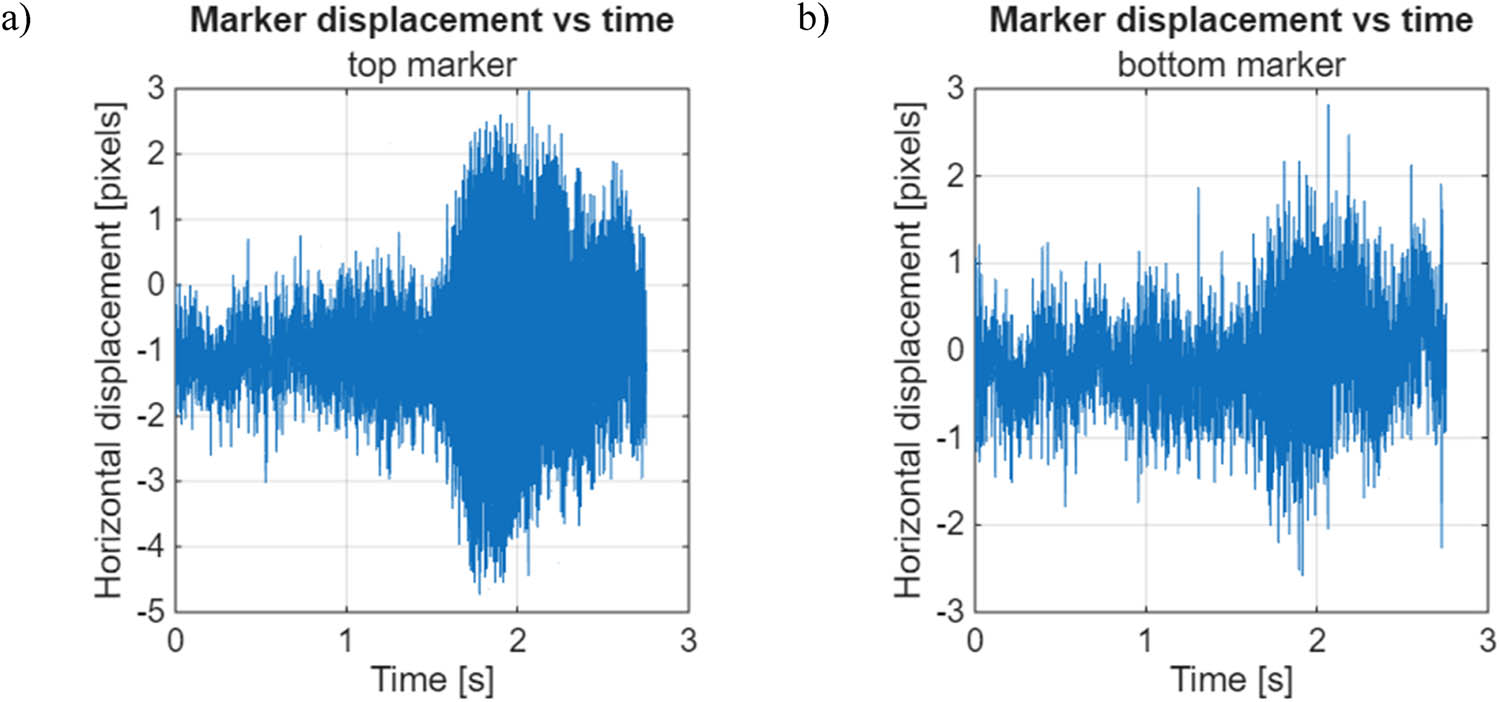
Figure 4
Representative time-domain signals: (a) top and (b) bottom marker.
Source: Authors’ contribution.
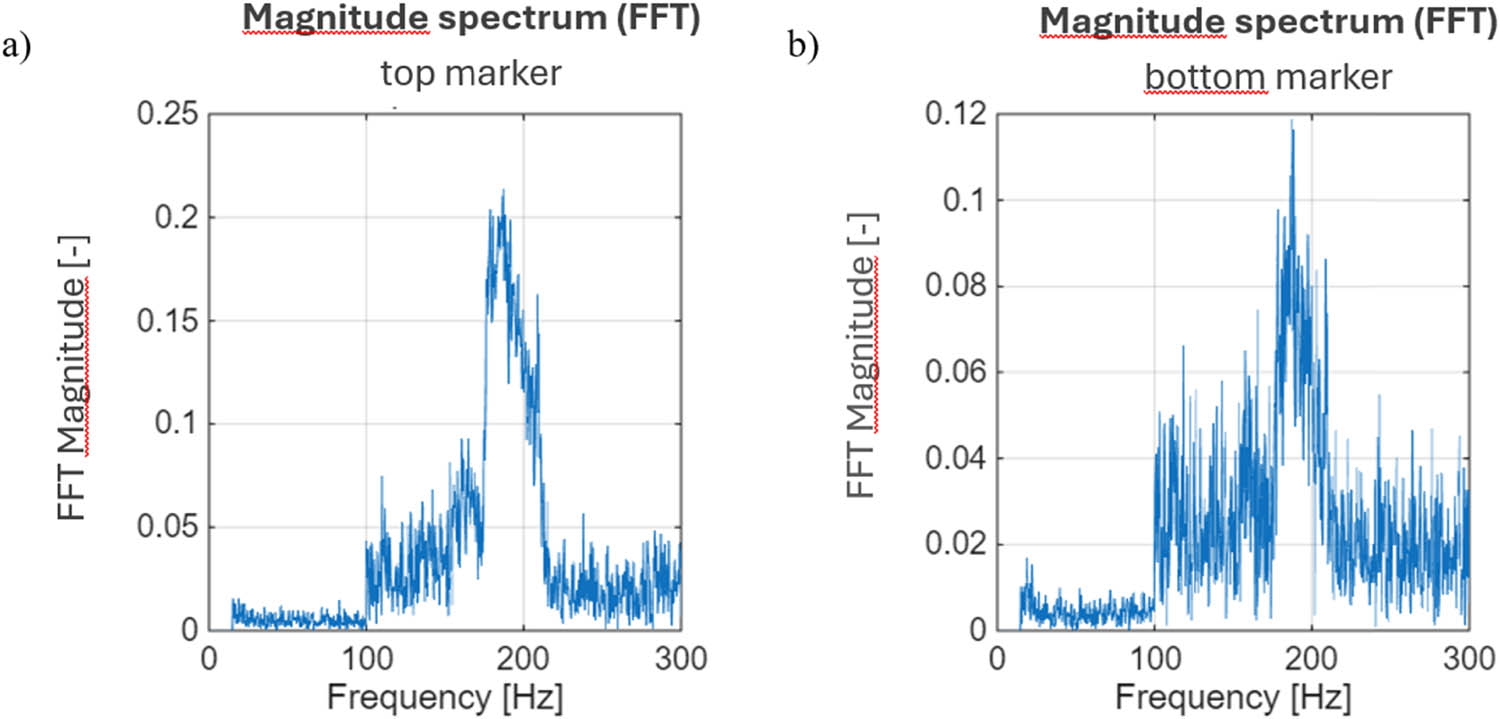
Figure 5
Frequency spectrum corresponding: (a) top and (b) bottom marker.
Source: Authors’ contribution.
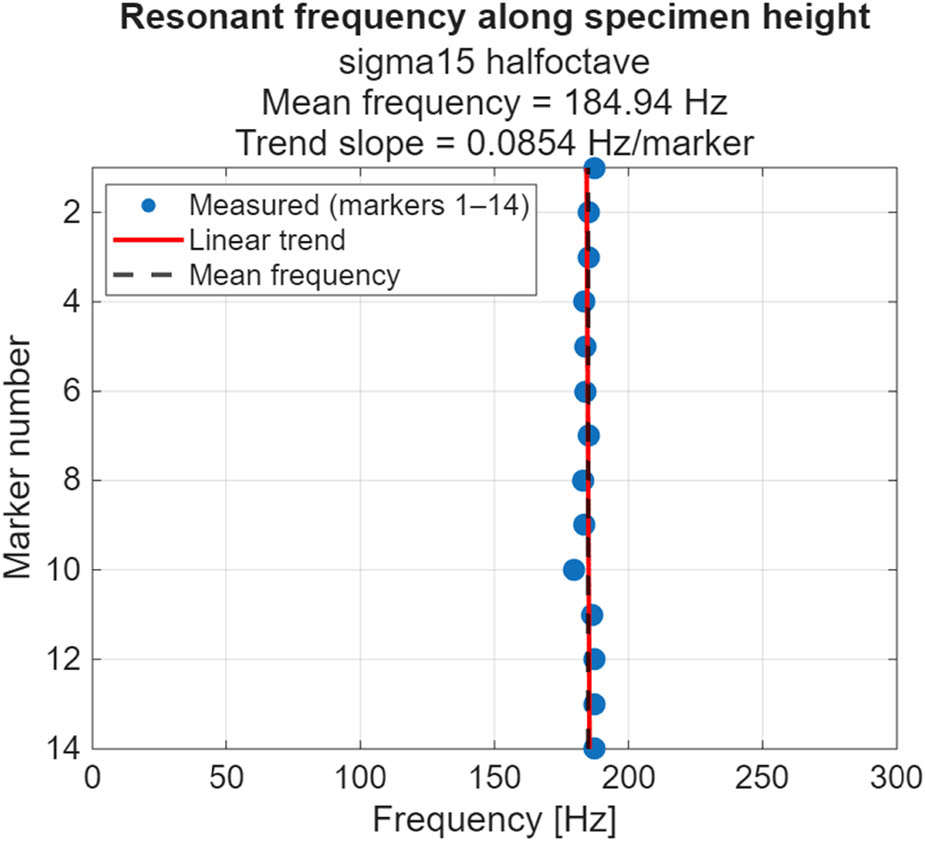
Figure 6
The spatial distribution of the resonant frequency.
Source: Authors’ contribution.
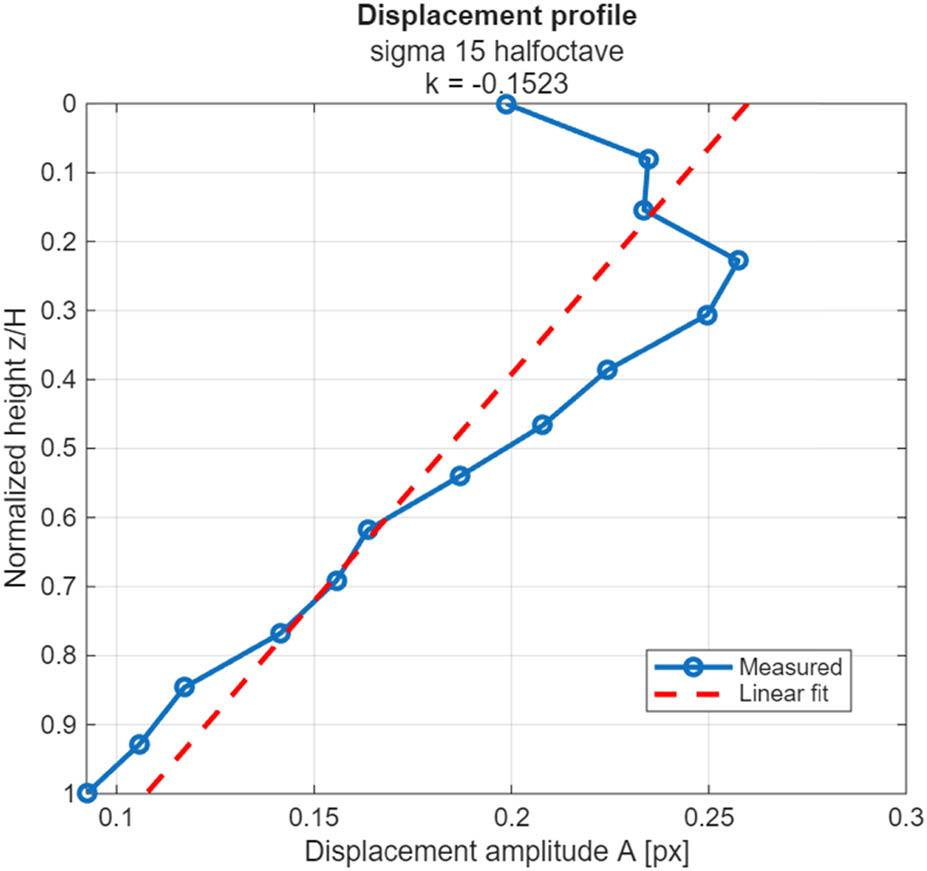
Figure 7
The displacement amplitude profile.
Source: Authors’ contribution.
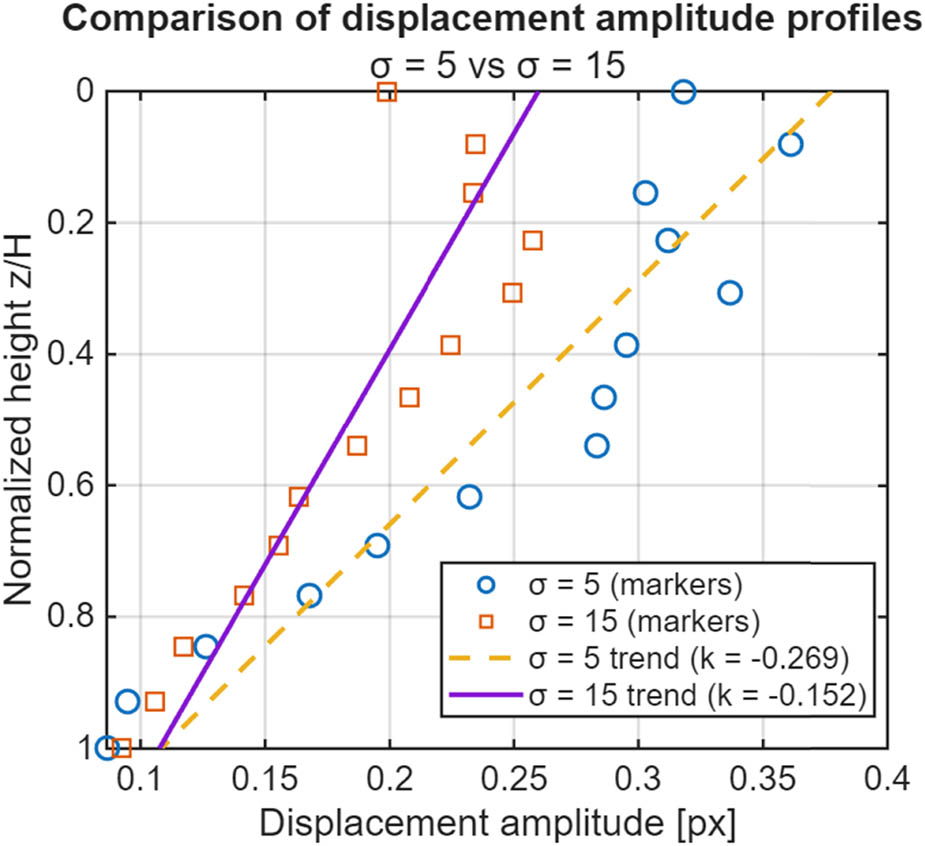
Figure 8
The influence of motion magnification parameters.
Source: Authors’ contribution.
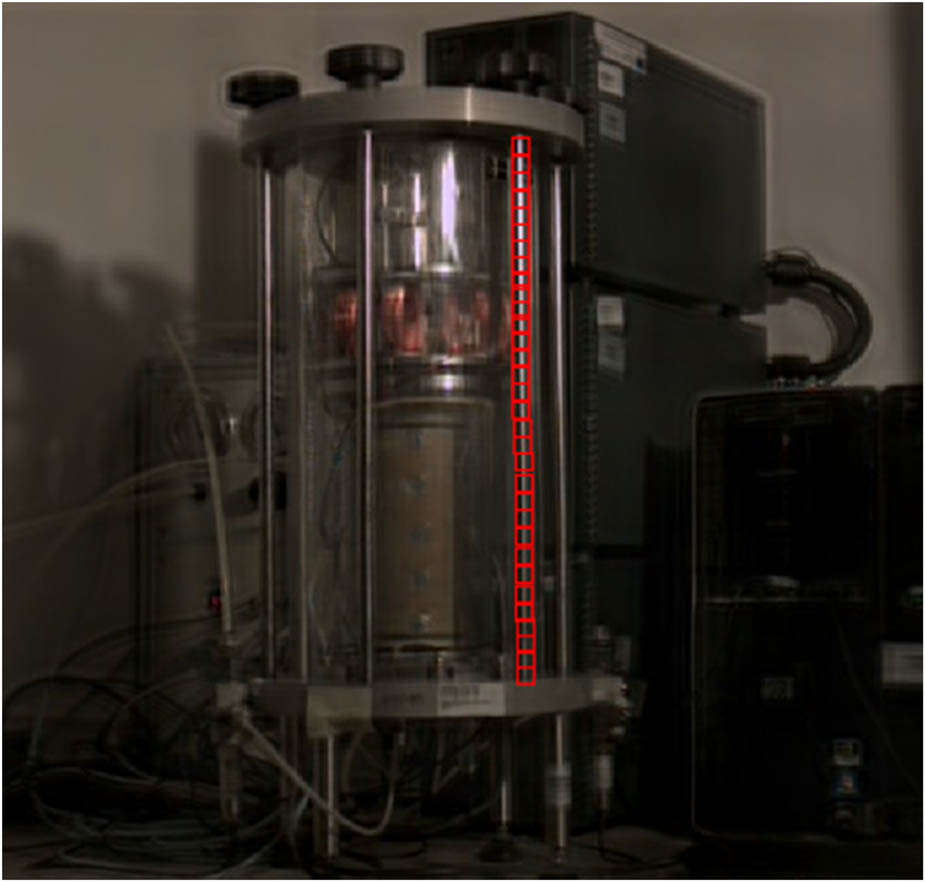
Figure 9
The analysed structural component of the RC/TS device.
Source: Authors’ contribution.
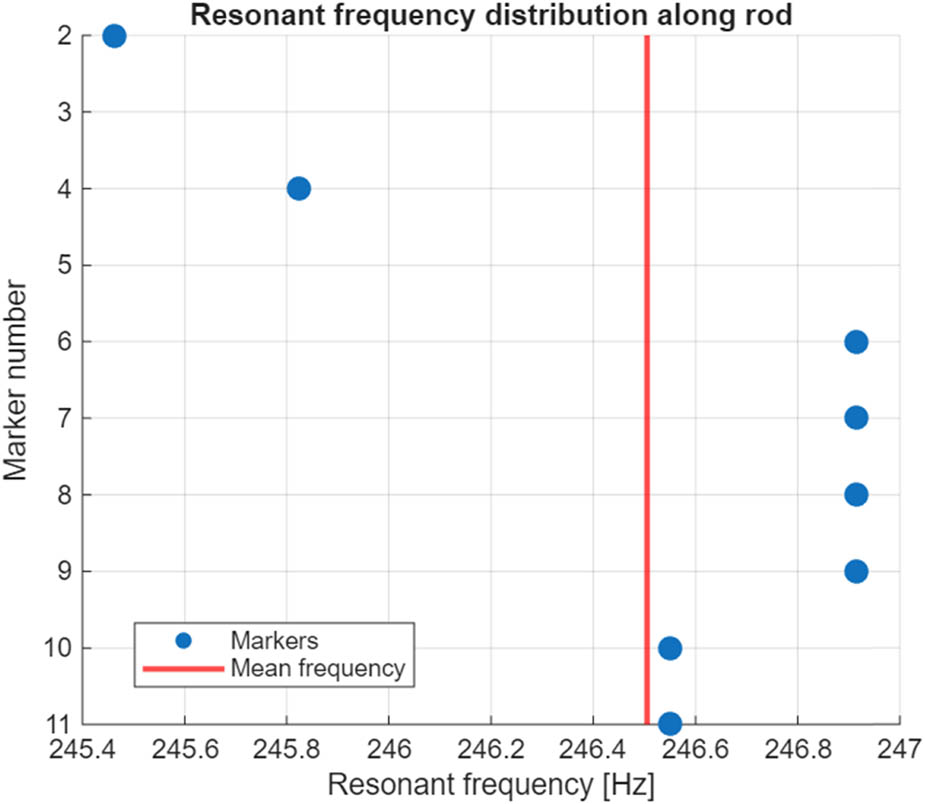
Figure 10
Resonant frequency of the analysed structural component (numbering of markers according to Figure 9, starting from the top).
Source: Authors’ contribution.
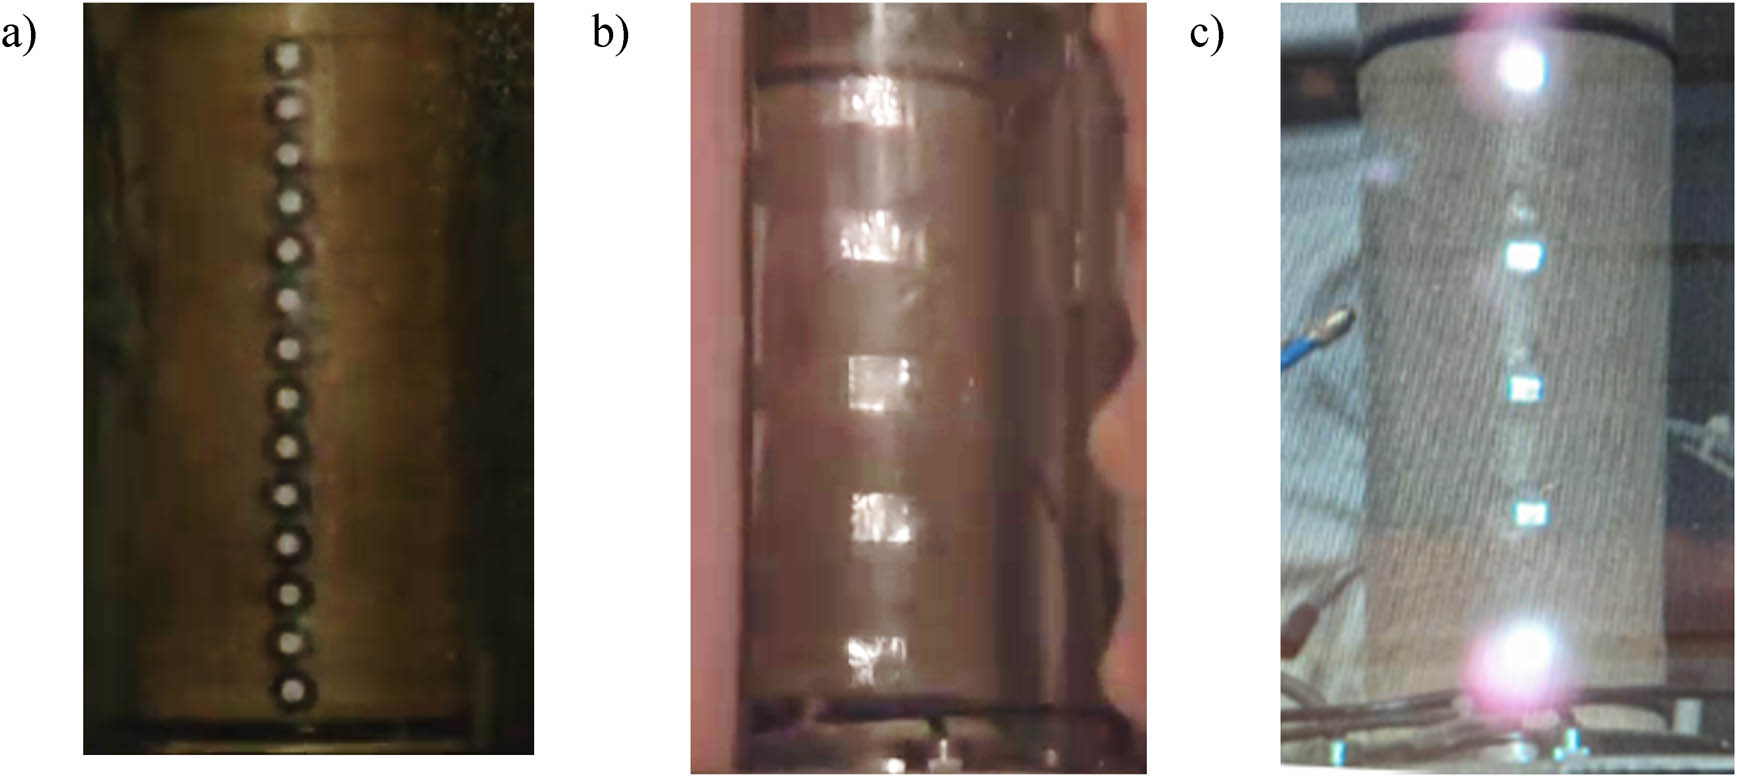
Figure 11
Types of markers tested (film frames): (a) high-contrast round paper discs, (b) aluminium foil squares, and (c) square glass mirrors.
Source: Authors’ contribution.