
1. Introduction
Resonant column (RC) and torsional shear (TS) tests are commonly used in geotechnical engineering to determine the dynamic properties of soils, including the shear modulus and damping ratio in the small-strain range [1–5]. These methods play a key role in characterizing soil behaviour under cyclic and dynamic loading and are widely used in geotechnical engineering in the broadest sense, including the consideration of seismic effects in the design of building foundations.
The interpretation of results from tests conducted in a RC is usually based on idealized assumptions regarding specimen deformation and boundary conditions. In particular, the specimen is modelled as a system with fixed–free boundary conditions, which leads to a predictable deformation distribution characterized by an increase in displacement amplitude with specimen height [6]. The accuracy of this assumption directly influences the estimation of the strain distribution, and thus, the determination of the dynamic properties of the soil, which are treated as the average values across the entire volume of the tested specimen. While studies on the influence of sample characteristics (e.g., its mass) or its mounting in the apparatus on the results obtained are available in the literature [7,8], it is difficult to find any dynamic measurements of, for example, the apparatus housing, which undoubtedly absorbs a small portion of the vibration energy that should be transmitted in full to the sample under observation. For this reason, the mechanical behaviour of the test apparatus housing (and the test rig itself) is rarely taken into account in standard experimental procedures. In practice, structural elements of the RC apparatus, such as the inner cylinder (which acts as the apparatus’s stator) and the housing itself, may undergo deformation under the influence of dynamic excitation. The susceptibility of the apparatus’s supporting structure may affect the recorded response and lead to systematic errors in the measurement of deformations. Studies on the influence of specimen boundary conditions on measurement results are known in the literature, e.g., in the case of triaxial compression apparatus (including comparative analyses with numerical calculation results using discrete element method [9,10]). Despite the potentially high significance of this phenomenon, experimental verification of the deformation patterns of the RC’s load-bearing systems is limited and, to date, has not been described in the literature.
Conventional measurement methods in studies conducted in a RC rely mainly on indirect measurements using accelerometers or inductive displacement transducers mounted at selected points in the system [11]. Although these sensors provide valuable local measurements, they do not allow for a complete understanding of the deformation of the specimen or the testing apparatus. Furthermore, the installation of a measurement system integrated with the apparatus and, indirectly with the specimen itself, may affect the dynamic response of the system and constitute an additional source of uncertainty. One solution to this problem is to equip the device with additional sensors (e.g., accelerometers) to monitor the behaviour of its housing. From a metrological point of view, such a solution alters the configuration of the entire device in terms of its dynamic characteristics and requires separate calibration procedures, which complicates not only the observations themselves but also, above all, the process of preparing the tests and interpreting the results obtained from multiple mechanically coupled sources. The authors have already carried out such modifications to the RC/TS device in the context of cyclic torsion testing – the results can be found in the previous study [8]. To limit the number of mechanical factors influencing the observation of resonant vibrations of samples in dynamic soil testing, a rather convenient solution is to employ optical methods, which allow for changes to the test rig configuration without physically interfering with the device that generates specific boundary conditions during the observation of the tested material’s behaviour.
Advances in the development of optical measurement methods are opening up new possibilities for non-contact deformation analysis in experimental research. Image analysis methods, such as digital image correlation and optical flow analysis, are successfully used in materials and structural engineering research to determine displacement and strain fields without mechanical contact with the test specimen [12–14]. Among the wide range of techniques within digital image processing, motion scaling methods deserve particular attention, as they constitute a promising tool for visualizing subtle displacements by amplifying minor changes in image intensity associated, for example, with structural vibrations [15,16]. These methods enable the observation of displacements at sub-pixel levels and have found application, among other things, in structural monitoring and vibration analysis. However, their application in laboratory geotechnical investigations and, in particular in tests conducted in a RC, has not yet been the subject of systematic analysis. Therefore, the application of image analysis methods in tests conducted using this apparatus has become the main motivation for addressing this issue, as it enables the direct observation of deformations in both the specimen and the testing apparatus itself, which forms part of the measurement setup, thereby providing new information on actual boundary conditions and measurement uncertainty. The inclusion in the canon of standardized techniques for interpreting results obtained from dynamic soil testing, supplemented by digital optical observations processed using advanced numerical algorithms, may contribute to a significant improvement in the quality of the interpretation of experimental results and an increase in the reliability of testing procedures.
The aim of this study is to analyse the deformation patterns observed in soil investigations conducted using the RC/TS apparatus, utilizing high-speed image recording, motion magnification techniques, and the tracking of test markers with varying reflective properties. The proposed approach enables the visualization and quantitative assessment of the distribution of horizontal displacements along the height of the specimen and allows for the estimation of the influence of the structural properties of the measuring apparatus’s support structure on the obtained soil test results. The innovative elements of the analyses carried out are (i) identification of the sample’s deformation profile under harmonic excitation, (ii) assessment of the influence of apparatus deformation on the recorded response, and (iii) assessment of the suitability of motion amplification/magnification techniques as a diagnostic tool in tests conducted using a RC.
The article is organized as follows. Section 2 describes the experimental setup and the data acquisition methodology employed. Section 3 presents the material under investigation. Section 4 explains the principles behind the methods of analysis and synthesis of images processed using motion magnification technology. Section 5 presents the results of the experimental measurements and a discussion of these, as well as a discussion of the limitations of the method in question. Section 6 includes a summary and conclusions.
2. Measurement station
2.1. Resonant column
The tests were carried out using a Wykeham Farrance RC/TS device (Figure 1). The 31-WF8500 model is a dual-purpose device: it functions as both a RC and a TS apparatus. Furthermore, the apparatus’s software incorporates a method for automatically determining the soil damping coefficient.
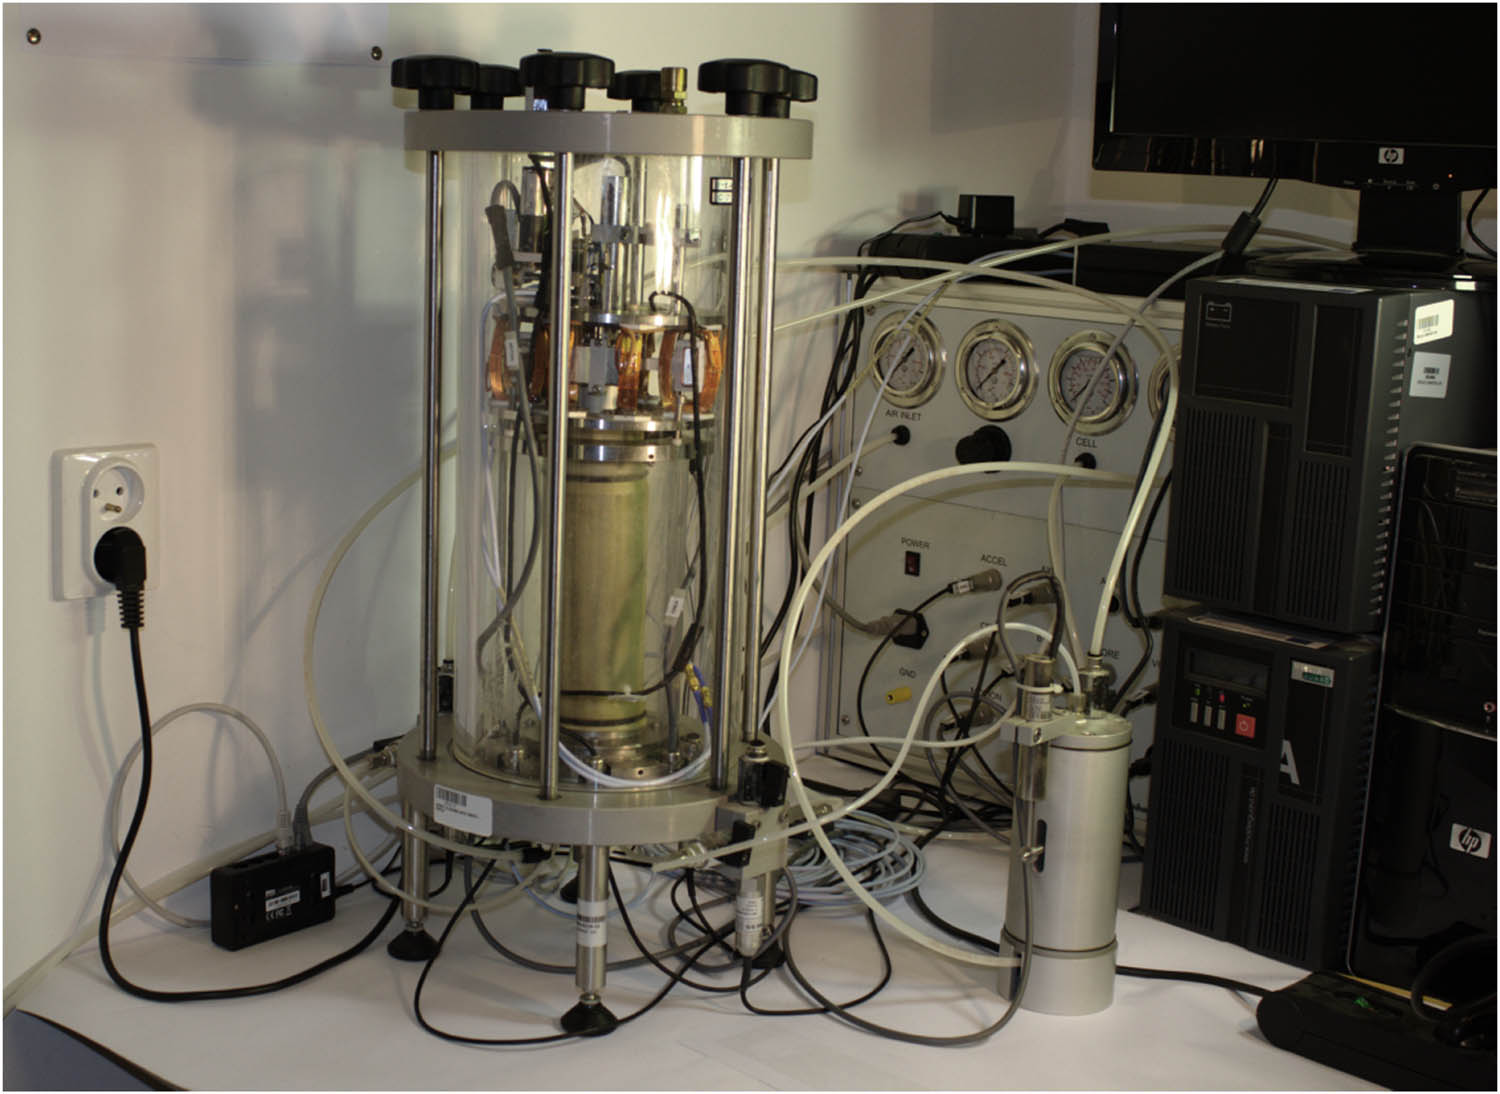
Figure 1
31-WF8500 device.
Source: Authors’ contribution.
In the RC mode, the instrument enables the dynamic excitation of torque at frequencies ranging from 0 to 300 Hz. The instrument allows the measurement of the resonance frequency by generating torsional vibrations at increasing frequencies: in steps (RC mode) or continuously (RC chirp mode). The basic vibration parameters are initial frequency, final frequency, and the amplitude of the electrical voltage driving the vibrations via the electrodynamic force generated in systems comprising stationary coils and moving neodymium–iron–boron magnets. The resonance frequency sought is the frequency at which the sample’s torsion angle is greatest. It is determined on the basis of the amplitude variation curve or changes in vibration acceleration over time. A detailed description of the device, together with all the research possibilities it offers, can be found in ref. [11].
2.2. Image recording system
Digital image recording was carried out using a specialized Kron Technologies CR21-HD camera (Figure 2), which is used in complex data analysis conducted in research and development centres, military and aviation facilities, as well as in audiovisual media production studios.
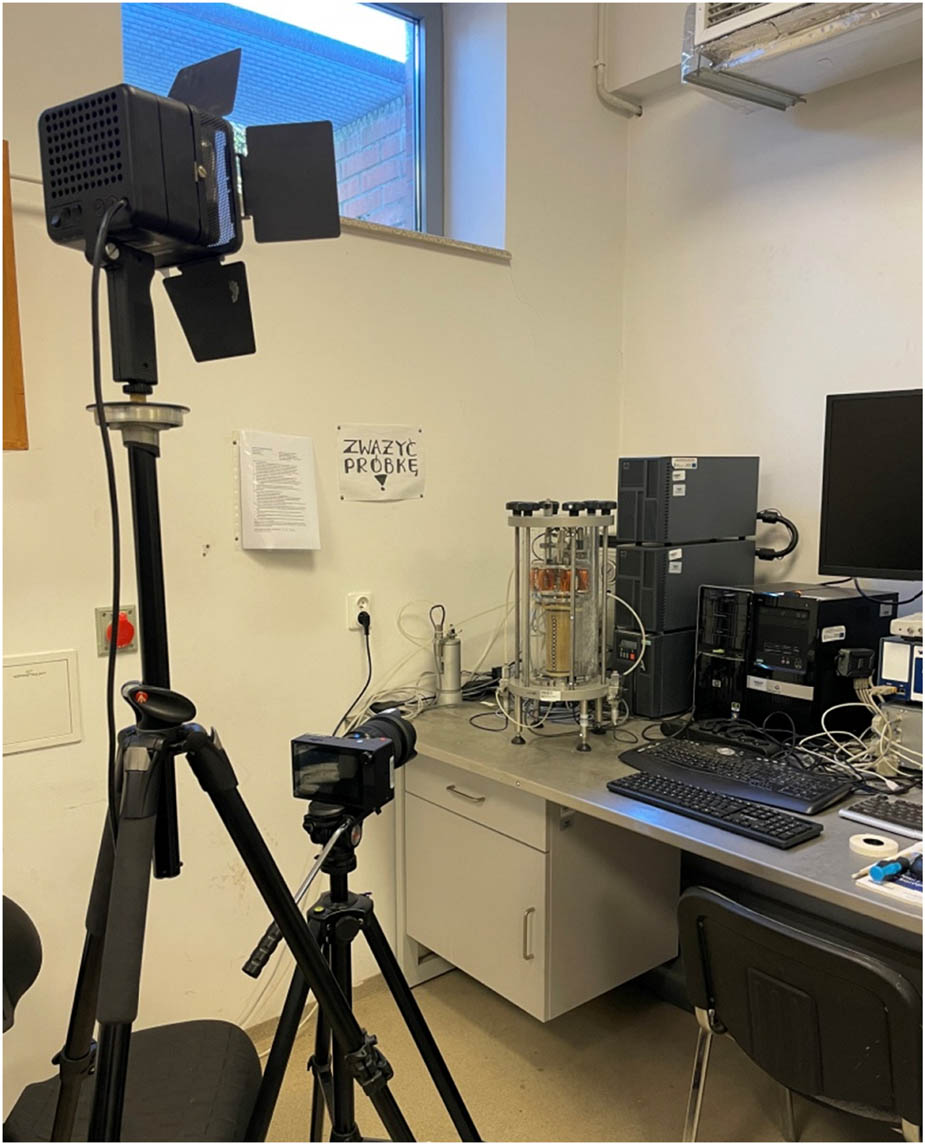
Figure 2
Image recording system.
Source: Authors’ contribution.
The camera features a data throughput of up to 2.1 Gpx/s, a maximum resolution of 1,920 × 1,024 pixels, a frame rate of 1000 FPS at full resolution, a maximum frame rate of 24,046 FPS at a resolution of 640 × 96 pixels, a light sensitivity of ISO 1000–16,000 in monochrome mode and 500–8,000 in colour mode, and a 12-bit depth. The camera was fitted with a SIGMA 24–70 lens. It was mounted on a floor-standing laboratory tripod (Leica) to isolate it from any vibrations transmitted by the laboratory table on which the 31-WF8500 device is installed. The workstation was illuminated using a stable halogen light source with constant intensity and high (1,000 W) power. The camera’s field of view covered the entire 31-WF8500 apparatus, enabling simultaneous observation of the sample’s movements and the structural components of the device. The camera’s position remained unchanged throughout the entire experiment.
3. Material used in tests
One type of non-cohesive soil (internal code P5) was selected for the study; this soil had already been the subject of previous research, described, for example, in ref. [17]. The properties of the soil selected for analysis are summarized in Tabel 1: G S – specific gravity, d 50, d 60, d 10 – values of the particle diameter at 50%, 60%, and 10% in the cumulative distribution, C U – uniformity coefficient, e max – maximum void ratio, e min – minimum void ratio, ρ – bulk density. Details regarding the grain shape and grain size distribution of the sand under investigation can be found in ref. [18].
Table 1
Properties of the tested soil.
| Soil properties | G s [−] | d 50 [mm] | d 60 [mm] | d 10 [mm] | C U [−] | e max [−] | e min [−] | ρ [g/cm3] |
|---|---|---|---|---|---|---|---|---|
| Sand | 2.65 | 0.60 | 0.80 | 0.20 | 4.0 | 0.70 | 0.41 | 1.94 |
The specimen was formed using a mould containing a latex membrane. The cylindrical specimen had a diameter of 70 mm and a height of 140 mm and was prepared by compacting dry sand in five layers. Based on the data regarding specimen preparation and the limiting void ratios given in Table 1, the relative density of the specimen was approximately 94%. The mass and geometric dimensions of the formed specimen were precisely controlled and meticulously recorded. Due to the large number of specimens prepared in this manner over the past dozen or so years, repeatable mechanical properties of the prepared specimens were obtained each time – the results of tests, e.g., TS, can be found in ref. [17]. After placing the specimen in the apparatus’s test chamber, the soil was subjected to isotropic pressure (200 kPa) for 24 h. The specimen was then driven into resonance vibration using various load amplitudes (which are usually selected by trial and error, observing the deformations induced in the specimen material).
In order to identify several characteristic reference points for detailed numerical analysis, including motion magnification, marker tracking, and fast Fourier transform (FFT)-based spectral analysis, the sample was covered with a set of markers arranged along the vertical axis at equal intervals. Three types of markers were used in the study:
Reflective aluminium foil markers (in the form of squares and narrow rectangles),
Miniature mirrors (square, 5 mm on a side),
Round, high-contrast paper markers.
4. Motion magnification methods
4.1. Methods based on motion tracking
Attempts to magnify movements in video footage that are invisible to the naked eye have been underway for over 20 years [15]. In some cases, approaches to solving this problem have utilized interesting ideas, such as the Cartoon Animation Filter, which involves, among other things, adding to the source signal a smoothed, inverted and time-shifted version of it, corresponding to the second derivative (i.e., the acceleration) of the signal contained in the source [19]. These approaches are based on the Lagrangian perspective, which involves tracking the trajectories of particles over time; this is computationally expensive and requires the use of additional techniques (e.g., motion segmentation and image interpolation), and image synthesis is difficult to perform in areas of occlusion boundaries and complex movements (numerous artefacts arise that reduce the quality of the result, see ref. [16]). The complexity of such algorithms is high and the demand on computational resources often exceeds available capacity.
4.2. Methods based on changes in colour intensity
Techniques that are highly promising in terms of complexity and processing speed stem from the Eulerian perspective, in which the intensity of a given point in the image varies over time. Motion enhancement involves amplifying temporal colour changes at fixed positions, utilizing numerical solutions that form the basis of optical flow algorithms [20,21]. According to ref. [16], assuming that at time t the analysed image consists of points with known positions x and intensities I(x,t), a displacement δ(t) in the image causes a change in the intensity of these points, which can be expressed by the following linear relationship:
whereasThe idea behind enhancing the displacement δ(t) is to synthesize an image in which the intensity of the pixels follows the rule:where α is the assumed gain scale. Approximating the image using a first-order Taylor series expansion in terms of the position x of the points:It is possible to extract the product of the derivative f’(x) and the displacement (t) by applying a bandpass filter that removes the initial intensity pattern of the points f(x) in the analysed image. The result of applying such a filter is an isolated motion component:which can be increased/amplified by a factor α:After adding (6) to the original image configuration:
and taking into account (4): the final solution is reached (3).Numerous experiments involving the linear amplification of motion recorded in video footage using the Euler method have shown that this technique performs quite well for small amplification factors and high spatial frequencies [22]. It has been noted that high gain values mainly affect unwanted noise. The solution to this serious problem is a modification of the method, involving the calculation of local phase changes to measure motion (without the need to calculate optical flow), followed by temporal processing to enhance motion in selected frequency bands. This utilizes the so-called controllable pyramids (in this case, Laplace pyramids), which are a transformation that decomposes the image into representations of varying resolutions and levels of detail, corresponding to different frequencies in the case of motion analysis. In accordance with the idea presented in ref. [22], the configuration of the change in image intensity f(x) caused by a displacement δ at time t can be written in the form of a sum of complex sinusoids S ω (x,t), using a Fourier series decomposition of the form:
where ω is the frequency that can be isolated from the image using bandpass filters based on controllable Laplacian pyramid transforms. The Laplacian pyramid allows an image to be decomposed into: a general low-resolution structure (known as low frequencies), medium-scale details, fine textures, and edges (known as high frequencies):Image = Coarse Shape + Large Details + Medium Details + Fine Details.
Individual structures with different resolutions (i.e., frequencies) are stored at different levels of the pyramid (see Figure 3).
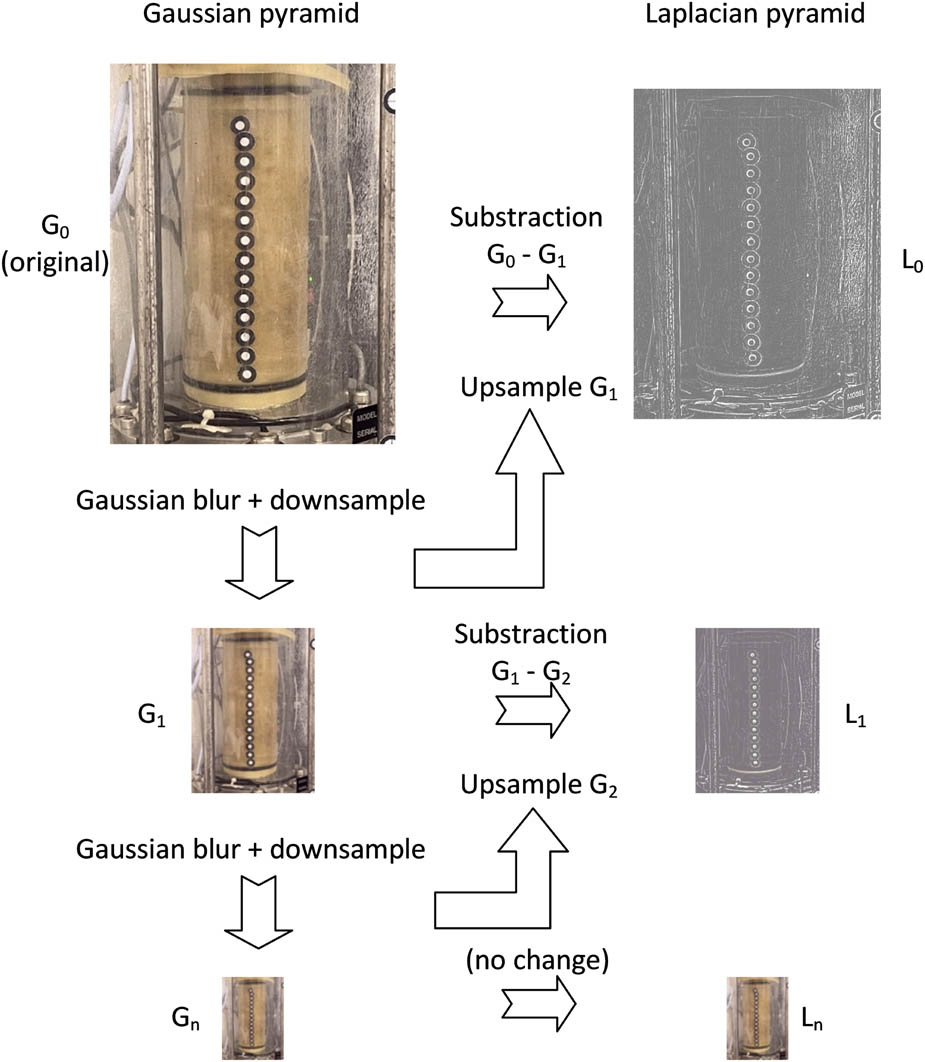
Figure 3
Laplacian pyramid – a multiresolution image representation.
Source: Authors’ contribution.
Gaussian smoothing (blurring), which is applied during the Laplacian pyramid construction step in the motion magnification process, is controlled by the coefficient σ, which determines the spatial scale and balances noise suppression, signal stability, and the preservation of local spatial details. The individual levels of the Laplacian pyramid maintain specific, constant proportions relative to one another, resulting from the chosen partitioning parameter (e.g., a half-octave, i.e., a ratio of 20.5 = 1.414, or a full-octave, i.e., 21 = 2). After applying such a transform, the processed image corresponding to a given frequency contains information about the displacement δ(t) encoded in the phase of the sine wave (the exponent in (11)):
from which the term ω(x) can be removed using a filter balanced with respect to the constant component. The component isolated in this way, which contains information about the displacement corresponding to a given frequency ω:can be amplified using the gain factor α, thereby increasing the phase of the sinusoidal representation of the analysed image:Because the phase-based motion magnification method estimates motion from local phase variations rather than from discrete pixel shifts, the reconstructed displacement signals are not restricted to integer pixel values. Consequently, the resulting marker trajectories may contain sub-pixel displacement estimates, including values significantly smaller than one pixel. With the enhanced motion for each analysed frequency represented at a given level of the pyramid, the final image synthesis involves simply combining (adding) all levels of the pyramid to produce the effect described by equation (3).
Given the positive results obtained to date from the use of the optical flow method in tests conducted using the 31-WF8500 apparatus in TS mode [13], the authors decided to apply a modified Euler method to determine the distribution of vibration amplitudes at selected points on the lateral surface of soil samples and their resonance frequencies, as measured using the same apparatus, utilizing a Matlab code available online [23].
5. Research findings and discussion
5.1. Visualization of deformation patterns
Motion magnification enabled visualization of vibrations in the sample that were not observable in the raw video footage. The enhanced image sequences revealed horizontal displacements of surface markers distributed along the height of the specimen. The observed deformation pattern was dominated by transverse movement consistent with the applied load. Motion magnification enabled the unambiguous identification of the relative displacements of individual markers and the assessment of the deformation profile.
The recorded displacement signals from the markers were analysed using the FFT algorithm, which enabled the resonance frequency to be determined. The displacement signals correspond to marker trajectories measured in image coordinates (pixels). Since the objective of the study was to identify vibration modes and resonance frequencies, the analysis was performed directly in the image domain. The time histories of the displacements were, for the most part, consistent with the applied loads in the RC test. Signal quality varied along the height of the specimen – markers in the upper part exhibited a stable and distinct waveform, while markers near the base were characterized by lower amplitudes and higher noise levels. Figure 4 shows representative signals in the time domain.
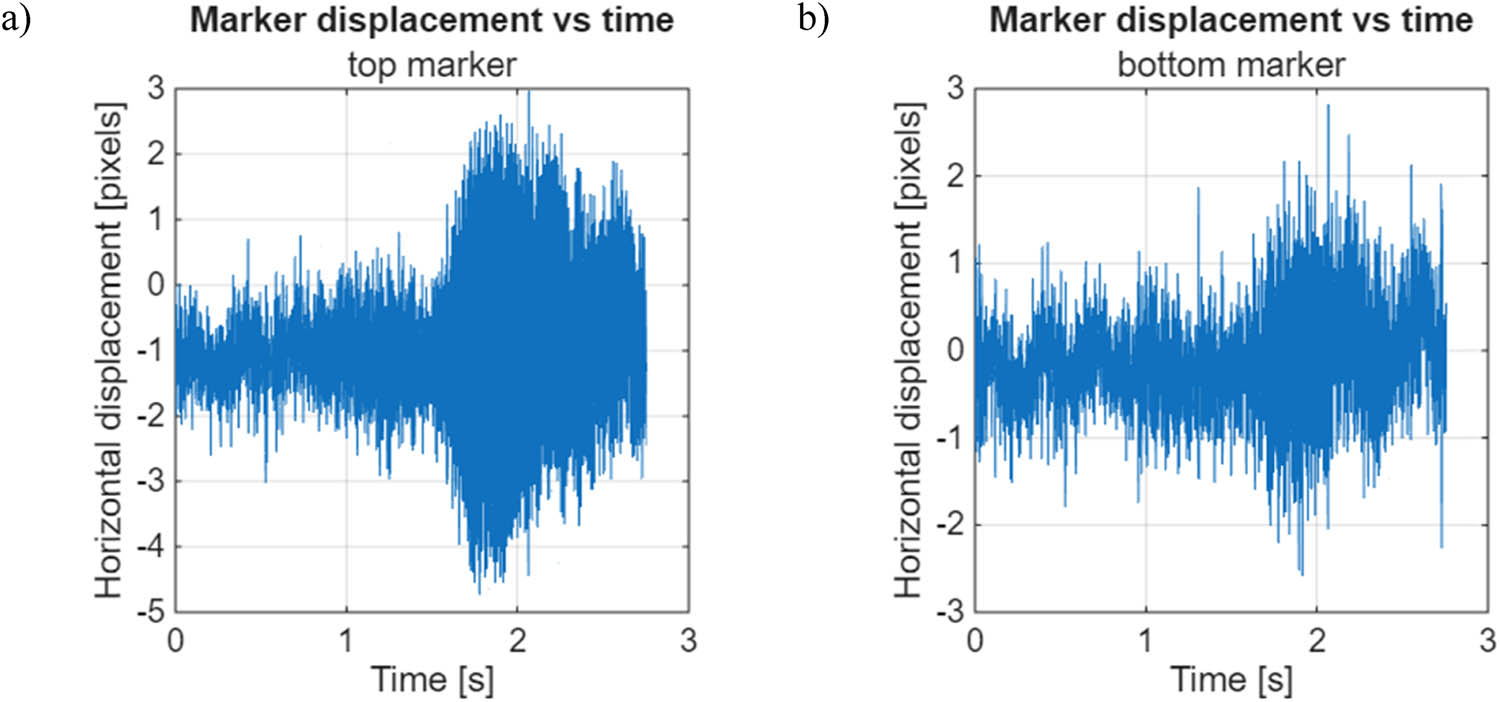
Figure 4
Representative time-domain signals: (a) top and (b) bottom marker.
Source: Authors’ contribution.
The FFT spectral analysis revealed a distinct peak corresponding to the sample’s resonance frequency. For markers located in the upper and central parts of the sample, the peak was well-defined, indicating a high signal-to-noise ratio and reliable frequency identification. The frequency spectra corresponding to the upper and lower markers are shown in Figure 5. The frequency spectra presented in Figure 5 show the FFT magnitude of the tracked marker displacement signals. The FFT magnitude is a dimensionless quantity representing the relative contribution of individual frequency components to the measured signal.
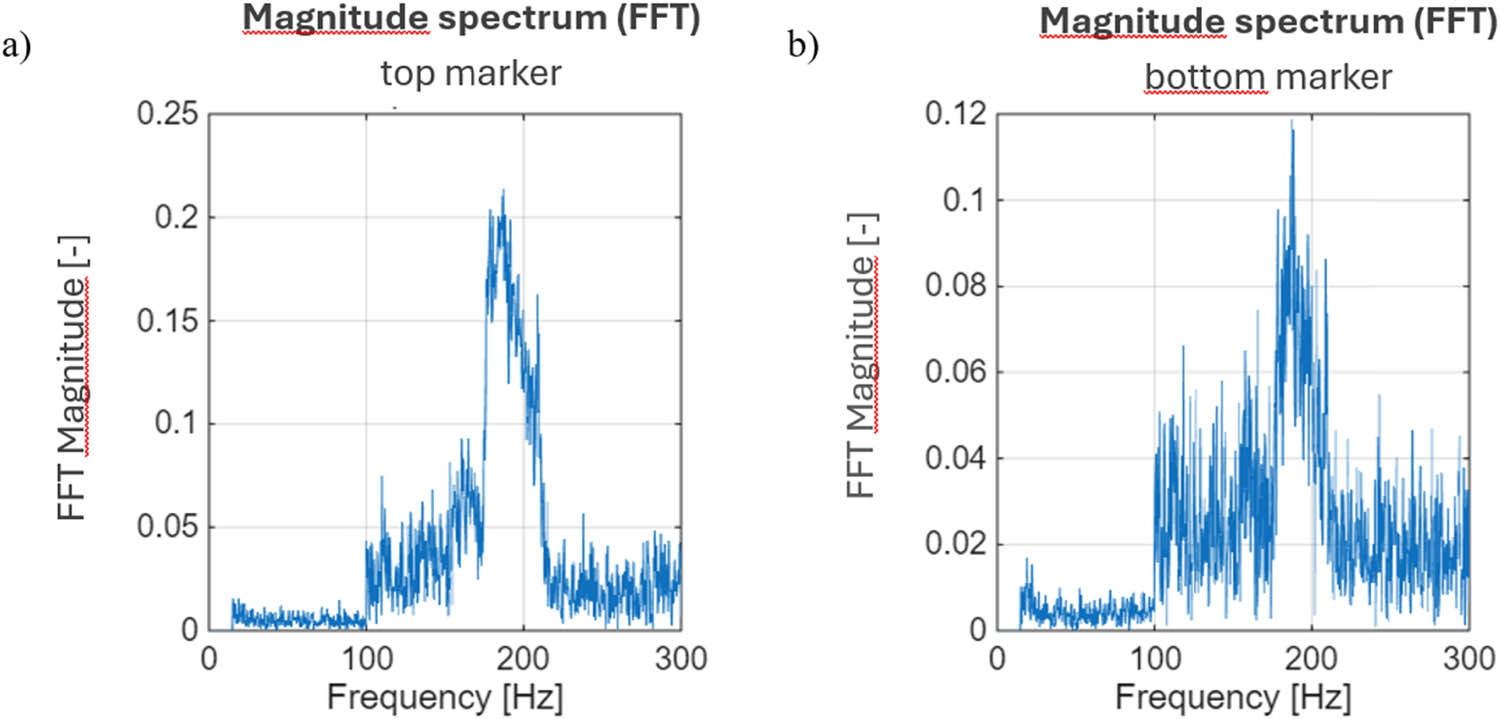
Figure 5
Frequency spectrum corresponding: (a) top and (b) bottom marker.
Source: Authors’ contribution.
The distribution of the resonance frequency along the height of the sample indicates that the frequency remains approximately constant for most markers (Figure 6). This is consistent with the theoretical assumptions of the model of a uniaxially torsioned rod in a fixed–free configuration and confirms the reliability of the optical method used.
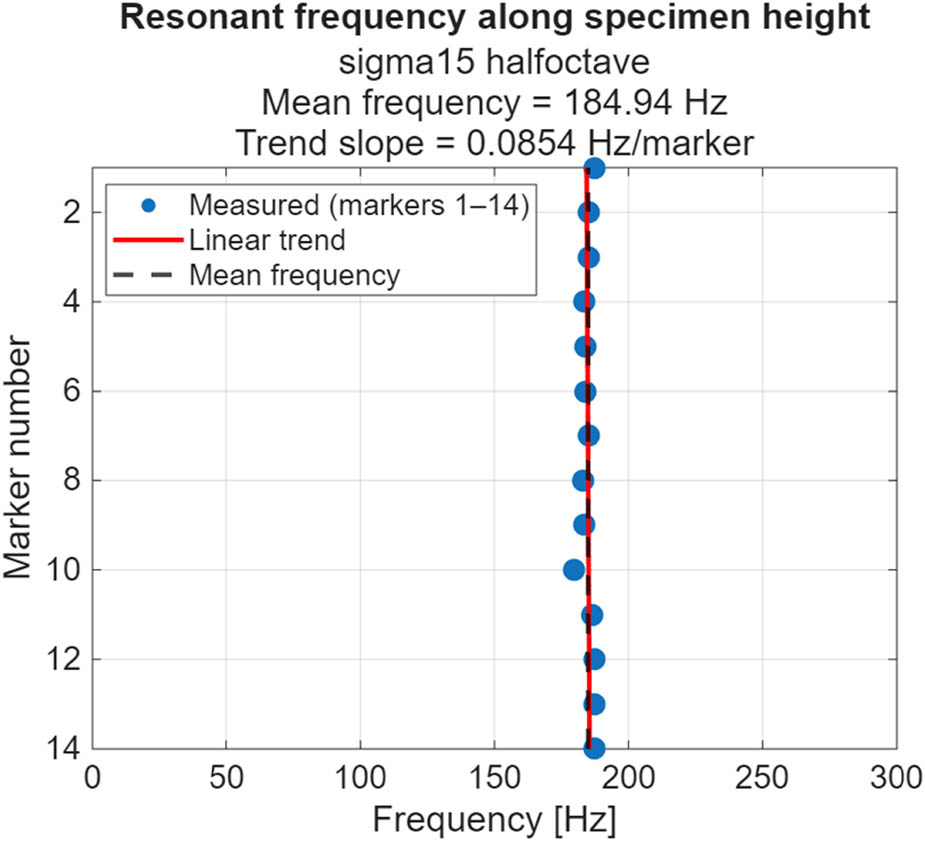
Figure 6
The spatial distribution of the resonant frequency.
Source: Authors’ contribution.
The displacement amplitude profile A(z) showed a general upward trend toward the free end of the specimen, but deviated from an ideal linear distribution (Figure 7). The slight slope of the trend line indicates a flattened amplitude distribution. This phenomenon can be attributed to the compliance of the base, the interaction between the specimen and the apparatus, and the spatial smoothing effect introduced by the amplification of the motion.
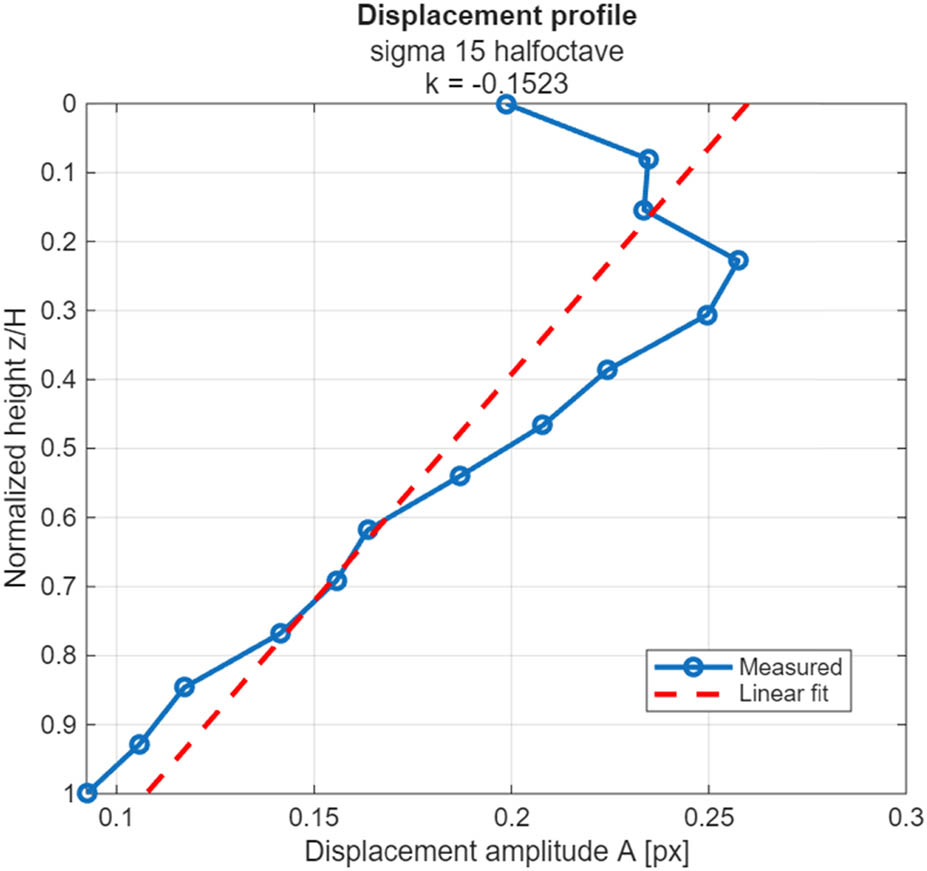
Figure 7
The displacement amplitude profile.
Source: Authors’ contribution.
A parametric analysis of motion enhancement settings revealed that the choice of parameters has a significant impact on the quality of the results. Low values of the spatial smoothing parameter σ lead to increased sensitivity to noise, while high values ensure greater stability at the expense of spatial resolution (Figure 8). In the case under investigation, the configuration σ = 15 with half-octave filtering (i.e., the pyramid of transformed images has twice the number of levels) proved to be the optimal compromise between signal stability and its physical interpretability.
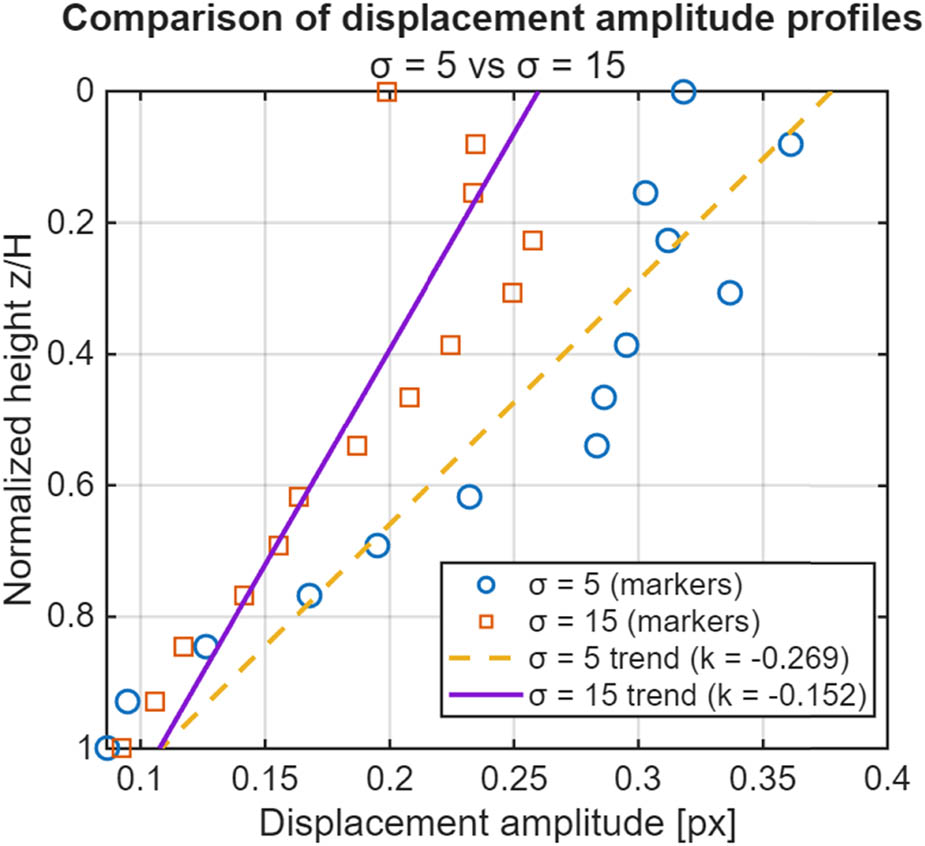
Figure 8
The influence of motion magnification parameters.
Source: Authors’ contribution.
The results indicate that, in the analysis of RC tests, the stability and consistency of the reconstructed displacement field are more important than the preservation of fine spatial details. Furthermore, it has been demonstrated that optical techniques can be effectively used not only for qualitative visualization but also for the quantitative assessment of dynamic response and the identification of measurement limitations. It should be emphasized that the resonant frequencies of the soil under investigation, determined using the optical method, correspond closely to the frequencies measured by the accelerometers and proximity sensors built into the device.
To assess the influence of the test apparatus on the results obtained, additional measurements were carried out on the vibrations of a structural element of the apparatus, namely, the rod connecting the base to the upper cover of the RC apparatus (Figure 9).
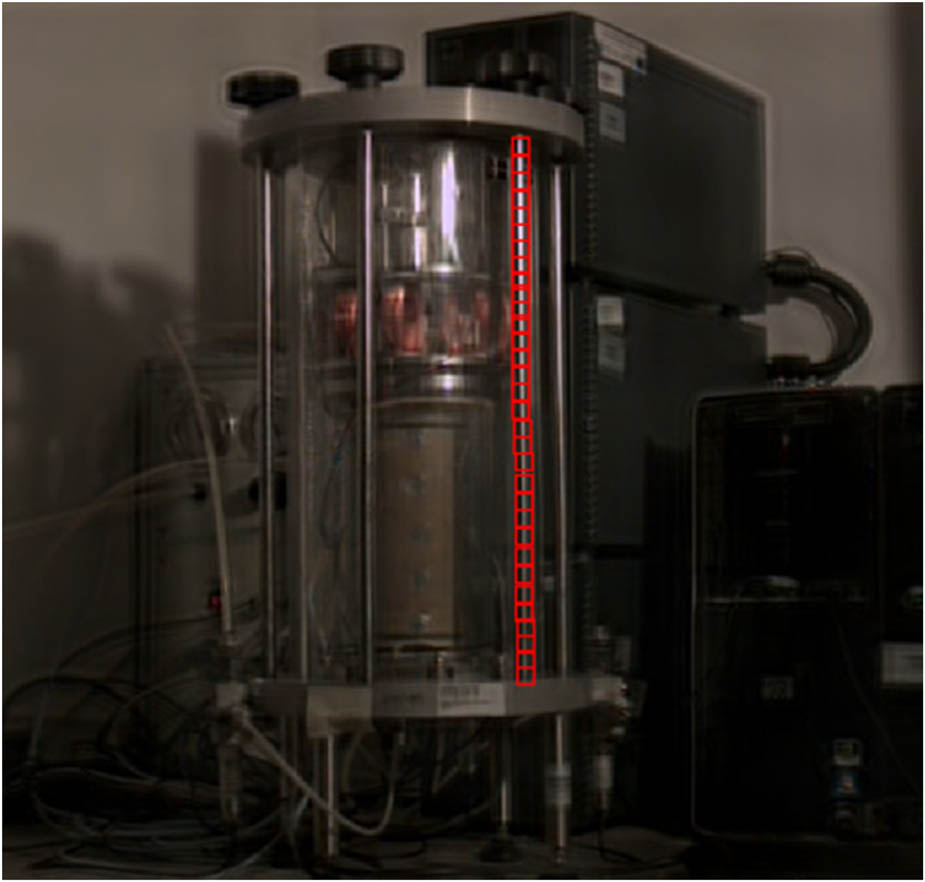
Figure 9
The analysed structural component of the RC/TS device.
Source: Authors’ contribution.
Spectral analysis revealed the presence of a distinct and stable resonance frequency of approximately 246 Hz (±1 Hz), differing from the resonance frequency of the sample (∼185 Hz). The uniformity of this frequency indicates a global vibration mode of the structural element (Figure 10).
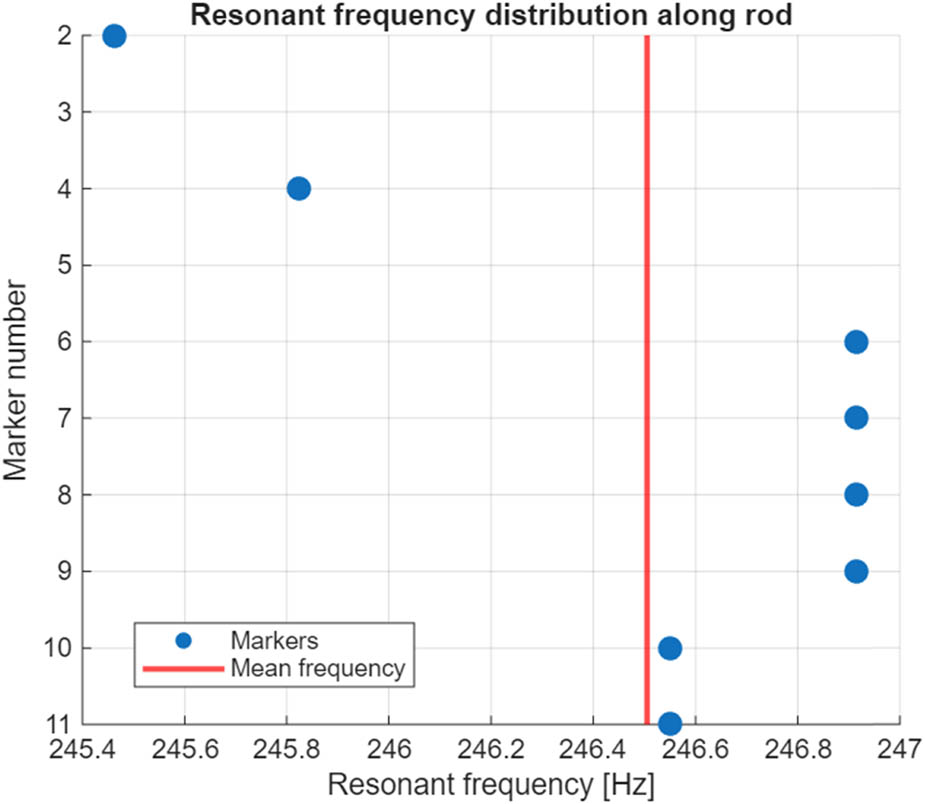
Figure 10
Resonant frequency of the analysed structural component (numbering of markers according to Figure 9, starting from the top).
Source: Authors’ contribution.
This result confirms that the testing apparatus is not a dynamically passive system, but possesses its own vibration characteristics, which may influence the recorded system response. This means that the measured displacement field represents the response of a coupled system comprising both the soil sample and the structural components of the apparatus. This influence is particularly significant in the lower part of the sample, where displacement amplitudes are small and the relative contribution of the apparatus’s structural vibrations becomes greater. However, this indicates that the observed rod resonance mode is not directly coupled with the specimen resonance mode investigated in this study. At the specimen resonance frequency, only small rod displacements were observed and no reliable quantitative estimation of their contribution to the measured specimen deformation could be obtained from the available data. It should be noted that, in the case of samples with higher stiffness, a specific resonant interaction between the sample and the apparatus is to be expected, which may manifest itself in the form of a certain shift in the maximum vibration amplitudes considered in the frequency domain and, consequently, a distortion of the values determined on this basis — for example, the Kirchhoff modulus. The ability to identify vibrations in the apparatus structure and to determine its resonance characteristics justifies the need to conduct these additional observations during soil testing.
The results obtained also highlight an additional advantage of the optical method used. The motion magnification technique not only enables the analysis of sample behaviour but also the identification of the dynamic properties of the apparatus components, thereby allowing for a more comprehensive interpretation of the results from the RC.
5.2. Comparison of marker types
The effectiveness of various types of markers was assessed in terms of tracking stability and the accuracy of displacement estimation.
5.2.1. High-contrast round markers
Round paper markers with a contrasting outline produced the most stable results. The intensity distribution of their image remained constant during vibration cycles, enabling reliable displacement measurement with sub-pixel accuracy and minimal sensitivity to changes in lighting (Figure 11a).
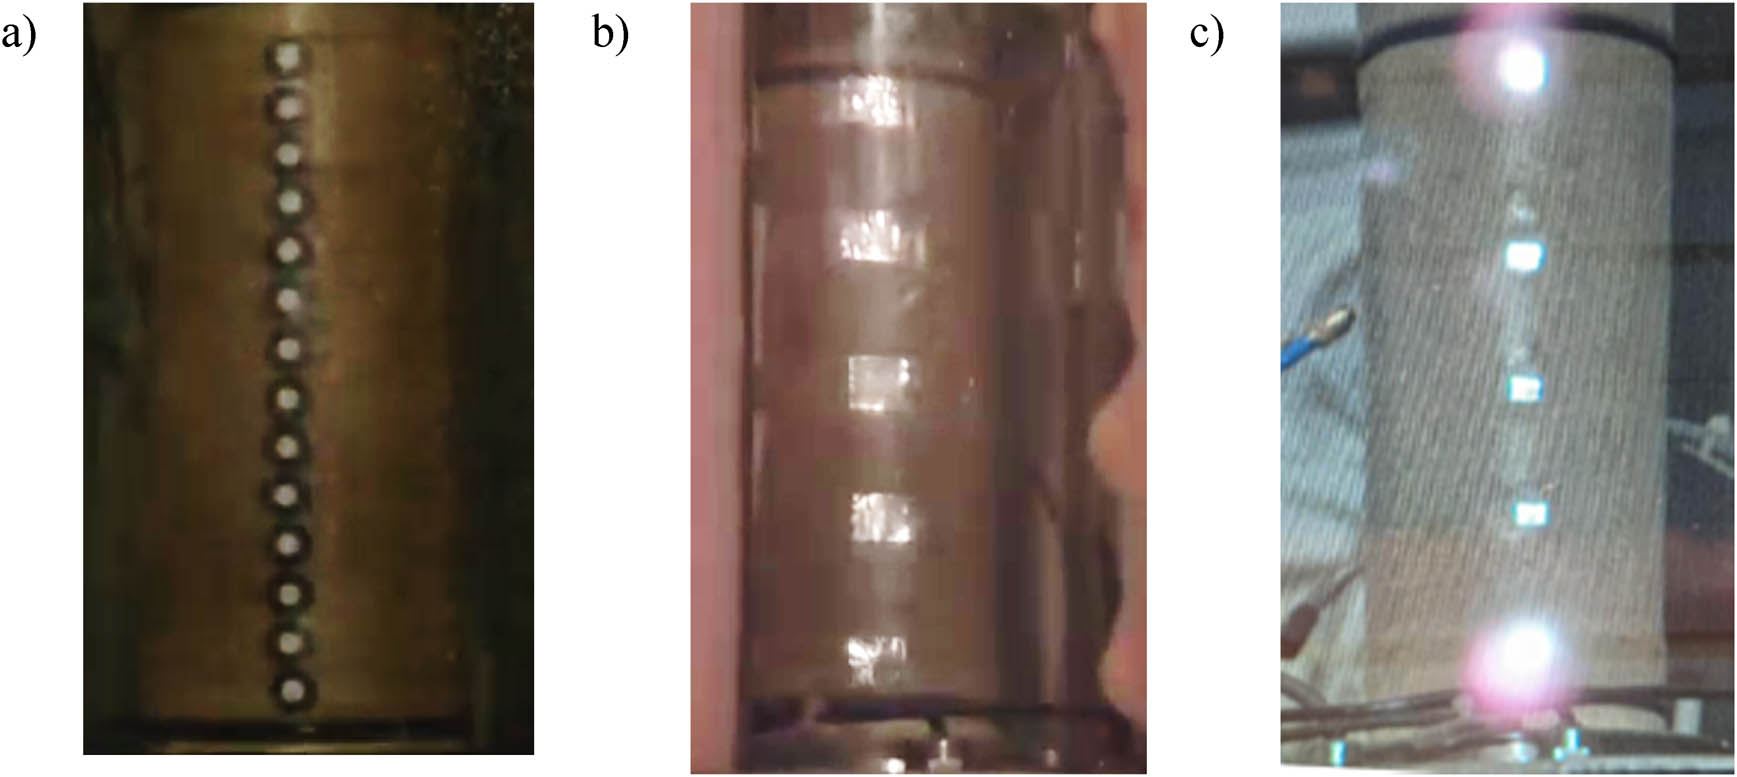
Figure 11
Types of markers tested (film frames): (a) high-contrast round paper discs, (b) aluminium foil squares, and (c) square glass mirrors.
Source: Authors’ contribution.
5.2.2. Reflective foil markers
The aluminium foil markers exhibited significant fluctuations in intensity resulting from changes in the angle of light reflection during vibrations. These fluctuations occasionally generated an apparent movement unrelated to actual displacement, which reduced the reliability of the measurement (Figure 11b).
5.2.3. Markers made from miniature mirrors
Flat markers made from mirrors proved to be the most sensitive to lighting conditions and ambient reflections. Their image changed significantly even with slight changes in angle, causing motion artefacts that were not of a physical nature (Figure 11c).
High-contrast, non-reflective markers proved to be the most suitable for measuring displacements in studies of the RC.
5.3. Measurement sensitivity and uncertainty
The minimum detectable displacement was determined by the spatial resolution of the image and the accuracy of marker tracking. The use of high-speed image capture combined with motion magnification enabled the detection of sub-pixel displacements. However, several sources of measurement uncertainty were identified:
image noise,
variations in lighting,
marker tracking errors,
motion enhancement artefacts,
camera shake.
These factors should be taken into account when interpreting measurement results obtained using image analysis methods.
The displacement amplitudes reported in this study are expressed in image-space coordinates (pixels). However, the obtained values are not restricted to integer pixel increments. The phase-based motion magnification algorithm estimates motion from local phase variations in image intensity and therefore operates in the sub-pixel domain. Consequently, the reconstructed marker trajectories may exhibit displacement amplitudes significantly smaller than one pixel, including values on the order of hundredths of a pixel. It should be emphasized that these values represent numerical estimates of motion obtained through image processing and signal analysis rather than direct measurements of geometric pixel shifts. The actual sensitivity of the method depends on several factors, including image quality, signal-to-noise ratio, marker characteristics, illumination conditions, and the selected filtering parameters.
No dedicated calibration procedure was performed to determine the absolute displacement resolution or measurement uncertainty of the optical measurement system. Therefore, the reported displacement amplitudes should be interpreted primarily as quantities suitable for comparative analysis of vibration modes, displacement distributions, and resonance frequencies rather than as metrologically validated measurements of absolute displacement.
5.4. Significance for studies in the resonant column
The results indicate that the testing equipment may exhibit measurable deformation during operation, which could potentially affect the strain values attributed to the specimen. The observations suggest that:
actual boundary conditions may differ from ideal assumptions,
instrument sensitivity should be taken into account when interpreting results,
image-based motion analysis is a valuable diagnostic tool.
The combination of motion magnification techniques with marker tracking provides a practical tool for assessing the mechanical behaviour of RC systems and identifying potential sources of measurement uncertainty.
5.5. Limitations of the method
The proposed imaging method provides valuable qualitative and quantitative information regarding the deformation pattern in RC studies; however, several significant limitations should be noted.
First, the accuracy of the analysis depends on appropriate time sampling. Despite the use of a camera operating at 1,000 frames per second, the analysed frequency range of 150–250 Hz corresponds to only four to seven frames per vibration cycle. The limited number of samples per cycle may affect the accuracy of the time-domain representation and the precision of the frequency estimation.
Second, the Eulerian motion magnification method is based on the assumption of small displacements and a linear relationship between changes in image intensity. If the amplification is too high, artefacts and spatial distortions may occur. The use of a modified Euler method, based on phase amplification of signals, largely eliminates these drawbacks, but the results remain sensitive to the choice of filtering parameters, in particular the spatial smoothing parameter σ and the frequency bandwidth. Higher values of σ improve signal stability but lead to spatial averaging and a reduction in local displacement gradients.
Another limitation is that the quality of the measurement depends on the amplitude of the displacements. In areas close to the mounting points, where the amplitudes are very small, the signal-to-noise ratio deteriorates, which increases the uncertainty in determining displacements and identifying frequencies. Although both horizontal and vertical marker movements could be observed in the recorded image sequences, only the horizontal component was analysed quantitatively. The vertical displacements were considerably smaller than the horizontal ones and remained close to the noise level of the measurement system, making their reliable interpretation difficult under the adopted experimental conditions.
The method is also sensitive to lighting conditions. Reflective markers can produce apparent displacements resulting from changes in light intensity rather than actual movement. The most reliable results are obtained with high-contrast markers that have a matt surface.
Another important aspect is the interaction between the specimen and the testing apparatus. The assumption of a perfectly rigid mounting is not fully met, and the recorded response may include components resulting from the flexibility of the base and vibrations in the apparatus structure. Consequently, the observed displacement distribution may deviate from the ideal fixed–free model.
Finally, this method allows for the measurement of surface displacements rather than deformations directly. Determining the strain field requires additional assumptions regarding the continuity of the displacement field and an appropriate density of marker placement. Furthermore, fully separating the deformation of the specimen from the vibrations of the apparatus would require the use of independent reference measurements.
Despite these limitations, the method is an effective, non-contact diagnostic tool that enables the visualization of deformations and the identification of the influence of instrumentation on the dynamic response in RC studies.
6. Summary and conclusions
This article presents a method for analysing deformation in experiments conducted in a RC, based on high-speed image recording, motion magnification, and surface marker tracking. The proposed approach enables non-contact visualization and quantitative assessment of sub-pixel displacements in soil samples subjected to harmonic excitation.
The results obtained confirm that the amplitude of horizontal displacements increases with the height of the specimen, which is consistent with the theoretical behaviour of a fixed-free system. At the same time, it was shown that the amplitude distribution deviates from the ideal model, which can be attributed to the flexibility of the base, the interaction between the specimen and the apparatus, and the spatial smoothing effect.
A key finding of this study is the identification of vibrations in the structural components of the testing apparatus. It has been demonstrated that the apparatus has its own dynamic response, which may affect the recorded displacements, particularly in the lower part of the specimen. This means that the testing setup should be treated as a coupled system, rather than an ideally isolated specimen.
The analysis also revealed that the choice of image processing parameters has a significant impact. In particular, the spatial smoothing parameter σ is crucial for the stability and interpretability of the results. A setting of σ = 15 provides the best balance between noise reduction and the preservation of the physical characteristics of the vibrations.
The results of the study confirm that the motion magnification technique, combined with marker tracking, is an effective tool not only for visualizing vibration modes, but also for the quantitative analysis of displacements and for identifying the influence of equipment on measurement results. This method can be used as a diagnostic tool for assessing boundary conditions and measurement uncertainty in laboratory geotechnical testing.
In further research, it is advisable to increase the temporal resolution of the measurements, integrate independent reference sensors, and develop the method to enable a comprehensive analysis of deformations and a quantitative assessment of measurement uncertainty. Future work should include a dedicated calibration procedure allowing the quantitative assessment of displacement resolution and measurement uncertainty of the proposed optical method.
Funding information
The authors state no funding involved.
Author contributions
Marcin Bujko: Conceptualization, methodology, investigation, visualization, data curation, and writing – original draft. Piotr E. Srokosz: Conceptualization, methodology, formal analysis, validation, writing – review and editing, and supervision.
Conflict of interest statement
The authors declare that there are no competing financial interests or personal relationships that could have appeared to influence the work reported in this paper.
Ethics approval
Not applicable: the work involves no human participants, animals or proprietary datasets.
Data availability statement
All data generated or analysed during this study are available from the authors upon reasonable request.