
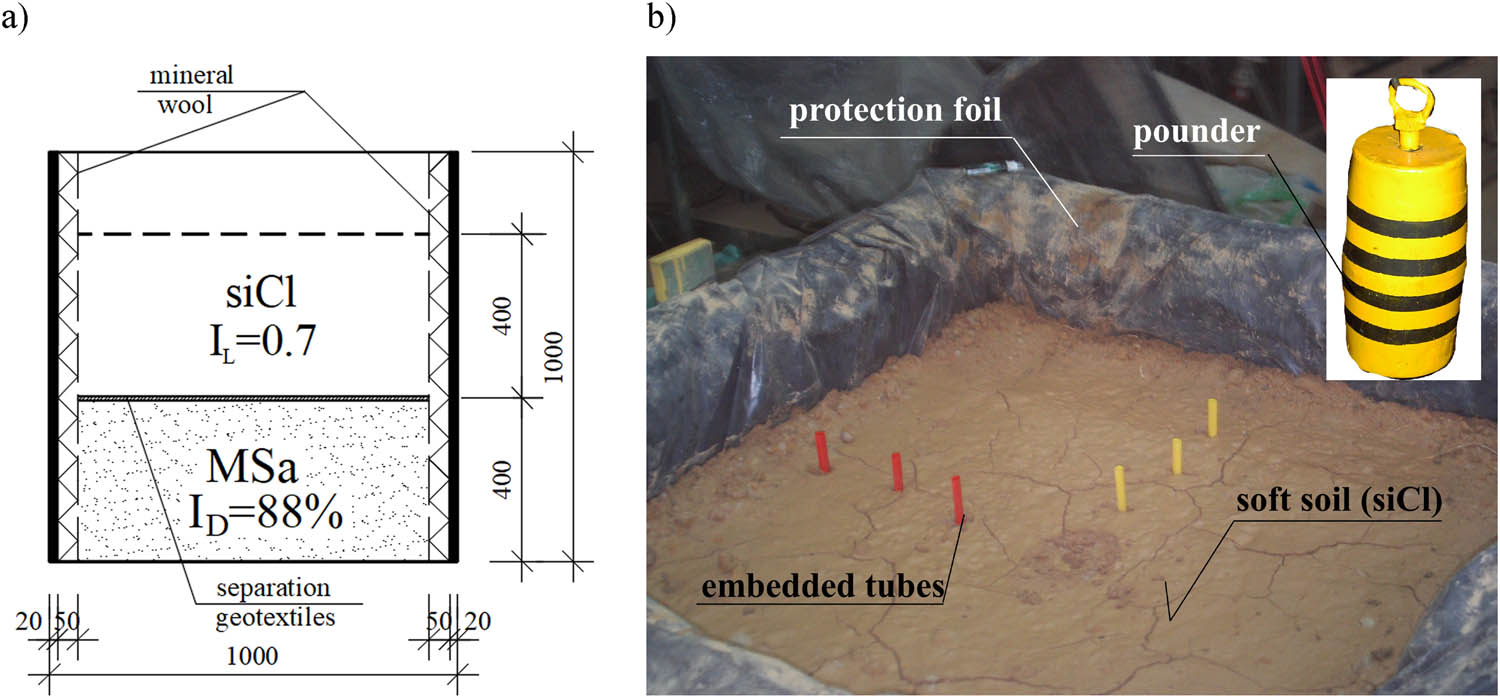
Figure 1
Test bench: (a) vertical cross section and (b) prepared soil layers with embedded tubes for horizontal displacement monitoring and applied pounder, [13].
Source: Authors’ contribution.
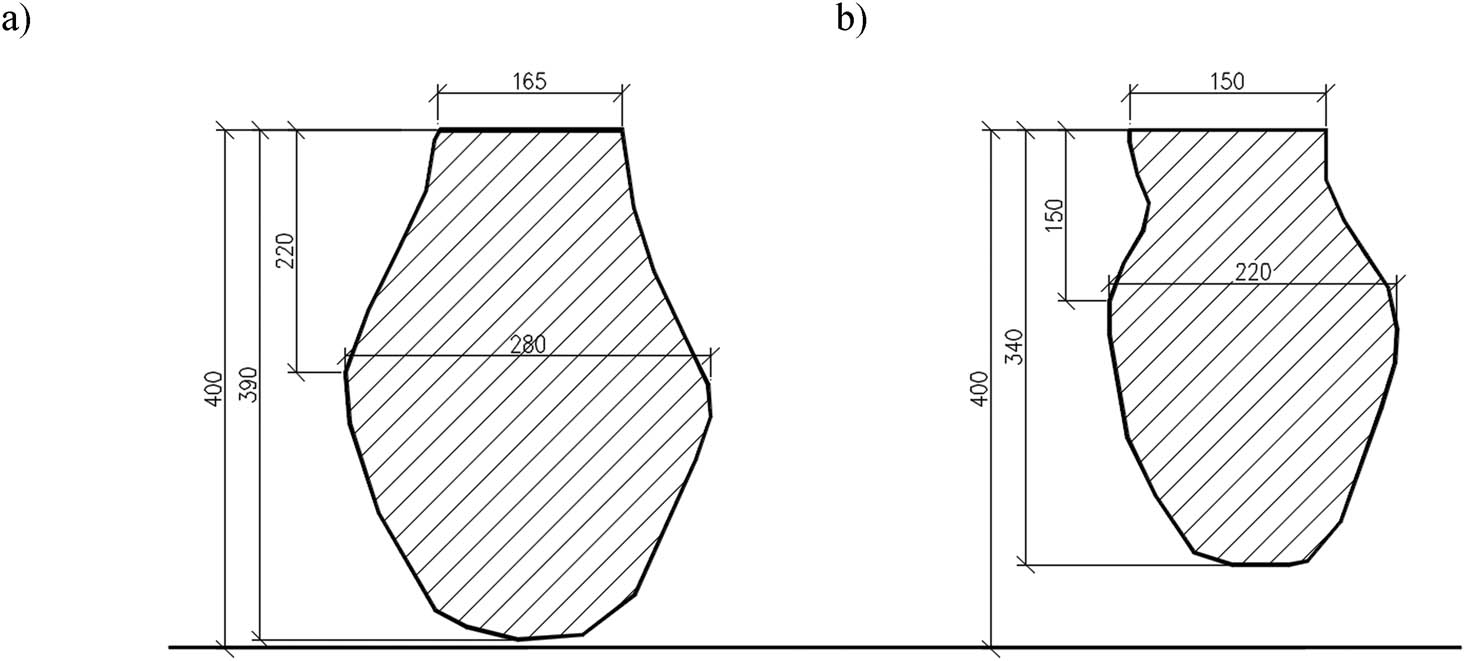
Figure 2
Inventoried shape of the columns: (a) No. 1, (b) No. 2, [13].
Source: Authors’ contribution.
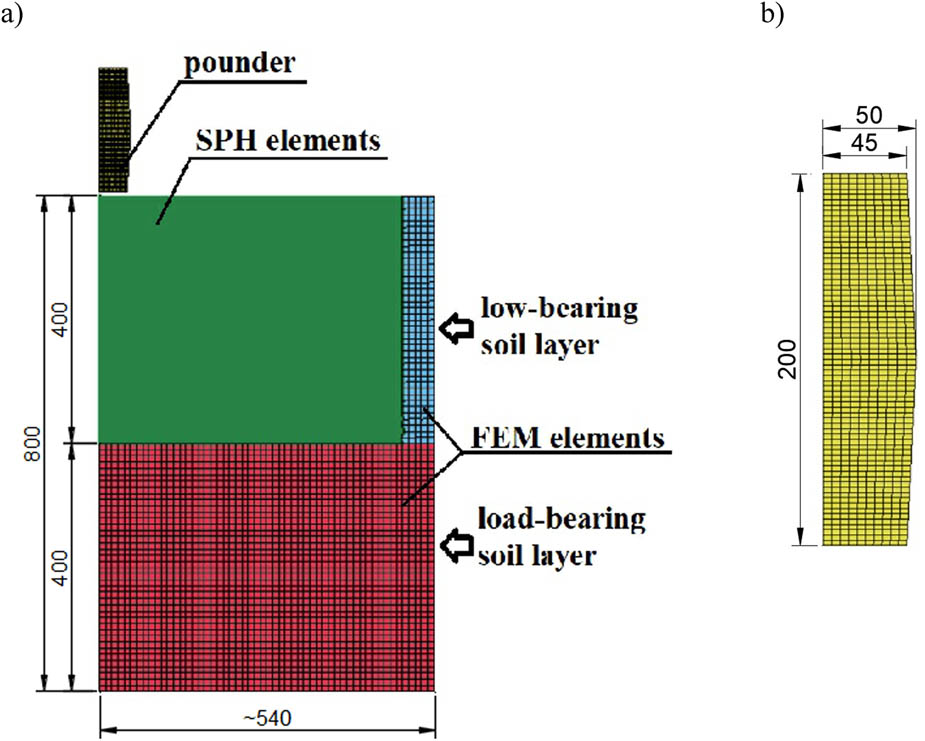
Figure 3
Numerical model (FEM + SPH II, III) (a), modelled pounder, (b).
Source: Authors’ contribution.
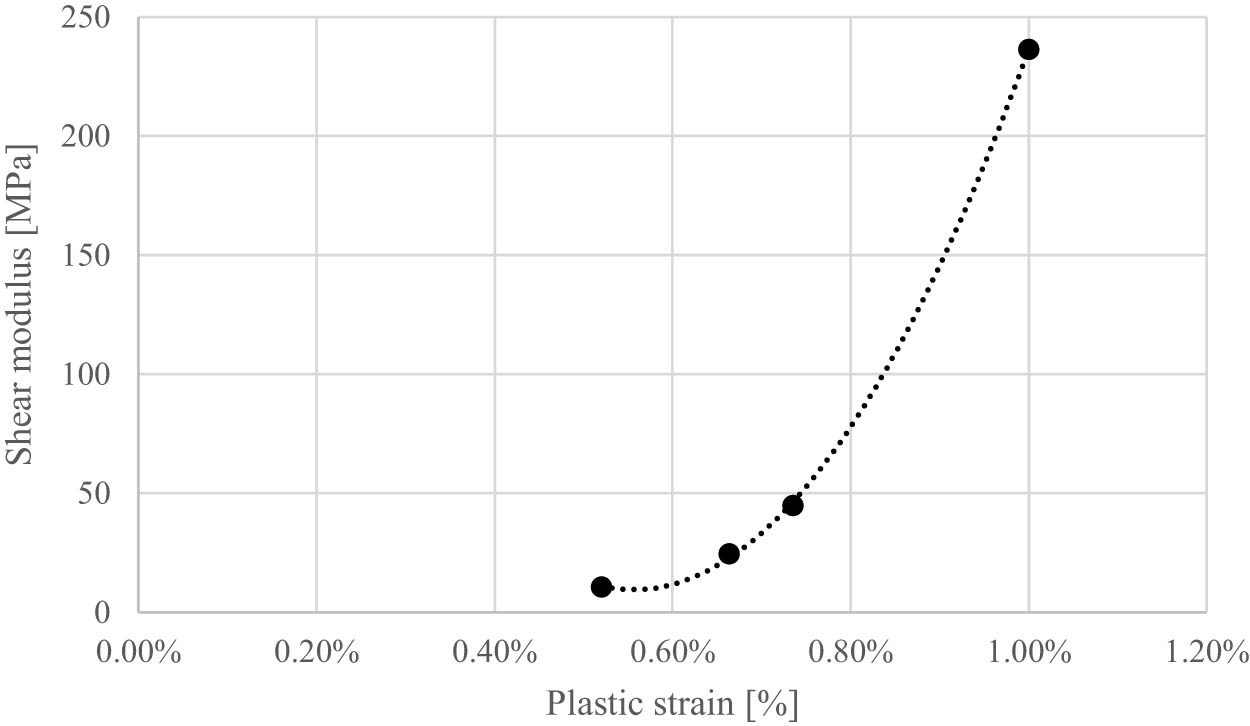
Figure 4
Increase in column material stiffness.
Source: Authors’ contribution.
Table 1
Adopted constitutive models and their parameters.
| No. | Element | Constitutive model | Model parameters |
|---|---|---|---|
| 1. | Pounder | 020-Rigid (model nomenclature in accordance with the ANSYS LS-DYNA conventions) | E = 210 GPa, ν = 0.3, γ = 74 kN/m3 |
| 2. | Base layer | 173-Mohr-Coulomb | G = 41.7 MPa, φ′ = 33°, c′ = 0 kPa, ν = 0.2, γ = 18 kN/m3 |
| Medium sand, I D = 88% | |||
| 3. | Improved layer | 173-Mohr-Coulomb | G = 1.39 MPa, Su = 10.2 kPa, ν = 0.31, γ = 18.7 kN/m3 |
| Silty clay I L = 0.7 | |||
| 4. | DR column aggregates | 173-Mohr-Coulomb | G = 6.86 MPa (FEM + SPH II), φ′ = 47°, c′ = 0 kPa, ν = 0.2 |
| γ = 18 kN/m3 | |||
| G = 3.43 – 236 MPa (FEM + SPH III – Figure 4) | |||
| 5. | Pounder contact elements – SPH elements | N/A | FS = 0.5 |
| FD = 0.4 |
Source: Authors’ contribution.
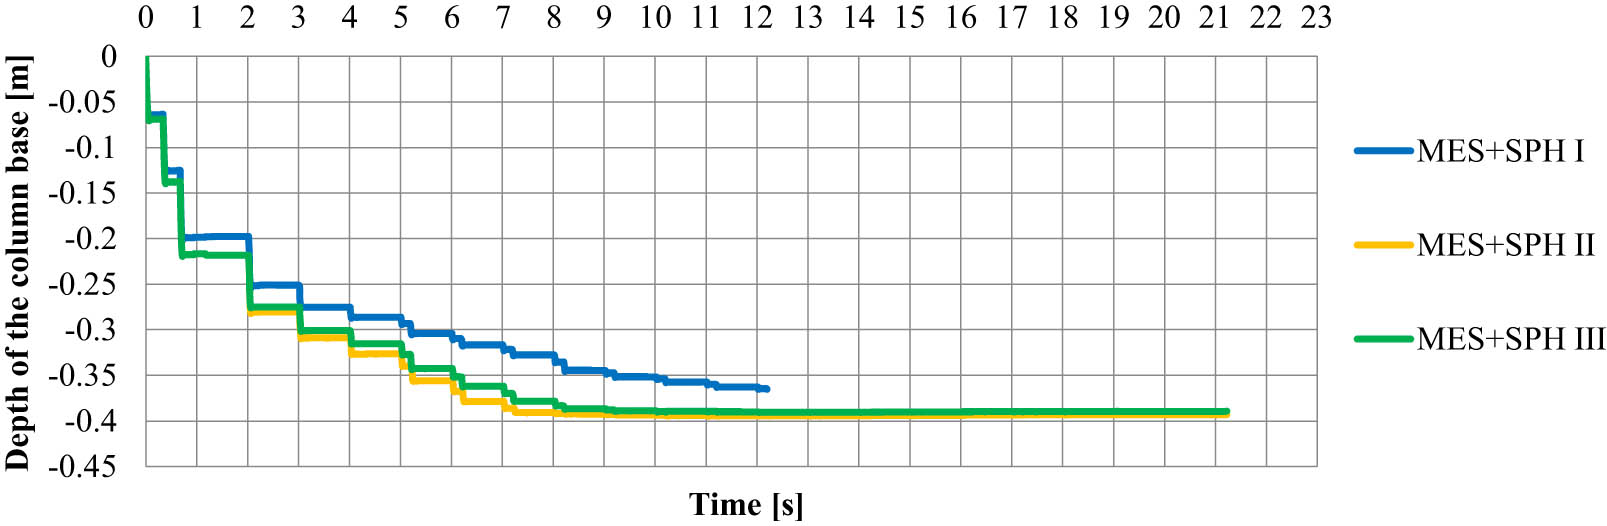
Figure 5
Diagram of vertical displacements of the SPH element occurring directly under the base of the column (the first discharge into the aggregate after 2 s, preceded by three discharges forming the crater).
Source: Authors’ contribution.
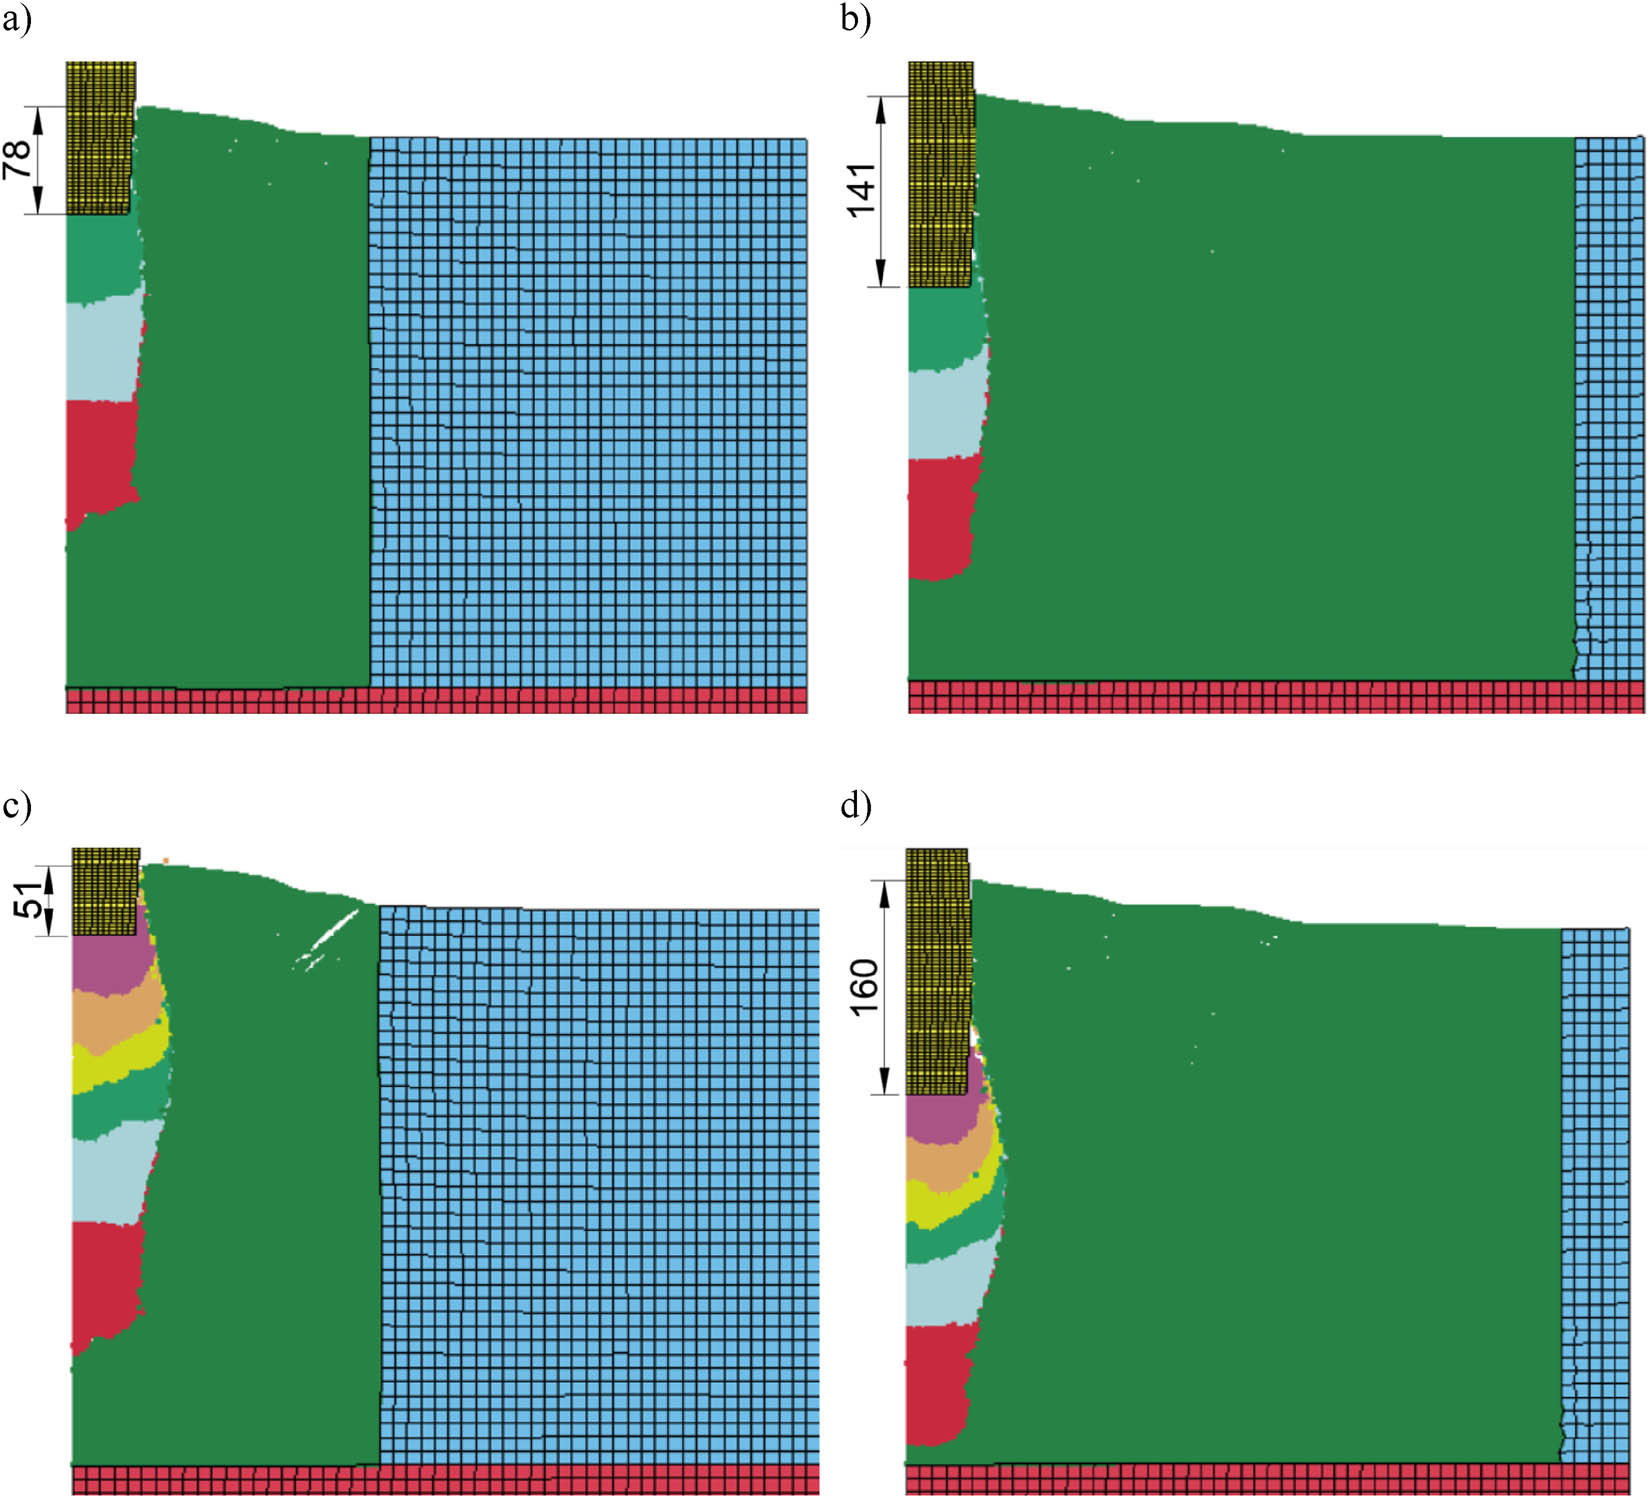
Figure 6
View of the model after the pounder blow in: (a) 3 charges – FEM + SPH I [12], (b) 3 charges – FEM + SPH II, (c) 6 charges – FEM + SPH I [12], (d) 6 charges – FEM + SPH II.
Source: Authors’ contribution.
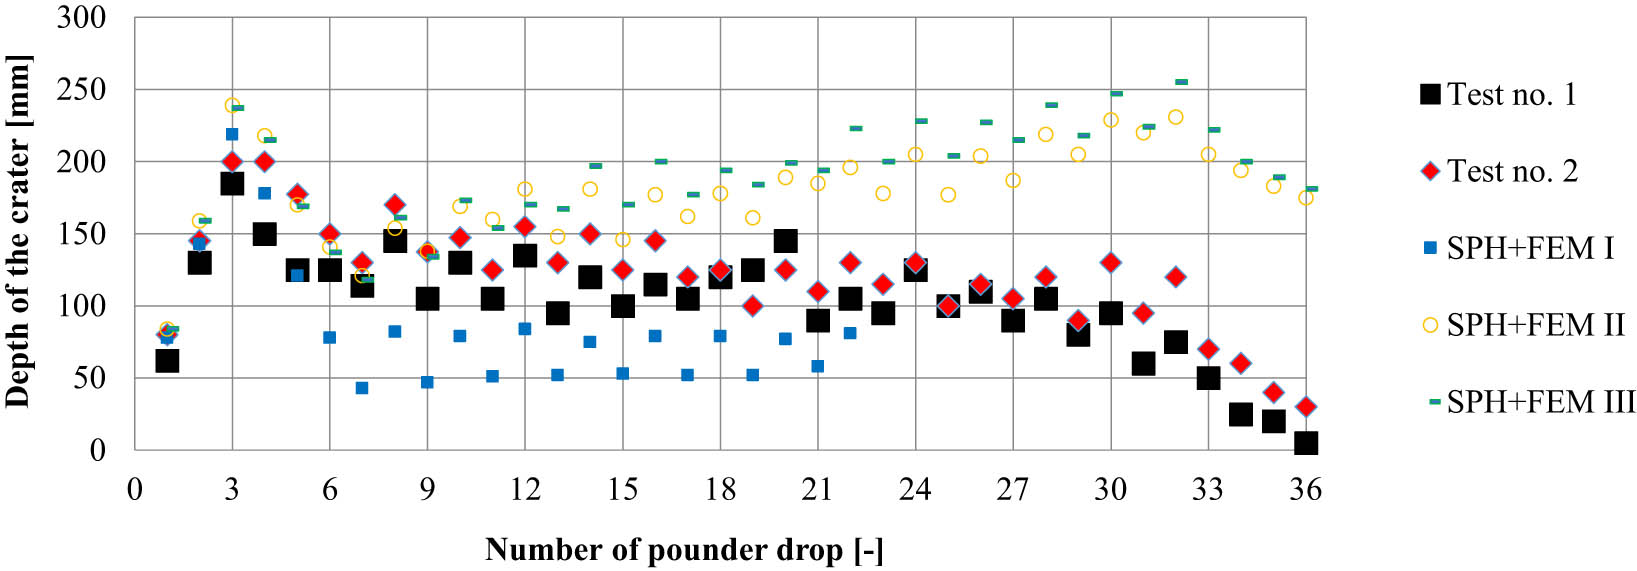
Figure 7
Comparison of the depth of the crater obtained in laboratory tests and SPH + FEM calculations.
Source: Authors’ contribution.
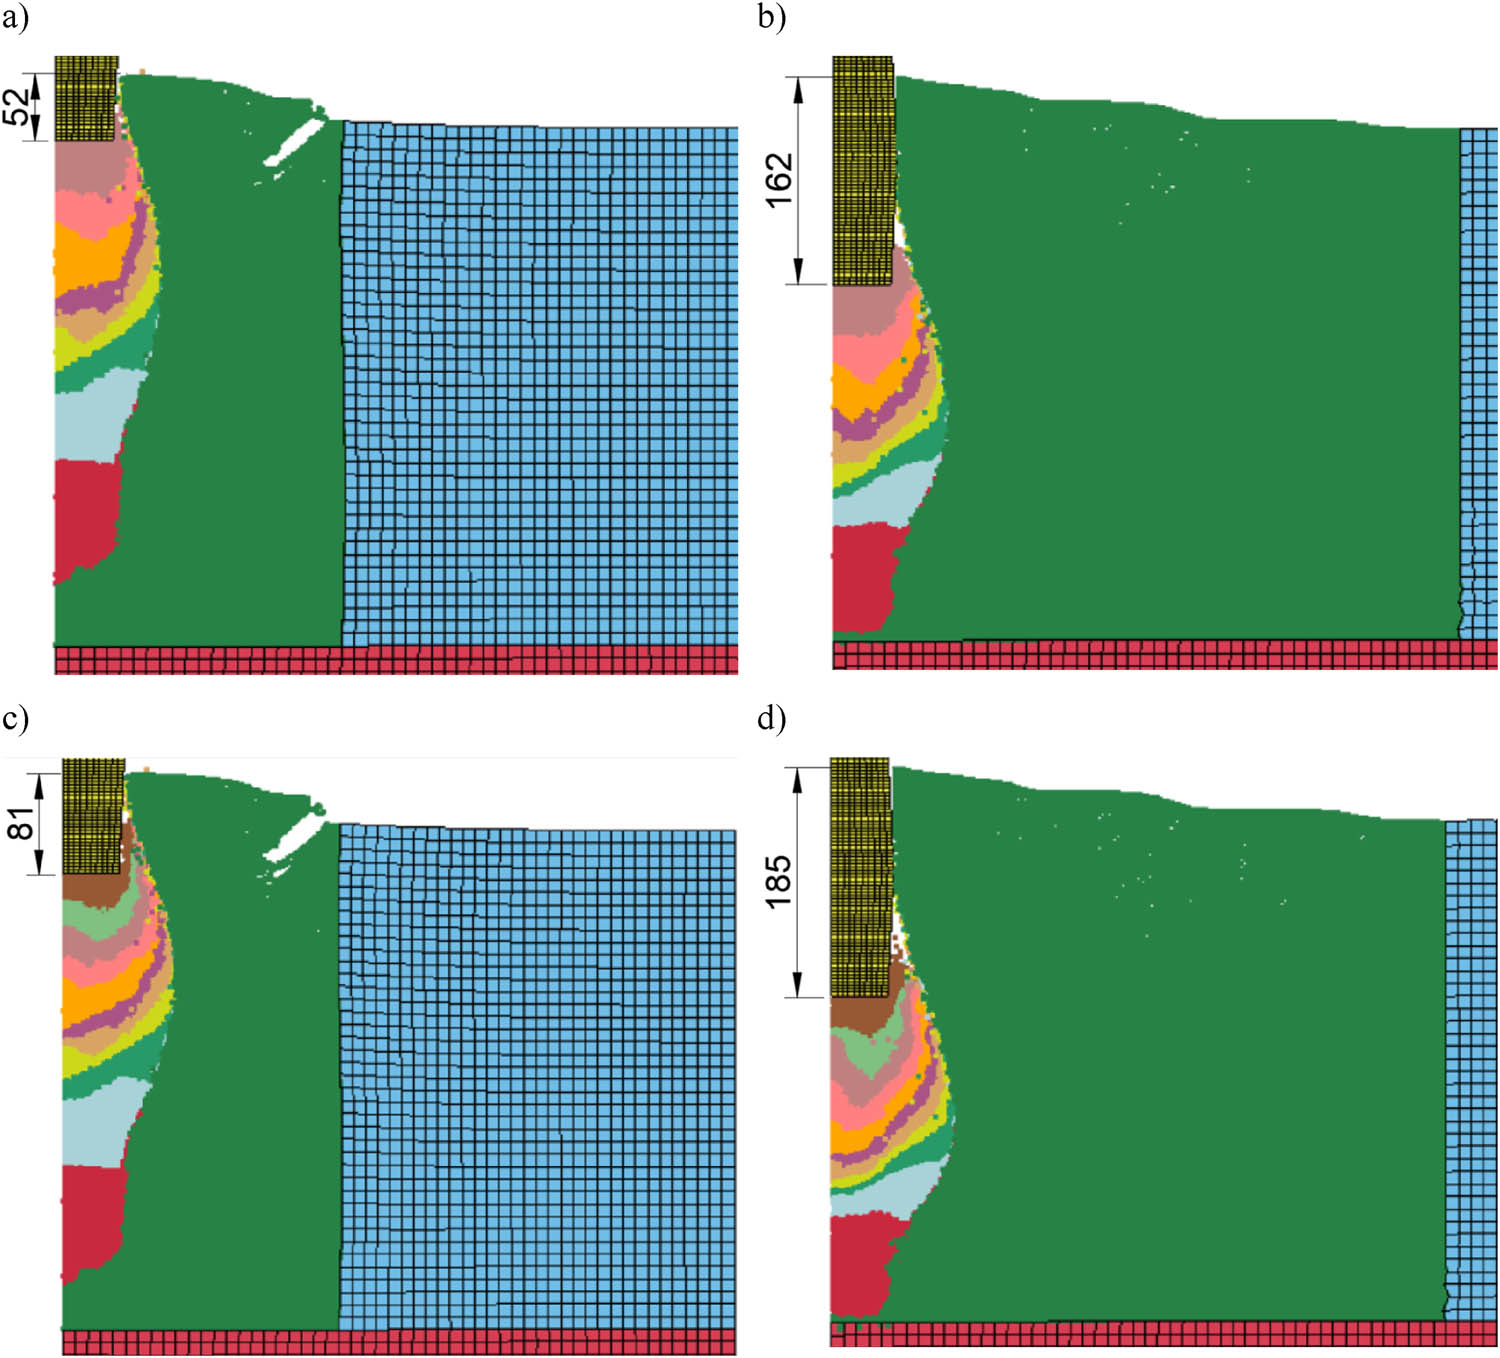
Figure 8
View of the model after the pounder blow in: (a) 9 charges – FEM + SPH I [12], (b) 9 charges – FEM + SPH II, (c) 11 charges – FEM + SPH I [12], (d) 11 charges – FEM + SPH II.
Source: Authors’ contribution.
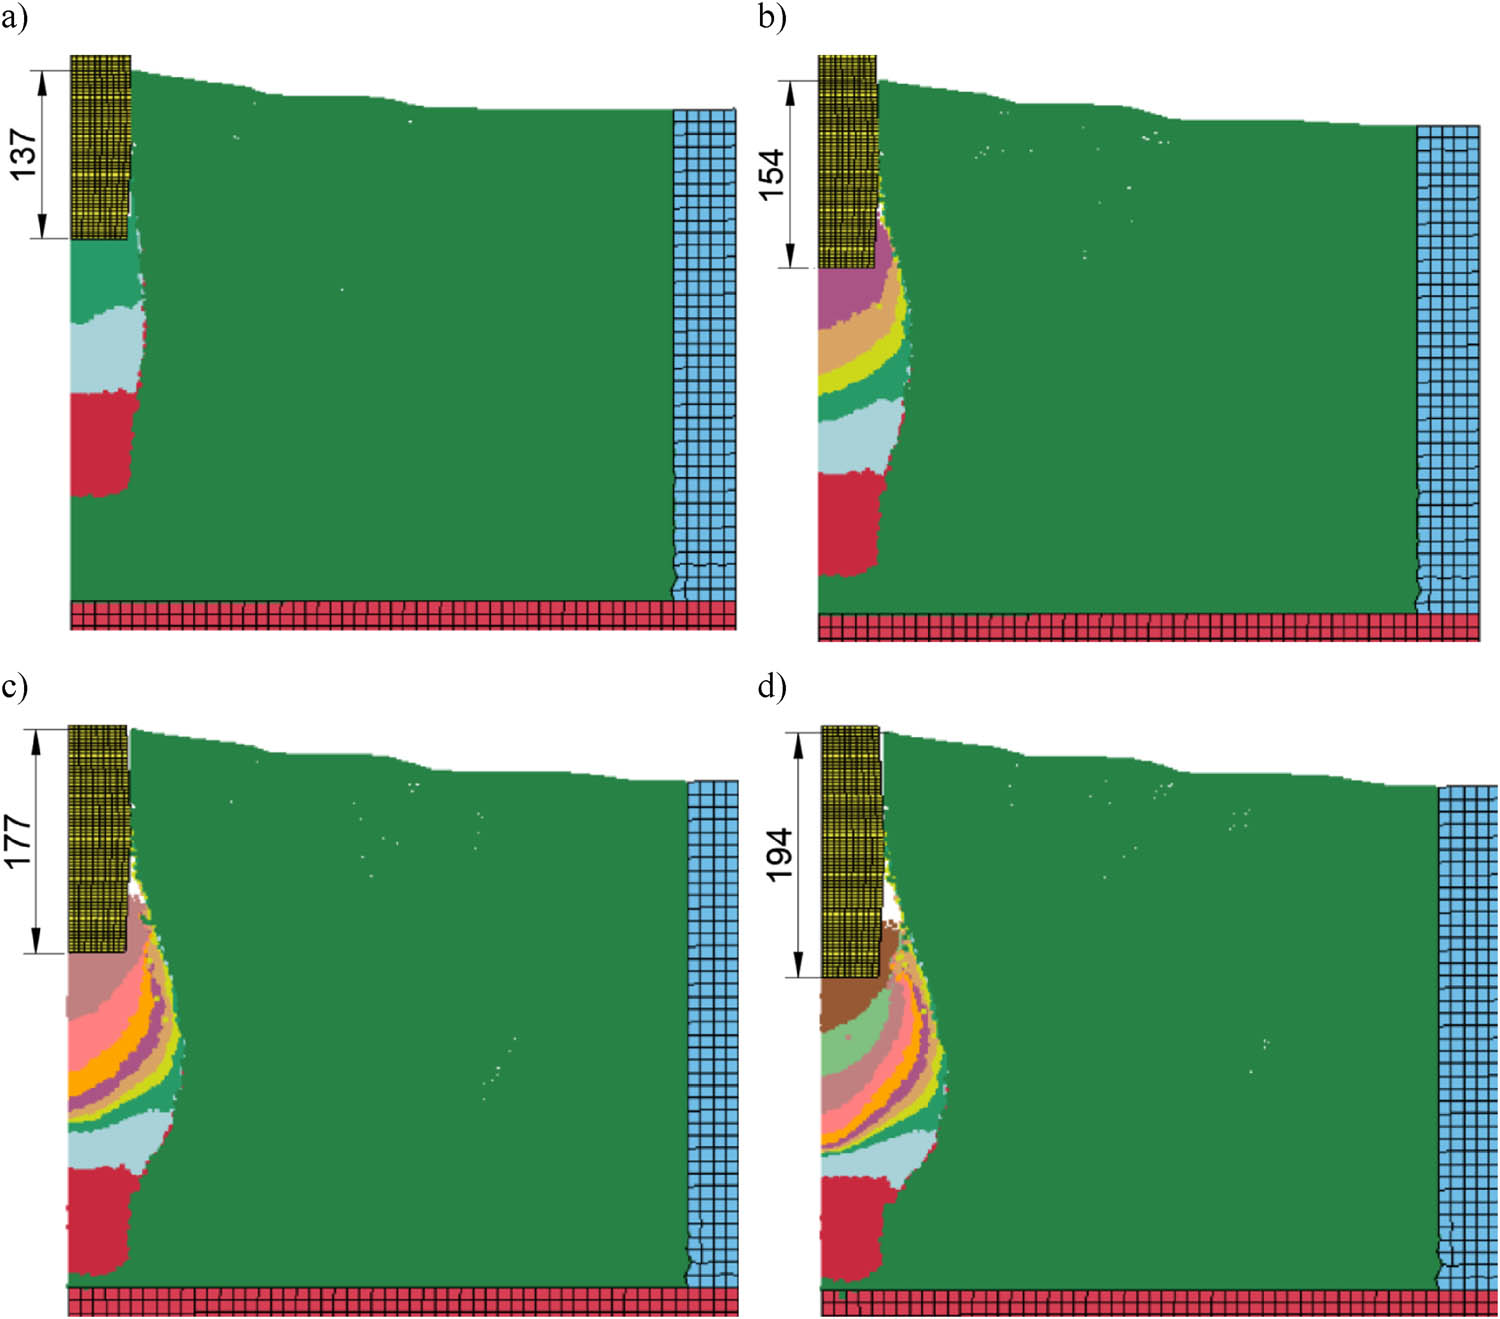
Figure 9
View of the model FEM + SPH III after the pounder blow in: (a) 3 charges, (b) 6 charges, (c) 9 charges, and (d) 11 charges.
Source: Authors’ contribution.
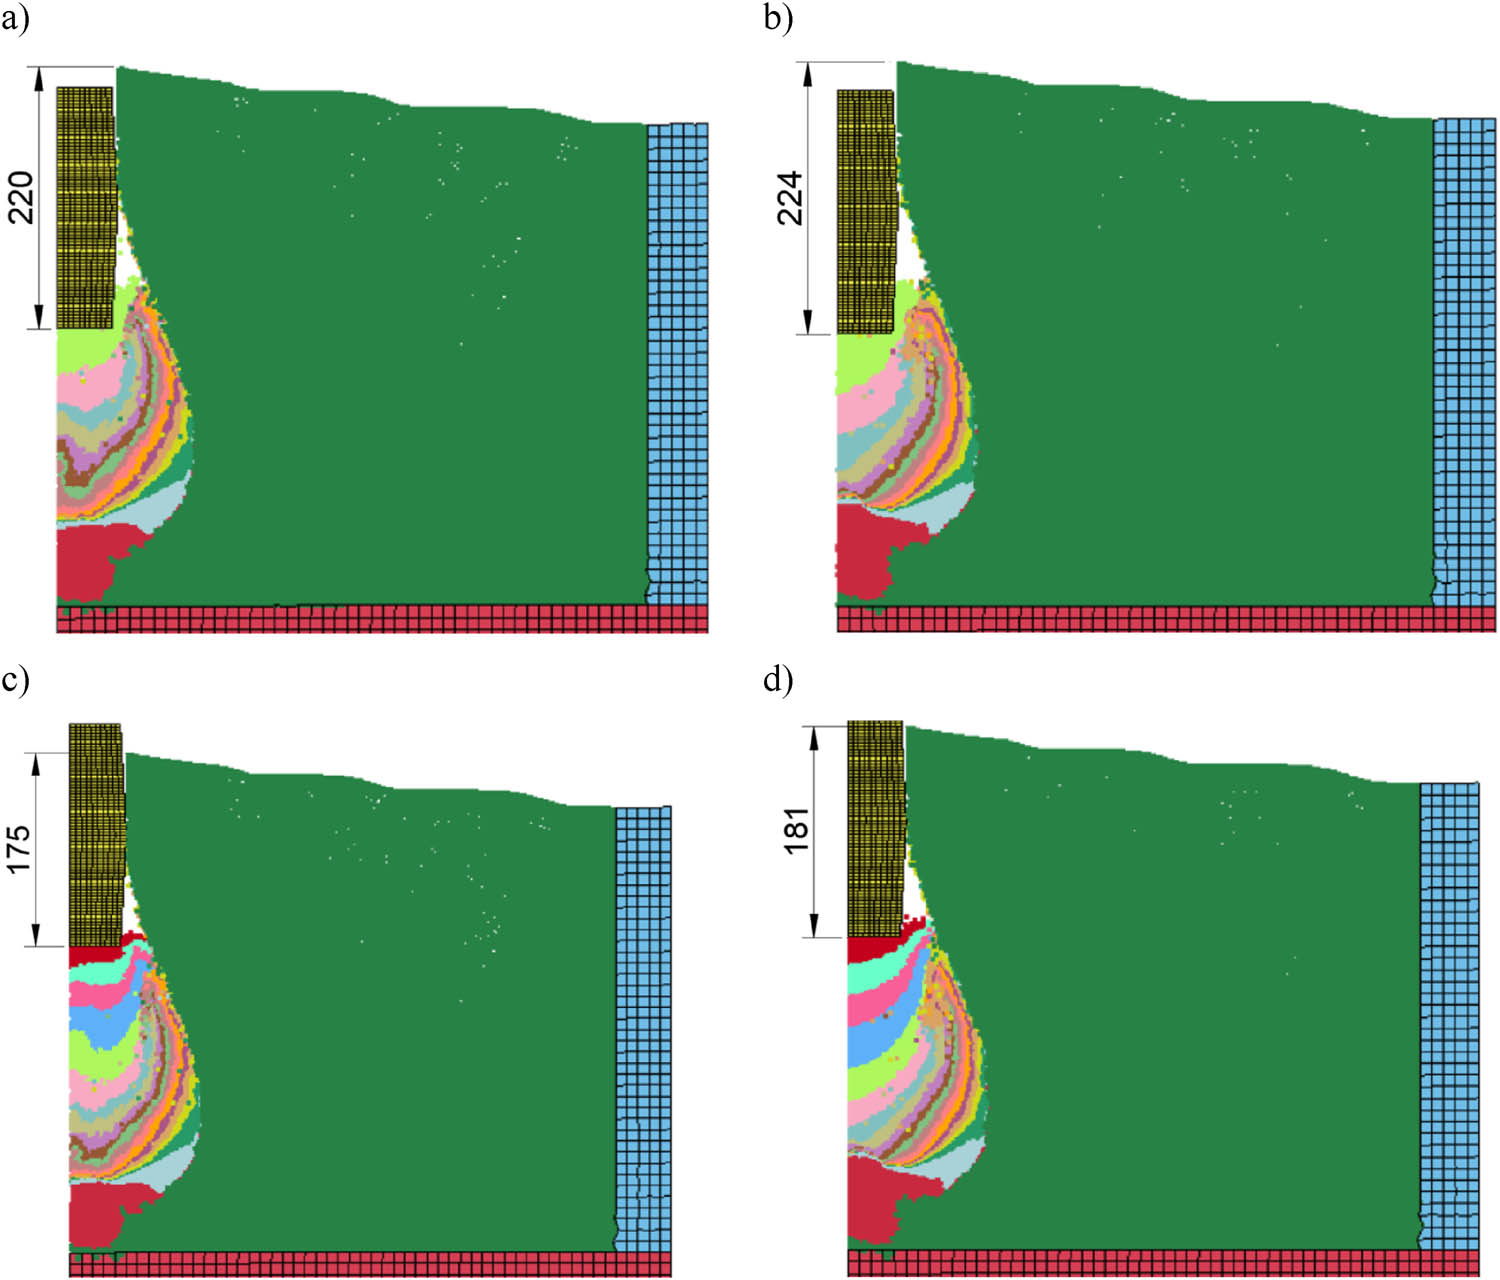
Figure 10
View of the model after the pounder blow in: (a) 16 charges – FEM + SPH II, (b) 16 charges – FEM + SPH III, (c) 20 charges – FEM + SPH II, (d) 20 charges – FEM + SPH III.
Source: Authors’ contribution.
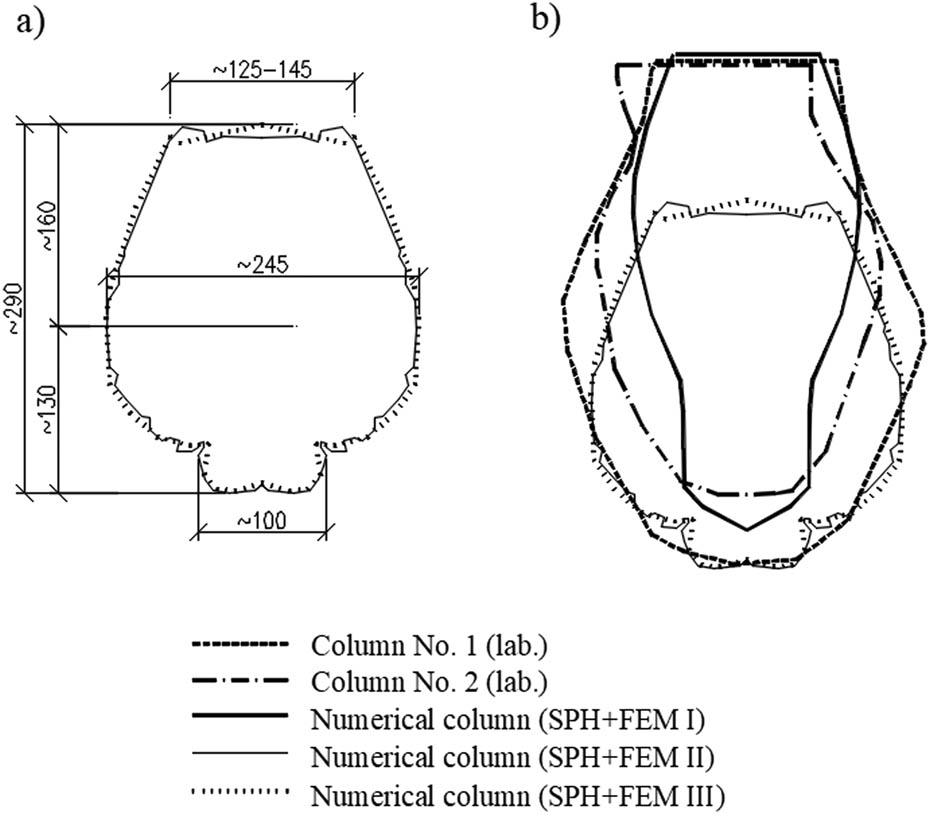
Figure 11
Shapes of the obtained columns: (a) numerical column (SPH + FEM II, III) and (b) comparison of shapes: numerical and laboratory.
Source: Authors’ contribution.
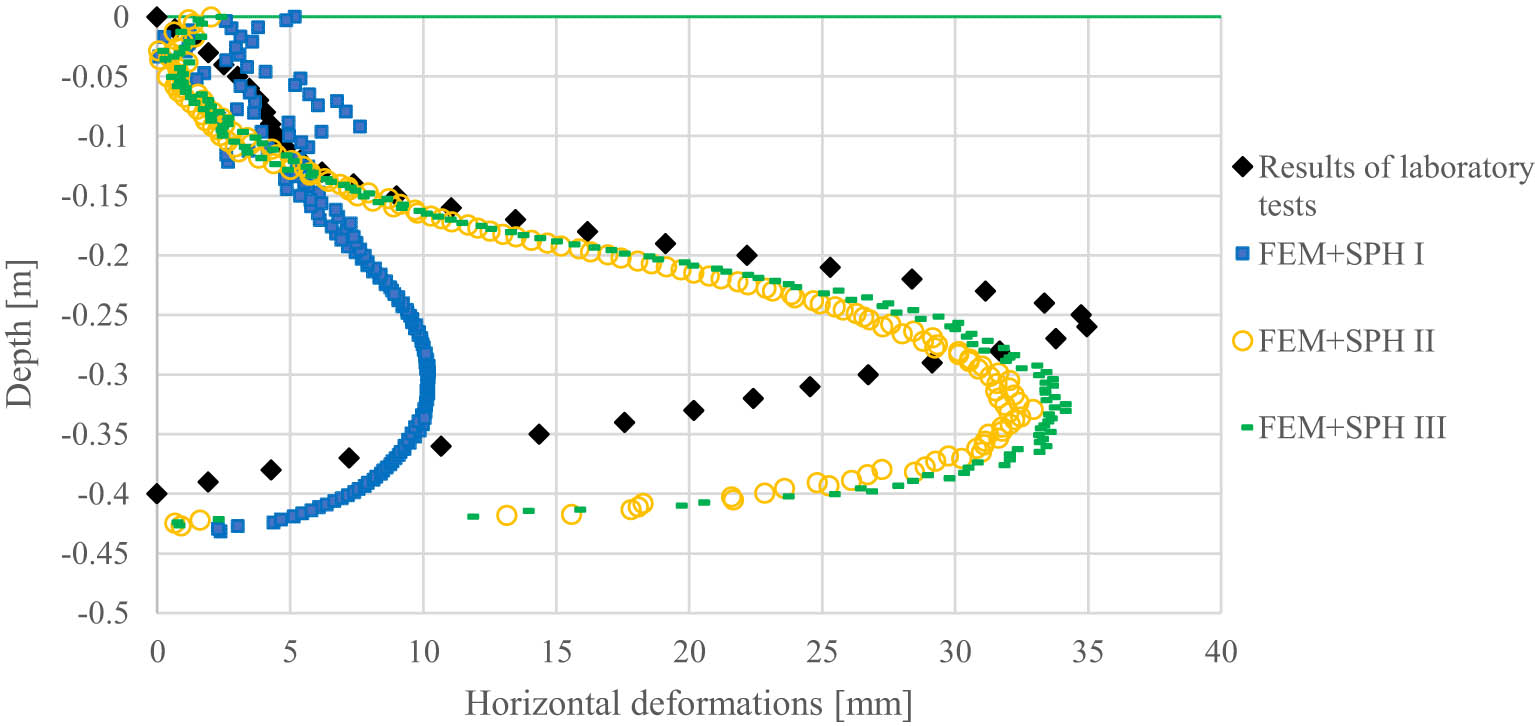
Figure 12
Horizontal displacement at a distance of 150 mm from the column axis.
Source: Authors’ contribution.
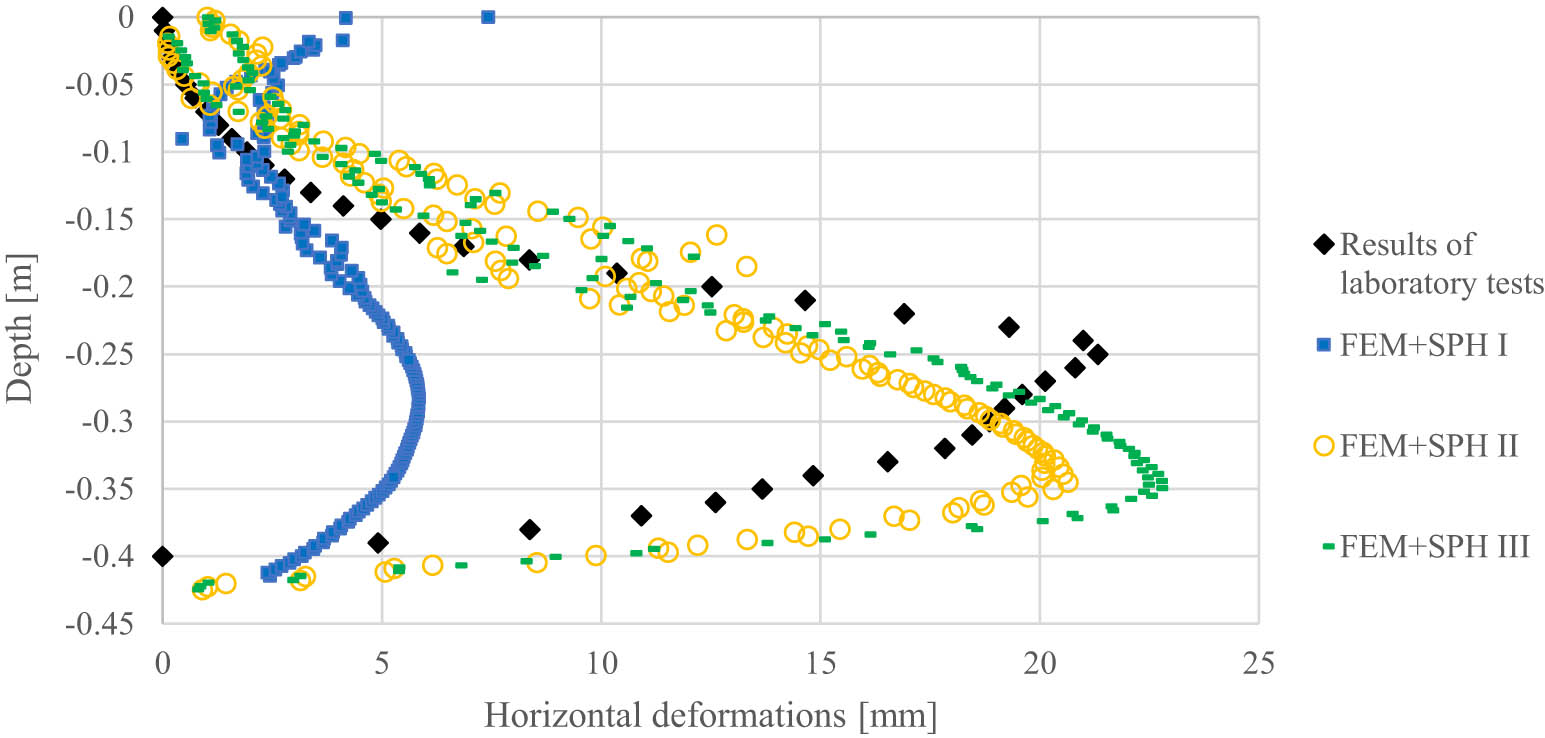
Figure 13
Horizontal displacement at a distance of 200 mm from the column axis.
Source: Authors’ contribution.
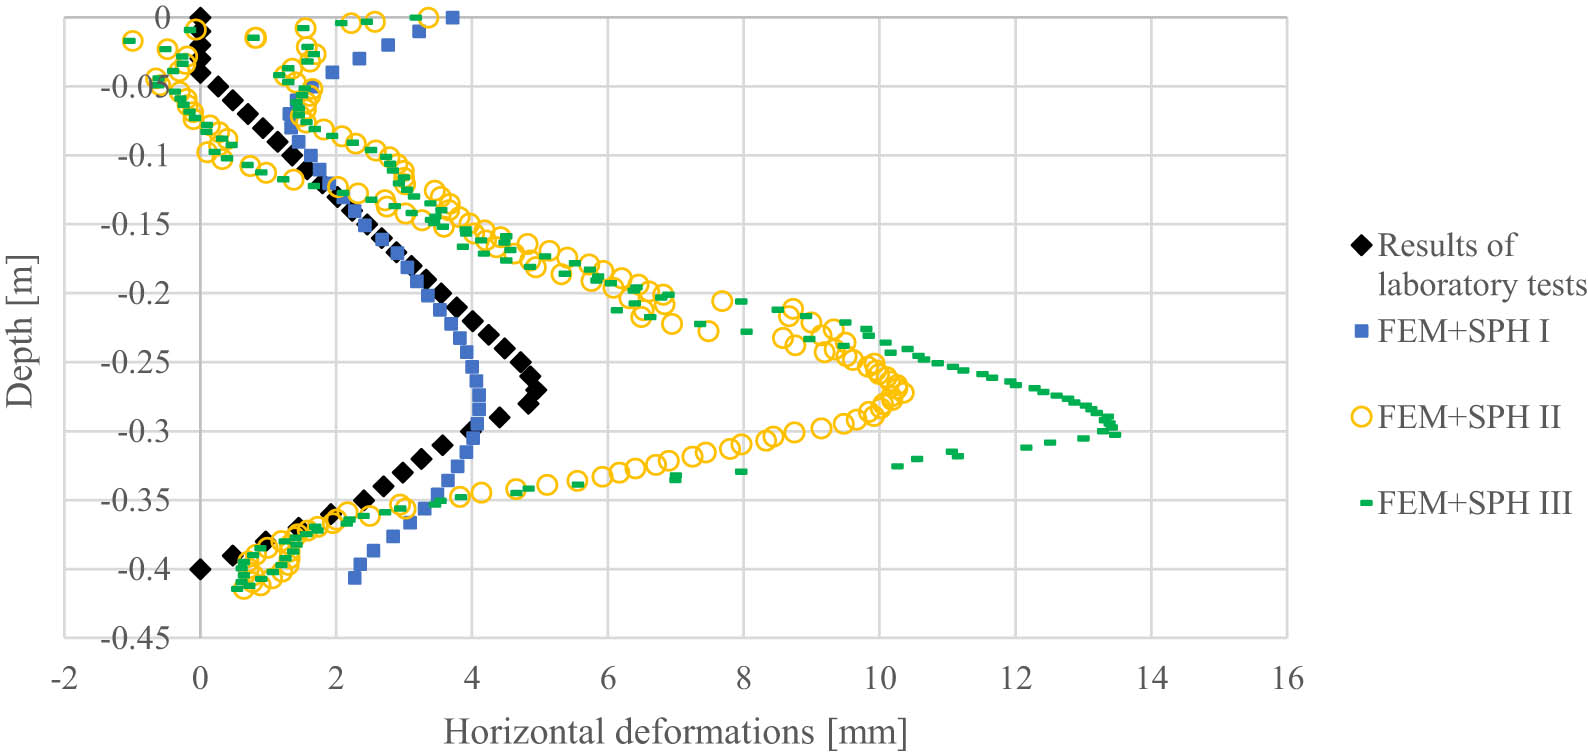
Figure 14
Horizontal displacement at a distance of 275 mm from the column axis.
Source: Authors’ contribution.
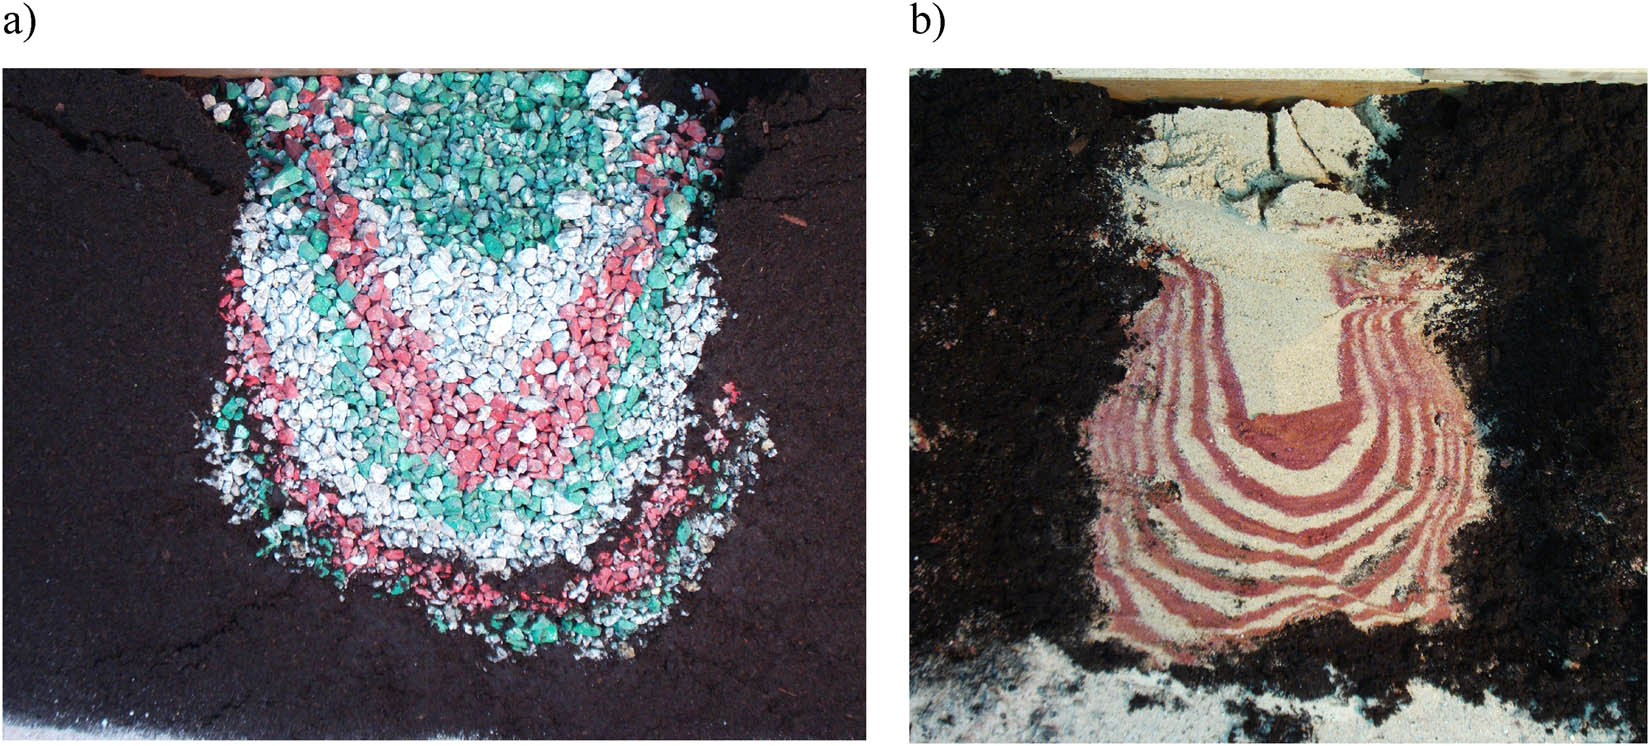
Figure 15
Vertical cross-section through a column formed (in peat) from 0 to 10 mm crushed aggregate (a) and medium sand (b).
Source: Authors’ contribution.