
Figure 1
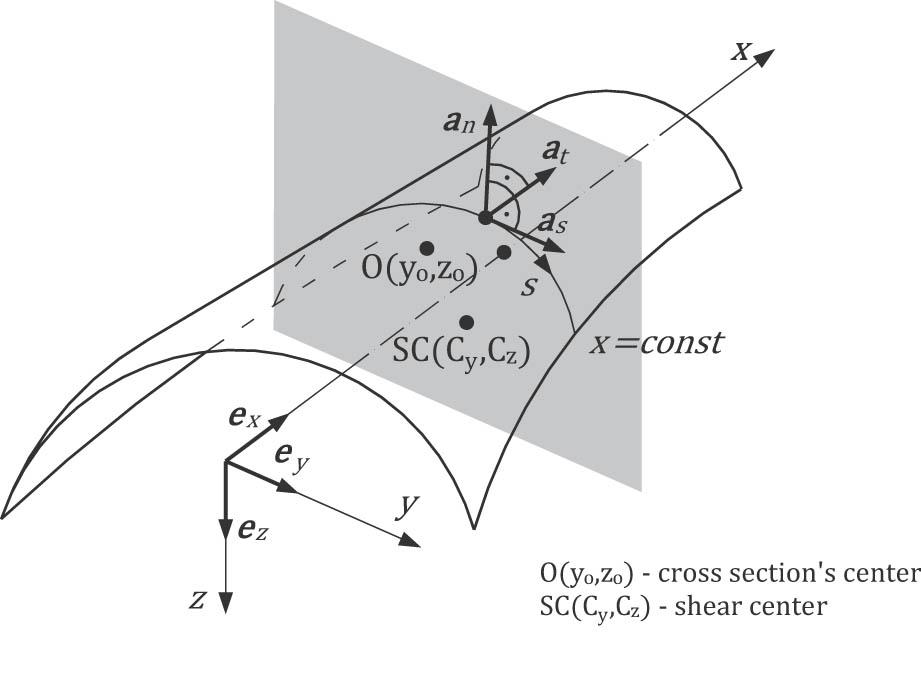
Figure 2
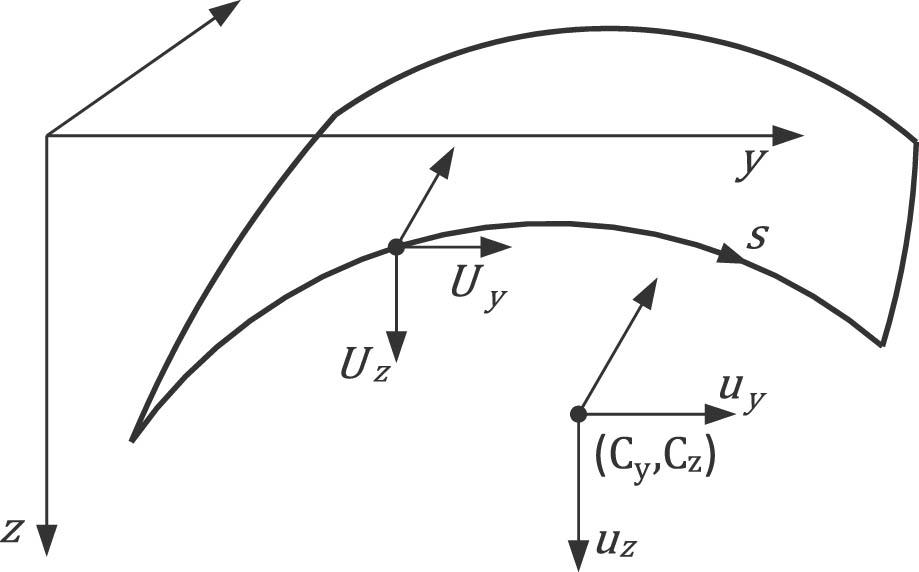
Figure 3
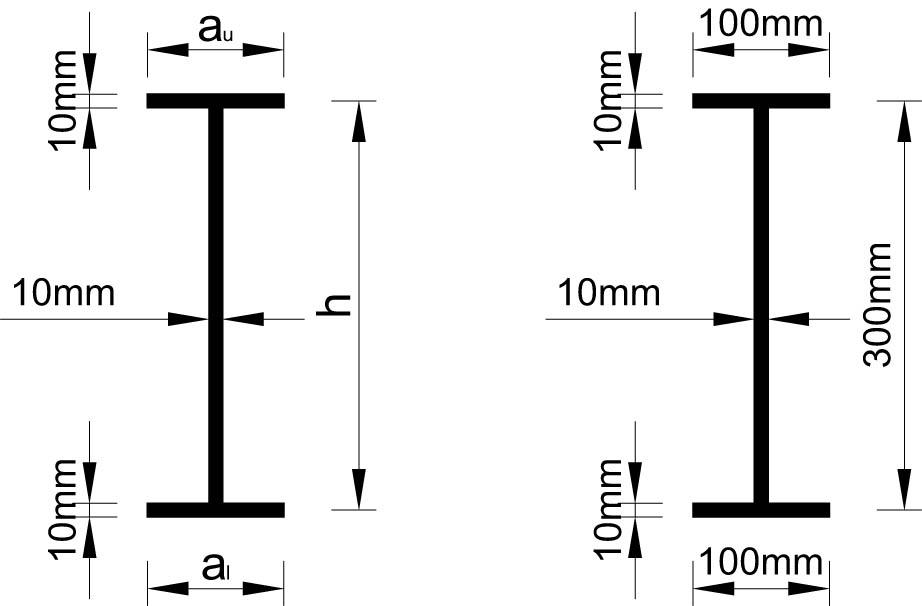
Figure 4
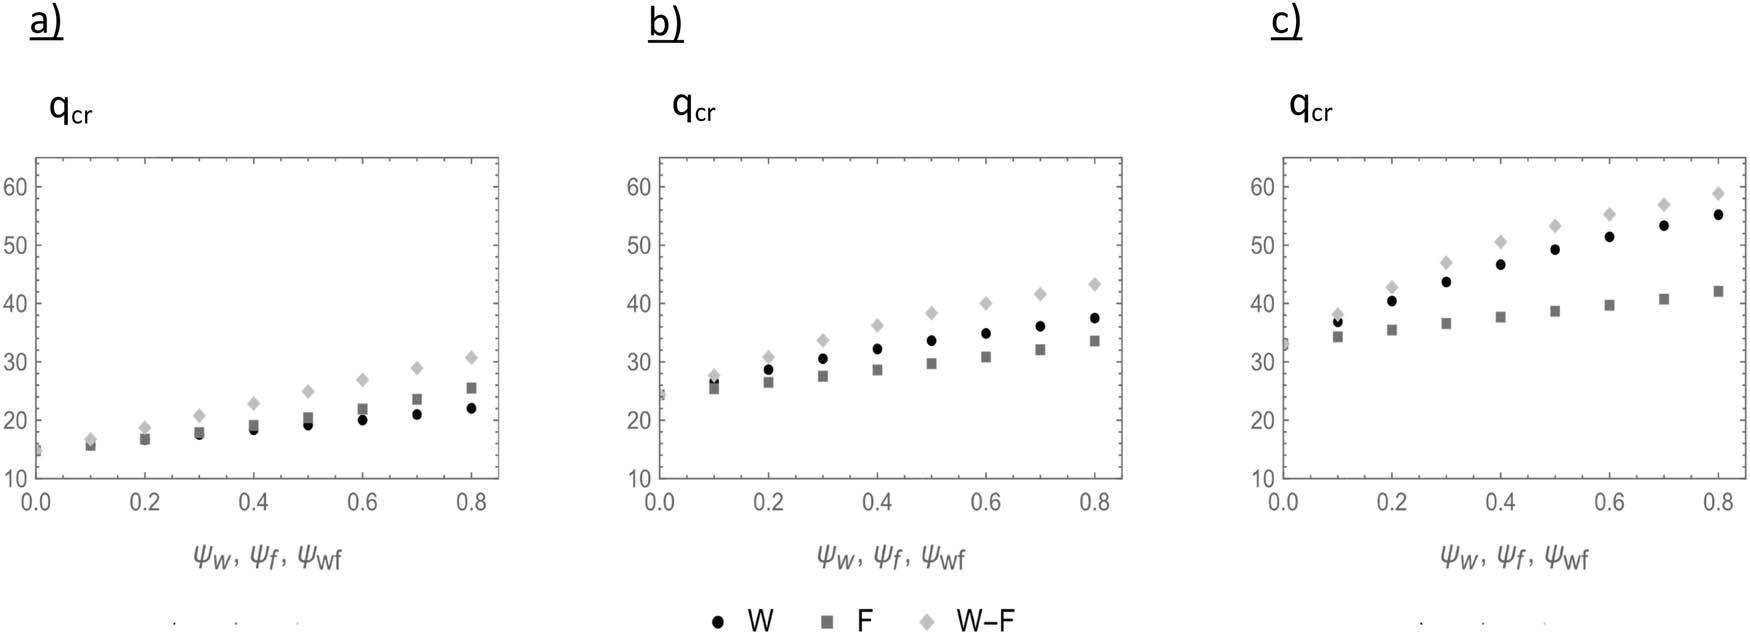
Figure 5
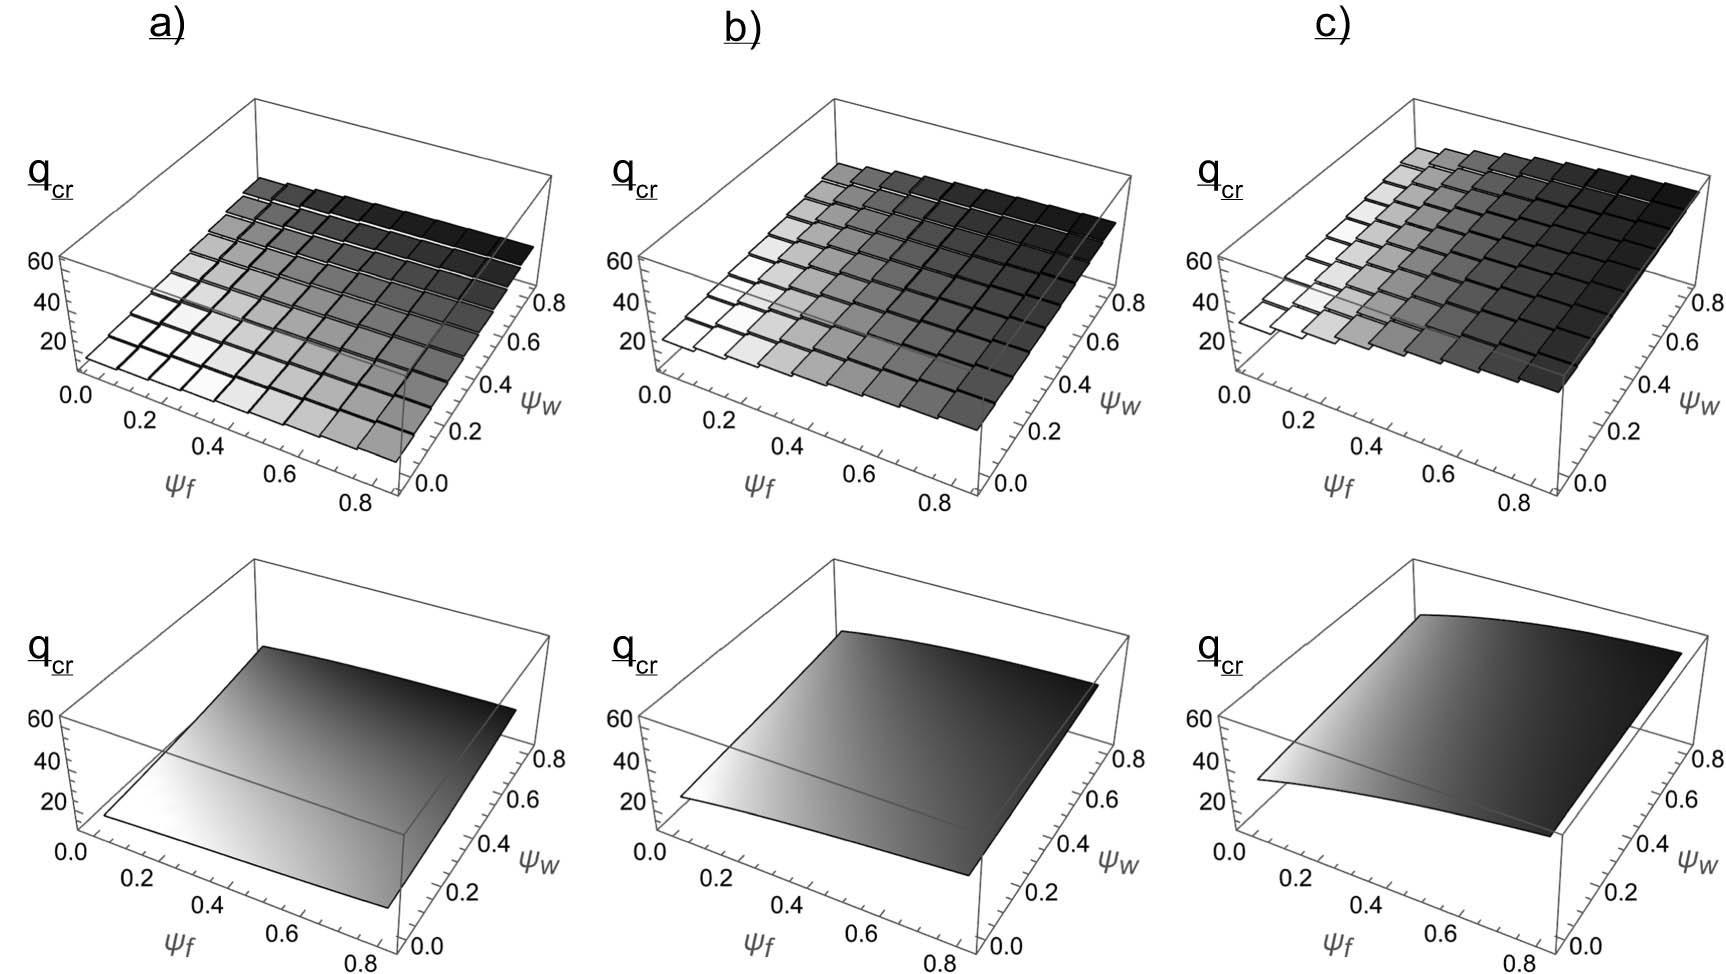
Critical load values when the load acts on the centre of the upper flange_
|
|
| |||||||||
|---|---|---|---|---|---|---|---|---|---|---|
| 0.0 | 0.1 | 0.2 | 0.3 | 0.4 | 0.5 | 0.6 | 0.7 | 0.8 | S w 1) | |
| 0.0 | 14.77 | 15.72 | 16.76 | 17.88 | 19.10 | 20.43 | 21.90 | 23.58 | 25.50 | 1.73 |
| 14.77 | 15.72 | 16.71 | 17.73 | 18.79 | 19.90 | 21.05 | 22.24 | 23.47 | ||
| 0.1 | 15.75 | 16.72 | ||||||||
| 15.74 | 16.79 | 17.79 | 18.94 | 20.21 | 21.60 | 23.15 | 24.91 | 26.92 | 1.71 | |
| 0.2 | 16.67 | 18.73 | ||||||||
| 16.67 | 17.66 | 18.97 | 19.91 | 21.20 | 22.63 | 24.23 | 26.04 | 28.07 | 1.68 | |
| 0.3 | 17.55 | 20.78 | ||||||||
| 17.54 | 18.53 | 19.60 | 21.31 | 22.08 | 23.53 | 25.15 | 26.96 | 28.97 | 1.65 | |
| 0.4 | 18.38 | 22.86 | ||||||||
| 18.34 | 19.34 | 20.39 | 21.56 | 23.78 | 24.29 | 25.89 | 27.66 | 29.60 | 1.61 | |
| 0.5 | 19.18 | 24.93 | ||||||||
| 19.05 | 20.12 | 21.15 | 22.29 | 23.54 | 26.31 | 26.46 | 28.14 | 29.99 | 1.56 | |
| 0.6 | 20.03 | 26.91 | ||||||||
| 19.67 | 20.93 | 21.92 | 23.00 | 24.19 | 25.49 | 28.79 | 28.47 | 30.21 | 1.51 | |
| 0.7 | 20.99 | 28.94 | ||||||||
| 20.14 | 21.84 | 22.75 | 23.75 | 24.85 | 26.04 | 27.34 | 31.04 | 30.43 | 1.45 | |
| 0.8 | 22.04 | 30.72 | ||||||||
| 20.43 | 22.81 | 23.65 | 24.56 | 25.57 | 26.67 | 27.89 | 29.26 | 32.79 | 1.39 | |
| S f 2) | 1.49 | 1.45 | 1.41 | 1.37 | 1.34 | 1.31 | 1.27 | 1.24 | 1.20 | 2.08 3) |
Critical load values when the load acts on the centre of the web_
|
|
| |||||||||
|---|---|---|---|---|---|---|---|---|---|---|
| 0.0 | 0.1 | 0.2 | 0.3 | 0.4 | 0.5 | 0.6 | 0.7 | 0.8 | S w | |
| 0.0 | 24.35 | 25.40 | 26.46 | 27.53 | 28.60 | 29.69 | 30.82 | 32.06 | 33.57 | 1.38 |
| 24.36 | 25.39 | 26.40 | 27.38 | 28.35 | 29.30 | 30.23 | 31.15 | 32.06 | ||
| 0.1 | 26.59 | 27.66 | 28.74 | 29.82 | 30.92 | 32.03 | 33.19 | 34.47 | 36.04 | 1.36 |
| 26.57 | 27.69 | |||||||||
| 0.2 | 28.66 | 29.73 | 30.80 | 31.88 | 32.98 | 34.10 | 35.27 | 36.56 | 38.12 | 1.33 |
| 28.64 | 31.00 | |||||||||
| 0.3 | 30.54 | 31.59 | 32.64 | 33.70 | 34.78 | 35.88 | 37.02 | 38.28 | 39.81 | 1.30 |
| 30.52 | 34.22 | |||||||||
| 0.4 | 32.21 | 33.21 | 34.21 | 35.22 | 36.25 | 37.29 | 38.39 | 39.59 | 41.04 | 1.27 |
| 32.18 | 37.25 | |||||||||
| 0.5 | 33.64 | 34.56 | 35.49 | 36.43 | 37.37 | 38.34 | 39.35 | 40.47 | 41.85 | 1.24 |
| 33.56 | 39.97 | |||||||||
| 0.6 | 34.87 | 35.71 | 36.55 | 37.39 | 38.23 | 39.11 | 40.02 | 41.07 | 42.36 | 1.21 |
| 34.58 | 42.21 | |||||||||
| 0.7 | 36.10 | 36.84 | 37.57 | 38.31 | 39.06 | 39.84 | 40.67 | 41.59 | 42.83 | 1.19 |
| 35.16 | 43.73 | |||||||||
| 0.8 | 37.50 | 38.15 | 38.79 | 39.43 | 40.09 | 40.78 | 41.53 | 42.41 | 43.30 | 1.15 |
| 35.16 | 44.18 | |||||||||
| S f | 1.54 | 1.50 | 1.47 | 1.43 | 1.40 | 1.37 | 1.35 | 1.32 | 1.29 | 1.78 |
Critical load values when the load acts on the centre of the lower flange_
|
|
| |||||||||
|---|---|---|---|---|---|---|---|---|---|---|
| 0.0 | 0.1 | 0.2 | 0.3 | 0.4 | 0.5 | 0.6 | 0.7 | 0.8 | S w | |
| 0.0 | 33.07 | 34.29 | 35.46 | 36.58 | 37.66 | 38.68 | 39.69 | 40.74 | 42.09 | |
| 33.18 | 34.36 | 35.48 | 36.54 | 37.54 | 38.47 | 39.35 | 40.16 | 40.91 | 1.27 | |
| 0.1 | 36.87 | 38.11 | ||||||||
| 36.85 | 38.11 | 39.28 | 40.39 | 41.45 | 42.45 | 43.42 | 44.47 | 45.87 | 1.24 | |
| 0.2 | 40.42 | 42.78 | ||||||||
| 40.37 | 41.64 | 42.92 | 43.85 | 44.87 | 45.82 | 46.76 | 47.79 | 49.17 | 1.22 | |
| 0.3 | 43.69 | 46.99 | ||||||||
| 43.67 | 44.87 | 45.96 | 47.44 | 47.94 | 48.84 | 49.71 | 50.68 | 52.01 | 1.19 | |
| 0.4 | 46.66 | 50.57 | ||||||||
| 46.65 | 47.76 | 48.78 | 49.71 | 51.49 | 51.36 | 52.12 | 53.00 | 54.24 | 1.16 | |
| 0.5 | 49.24 | 53.30 | ||||||||
| 49.22 | 50.23 | 51.13 | 51.93 | 52.65 | 54.85 | 53.93 | 54.70 | 55.84 | 1.13 | |
| 0.6 | 51.42 | 55.28 | ||||||||
| 51.25 | 52.28 | 53.03 | 53.68 | 54.25 | 54.76 | 57.26 | 55.98 | 57.03 | 1.11 | |
| 0.7 | 53.34 | 56.93 | ||||||||
| 52.58 | 54.05 | 54.65 | 55.17 | 55.61 | 56.02 | 56.47 | 58.36 | 58.09 | 1.09 | |
| 0.8 | 55.21 | 58.84 | ||||||||
| 52.96 | 55.77 | 56.24 | 56.63 | 56.96 | 57.28 | 57.66 | 58.23 | 57.69 | 1.07 | |
| S f | 1.67 | 1.63 | 1.59 | 1.55 | 1.51 | 1.48 | 1.45 | 1.43 | 1.40 | 1.78 |