
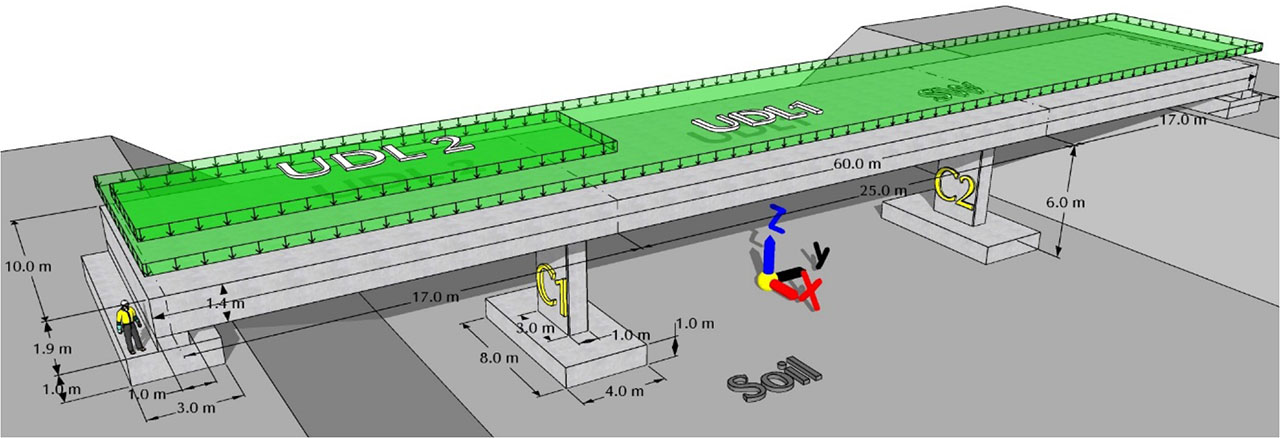
Figure 1:
Analyzed integral bridge.
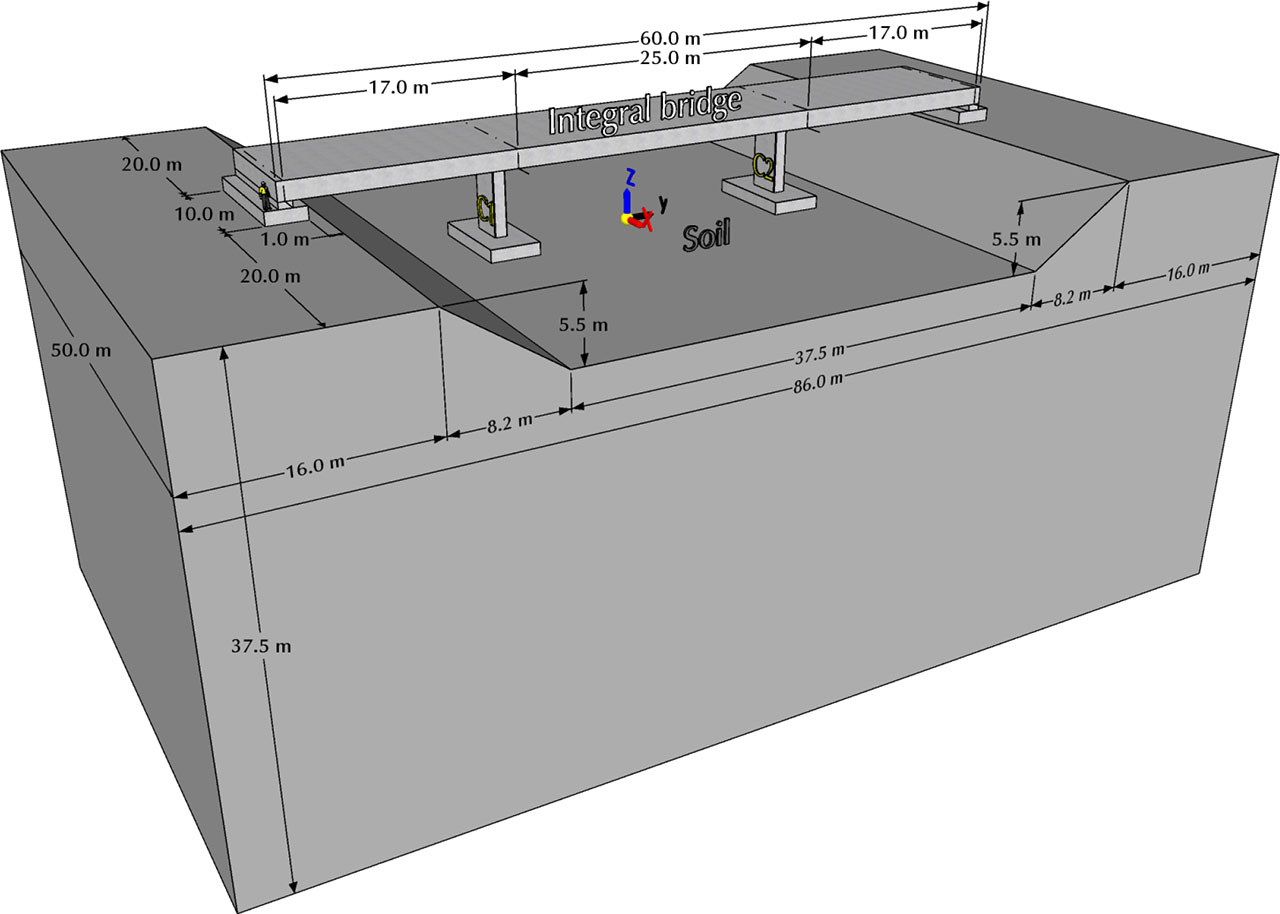
Figure 2:
Soil layer used in numerical models A and C.
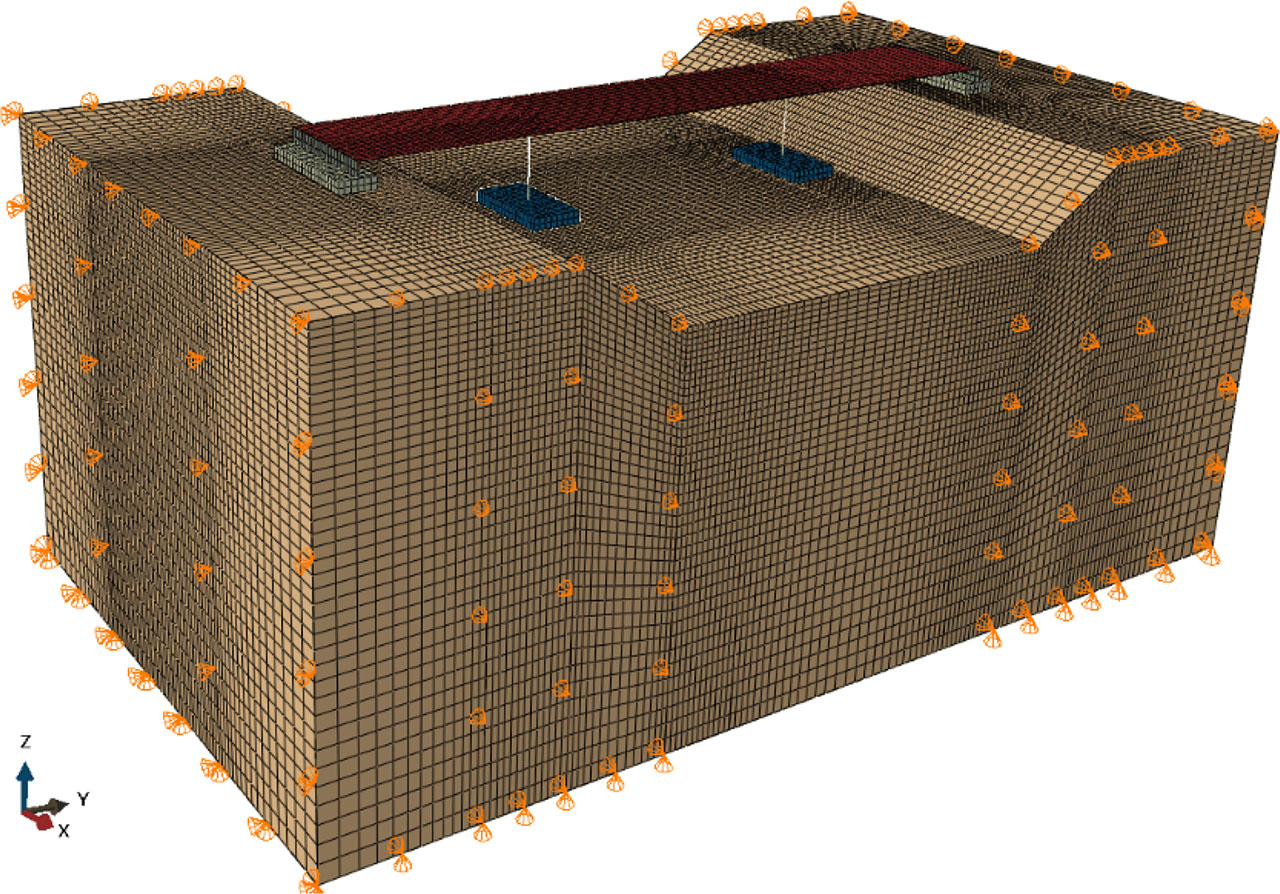
Figure 3:
Finite element mesh of complex models A and C.

Figure 4:
Finite element mesh of simple model B.
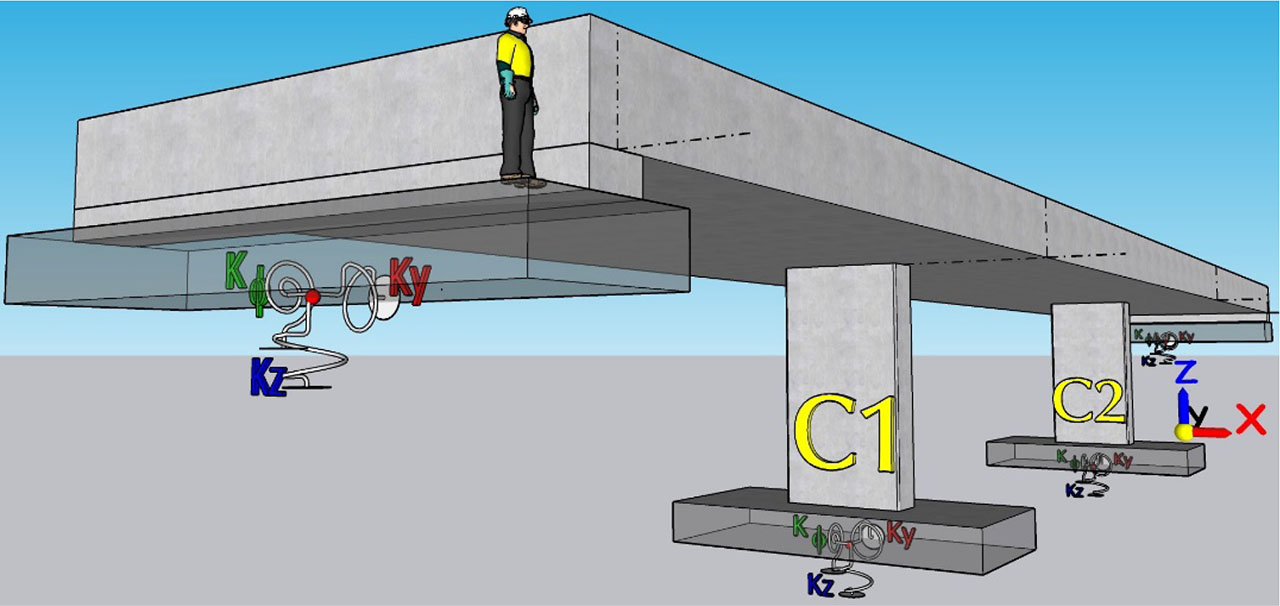
Figure 5:
Location of the applied springs under the footing foundations in simple model B.
Table 1:
Spring constants.
| Element | Pier footing | Abutment footing |
|---|---|---|
| βx (L/B) | L=8 m, B=4 m | L=10 m, B=3 m |
| βx =0.944 | βx =0.976 | |
| βy (L/B) | L=4 m, B=8 m | L=3 m, B=10 m |
| βy =1.012 | βy =1.096 | |
| βz (L/B) | L=4 m, B=8 m | L=3 m, B=10 m |
| βz =2.175 | βz =2.3 | |
| βφx (L/B) | L=4 m, B=8 m | L=3 m, B=10 m |
| βφx =0.435 | βφx =0.402 | |
| βφy (L/B) | L=8 m, B=4 m | L=10 m, B=3 m |
| βφy =0.595 | βφy =0.721 | |
| kx (kN/m) | 427,021 | 427,819 |
| ky (kN/m) | 457,832 | 480,236 |
| kz (kN/m) | 560,860 | 574,345 |
| kφx (kN/m/rad) | 2,540,626 | 1,650,517 |
| kφy (kN/m/rad) | 6,944,437 | 9,854,189 |
Table 2:
Material properties used in the analysis.
| Model | A, B, C |
|---|---|
| Soil | Loose sand and gravel [27] |
| Es (MN/m2) | 80 (Middle range value) |
| ν | 0.35 |
| ϕ | 40 (model A) |
| G (MN/m2) | 30.8 |
| L (m) | 3 and 4 |
| B (m) | 10 and 8 |
| Bridge structure | Concrete C50/60 |
| Ecm (MN/m2) | 37,000 |
| ν | 0.2 |
Table 3:
Load applied to the structure.
| Load type | Value |
|---|---|
| SW of the bridge structure SW | 24 kN/m3 |
| UDL 1 | 10 kN/m2 |
| UDL 2 | 25 kN/m2 |
| The characteristic value of the maximum expansion range of the uniform bridge temperature component | ∆TN,exp=36°C |
Table 4:
| Spring constants | Motion | Reference |
|---|---|---|
| Vertical stiffness | 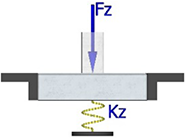 | Barkan (1962) |
| Horizontal stiffness | 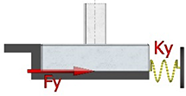 | Barkan (1962) |
| Rocking stiffness | 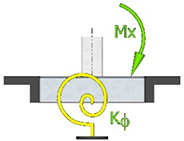 | Gorbunov-Posadov (1961) |
[i] where: L – length of foundation (in the plane of rotation for the case of rocking), B – width of foundation (along the axis of rotation for the case of rocking), ν – the soil’s Poisson’s ratio, G – the soil’s shear modulus, (βy, βz, βϕ) – spring coefficients, and (ky, kz, kϕ) – spring constants.

Figure 6:
Actual soil deformation and according to the theory of elasticity.
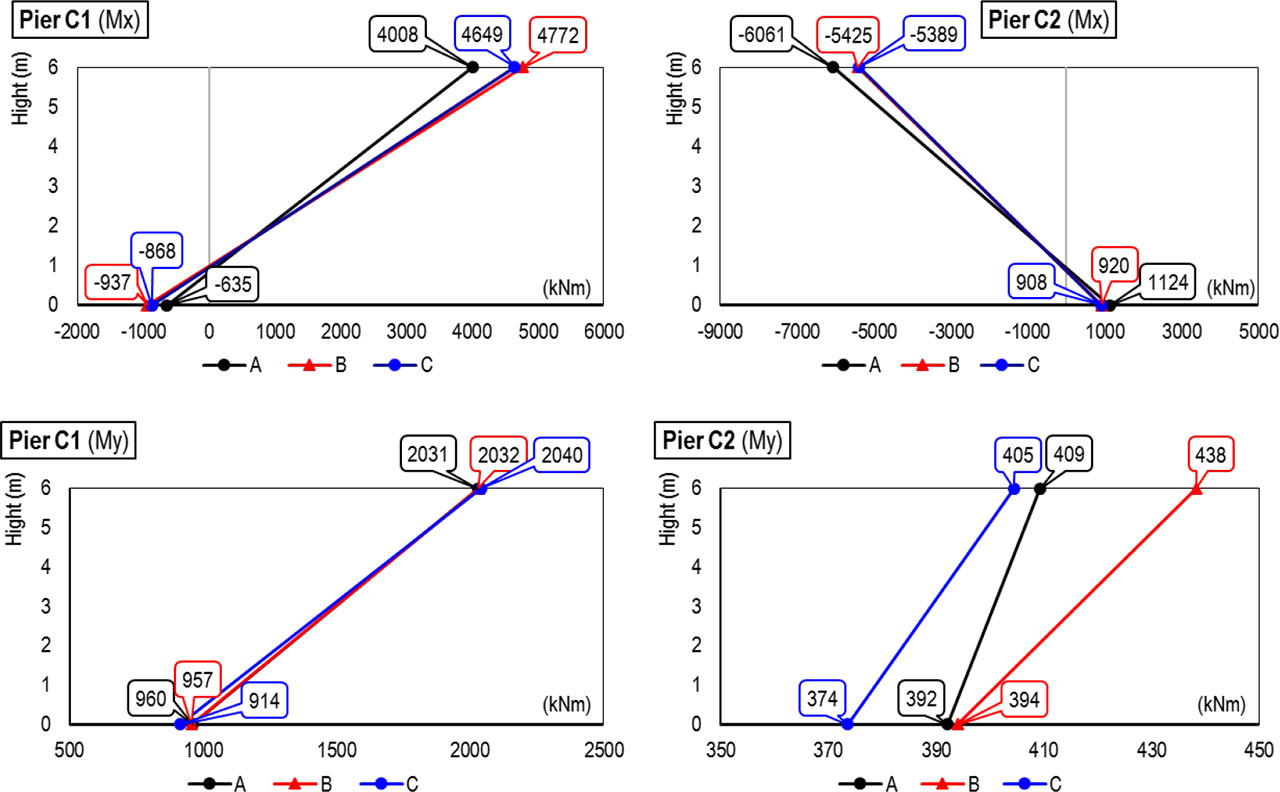
Figure 7:
Bending moments in piers C1 and C2 where A and C are complex bridge models and B is a simple bridge model.
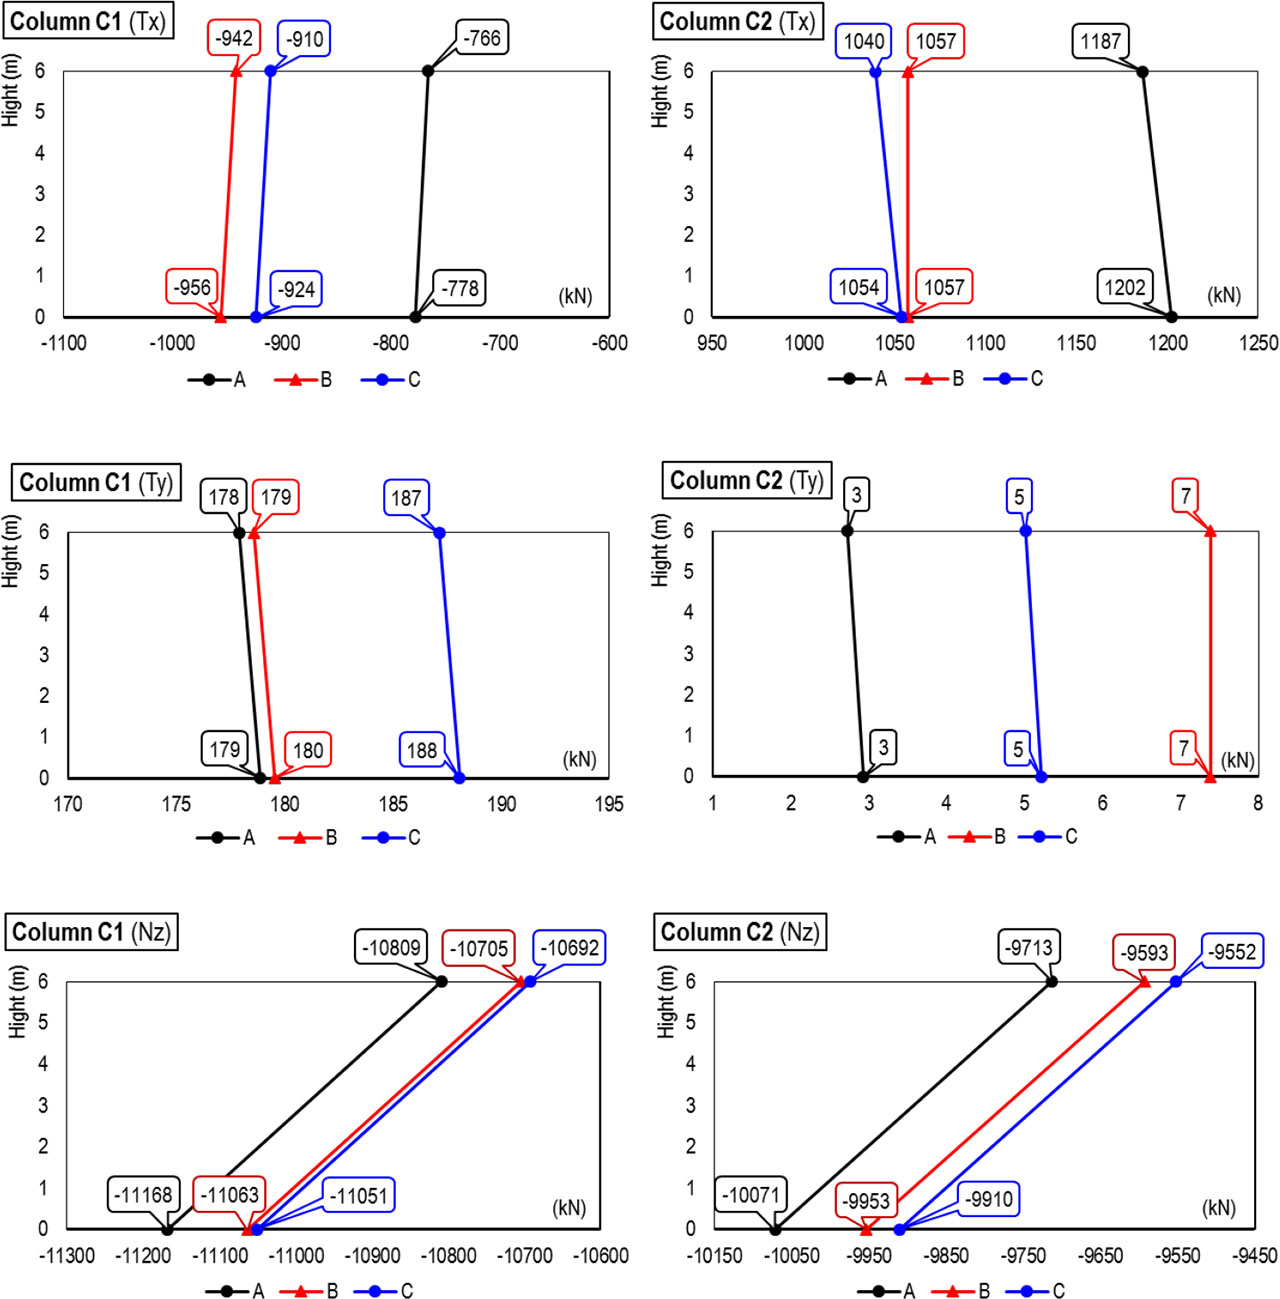
Figure 8:
Shear and axial forces in piers C1 and C2.
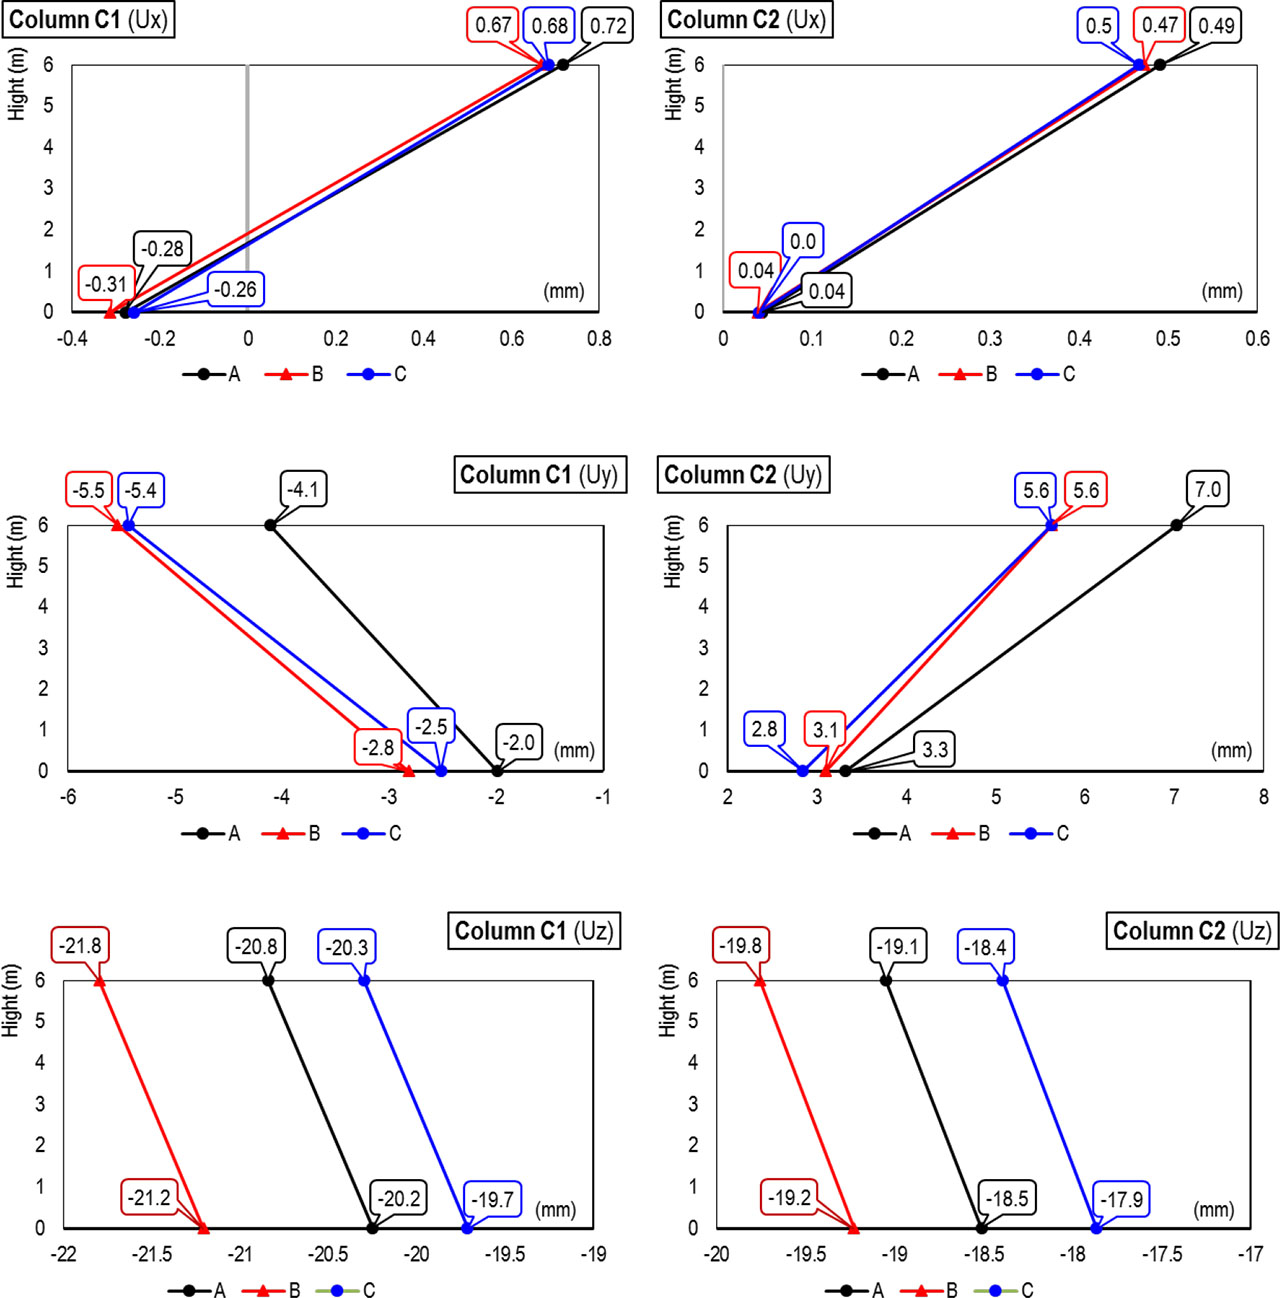
Figure 9:
Horizontal and vertical displacements in piers C1 and C2 where Ux and Uy are horizontal displacements along the X-axis and Y-axis direction and Uz is the vertical displacement along the Z-axis direction.