
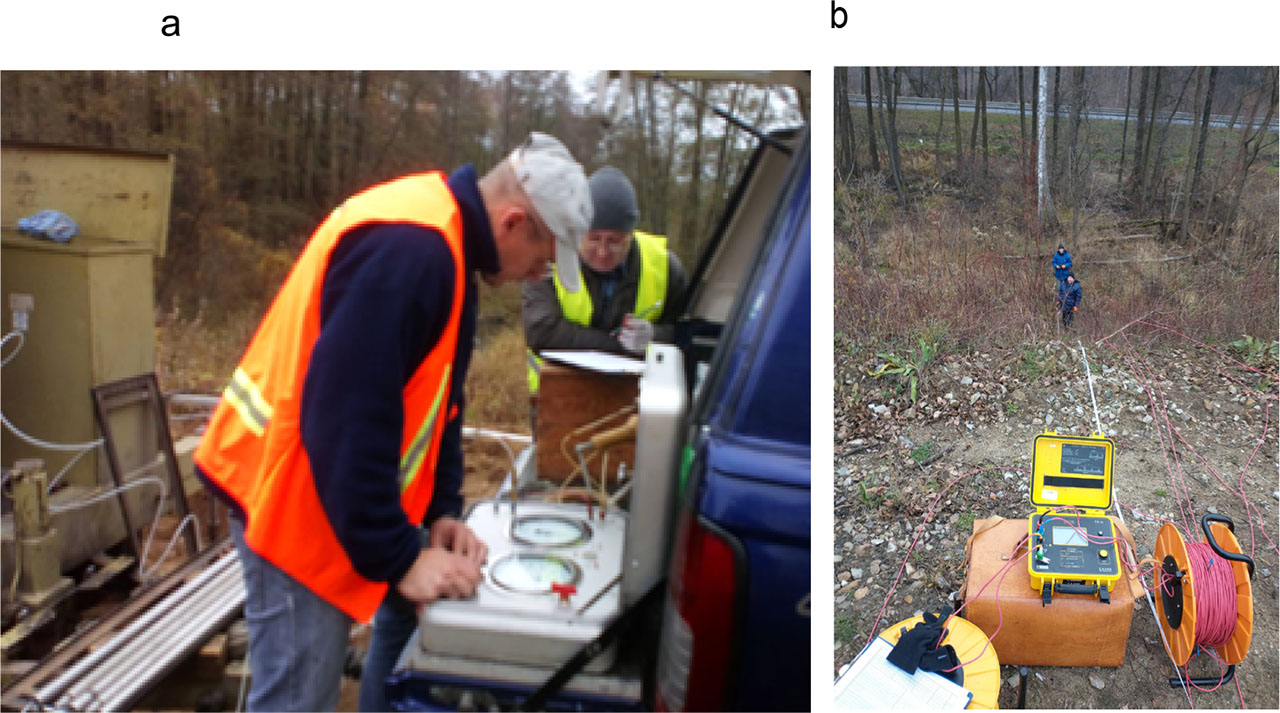
Figure 1:
The DMT unit control during the test (a) and geophysical investigation (b).
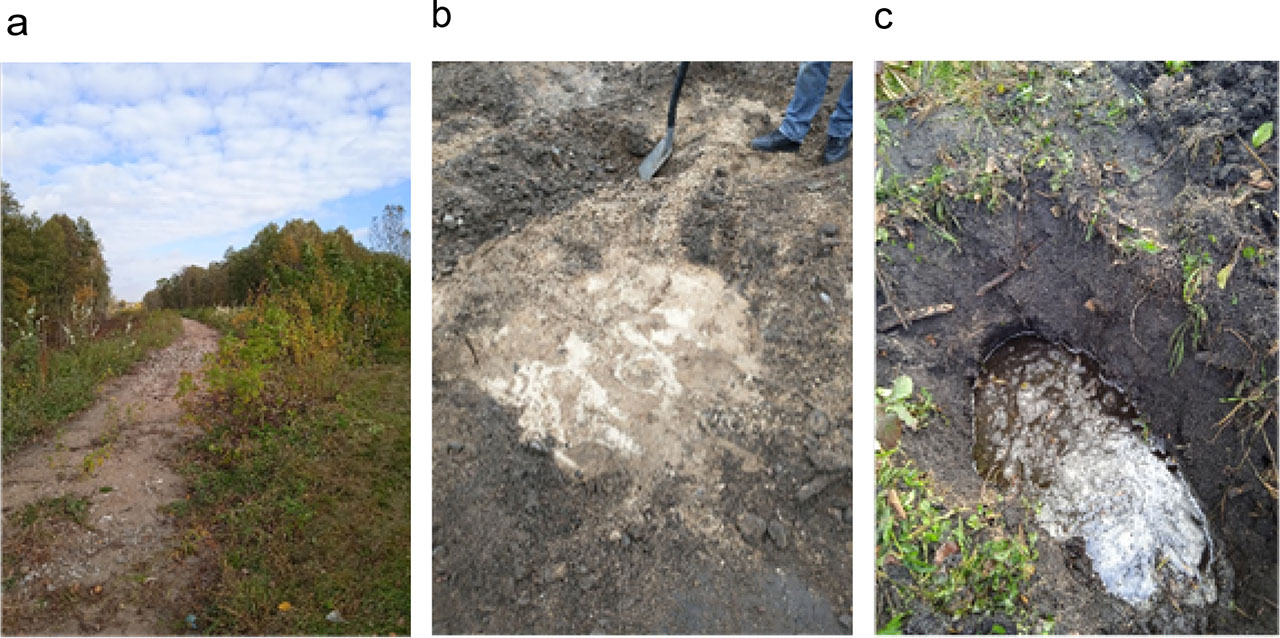
Figure 2:
An overall view of the embankment (a), a view after removing the breakstone layer (b), and an excavation at the base of the embankment (c).
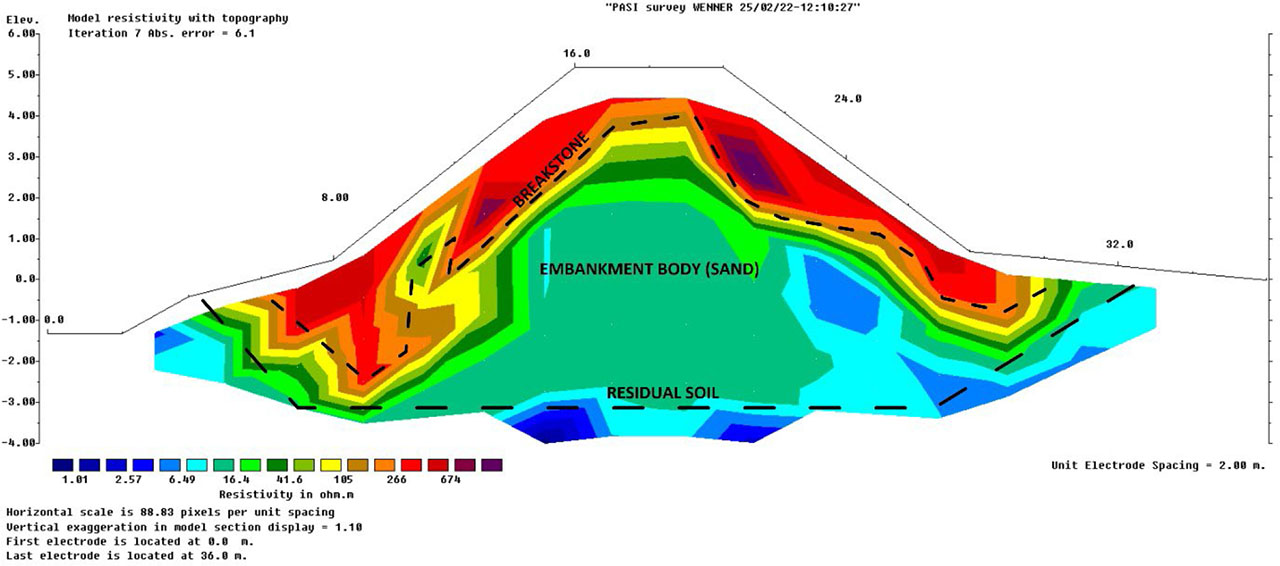
Figure 3:
Geoelectrical cross section across the railway fill.
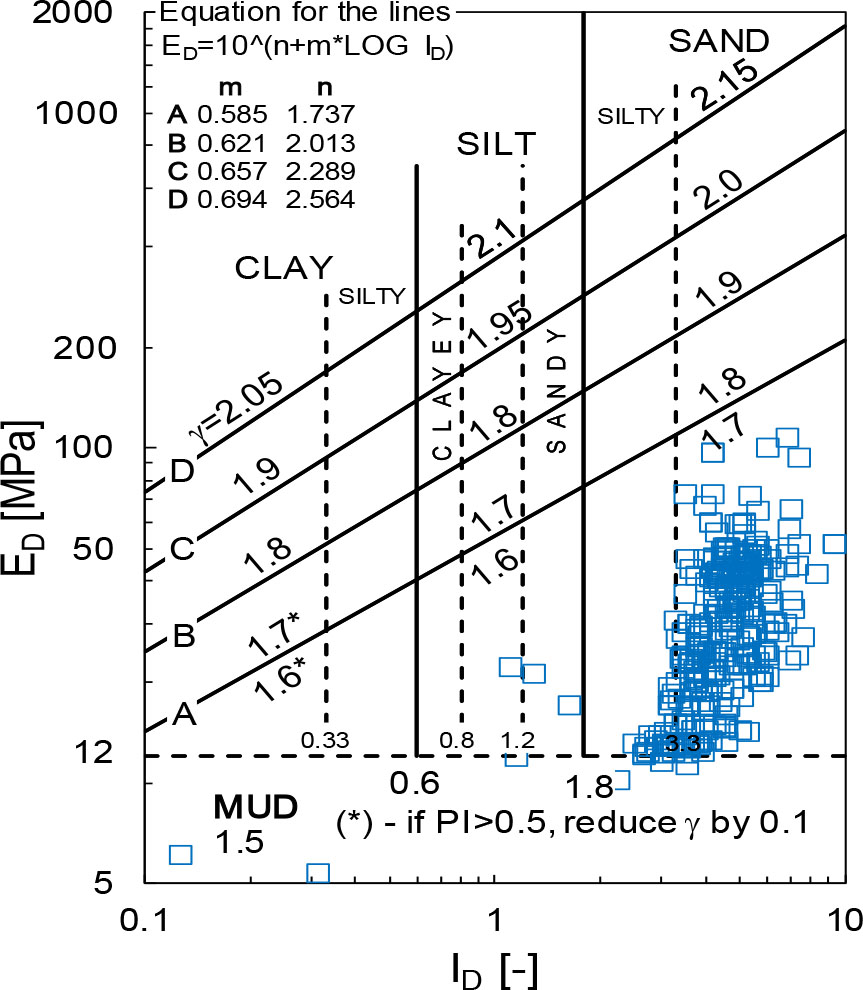
Figure 4:
Soil classification chart by DMT.
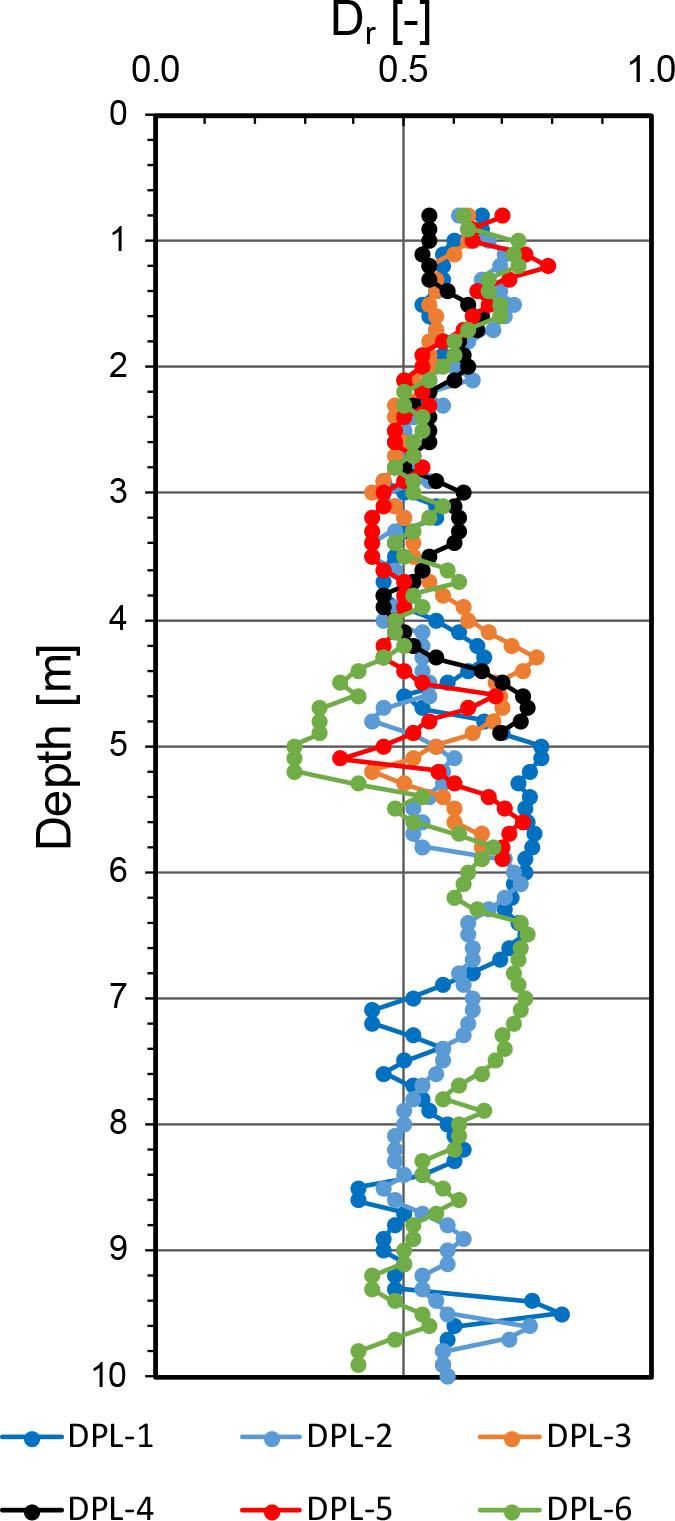
Figure 5:
Relative density of sands based on DPL tests.
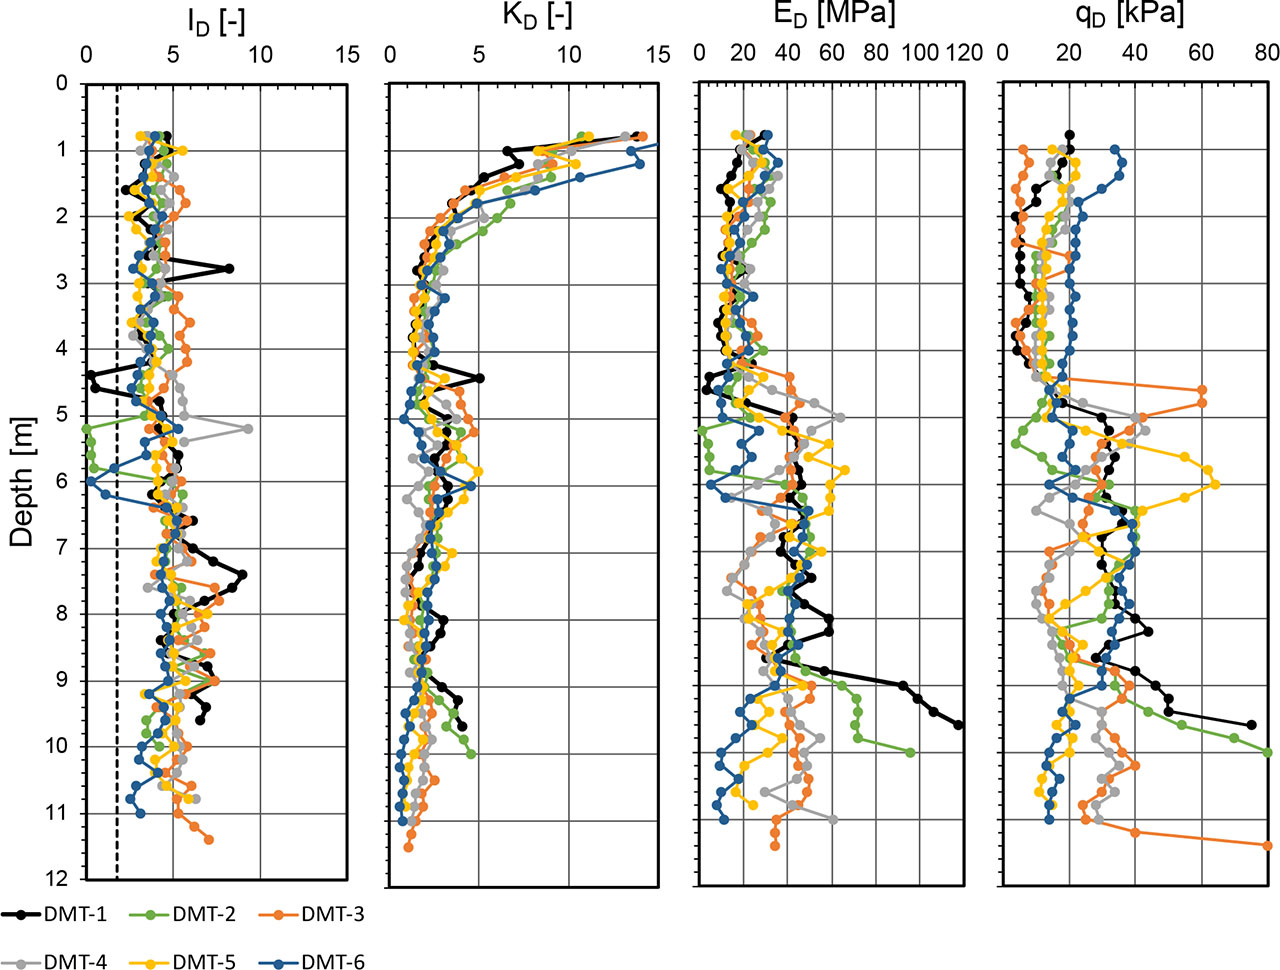
Figure 6:
DMT results.
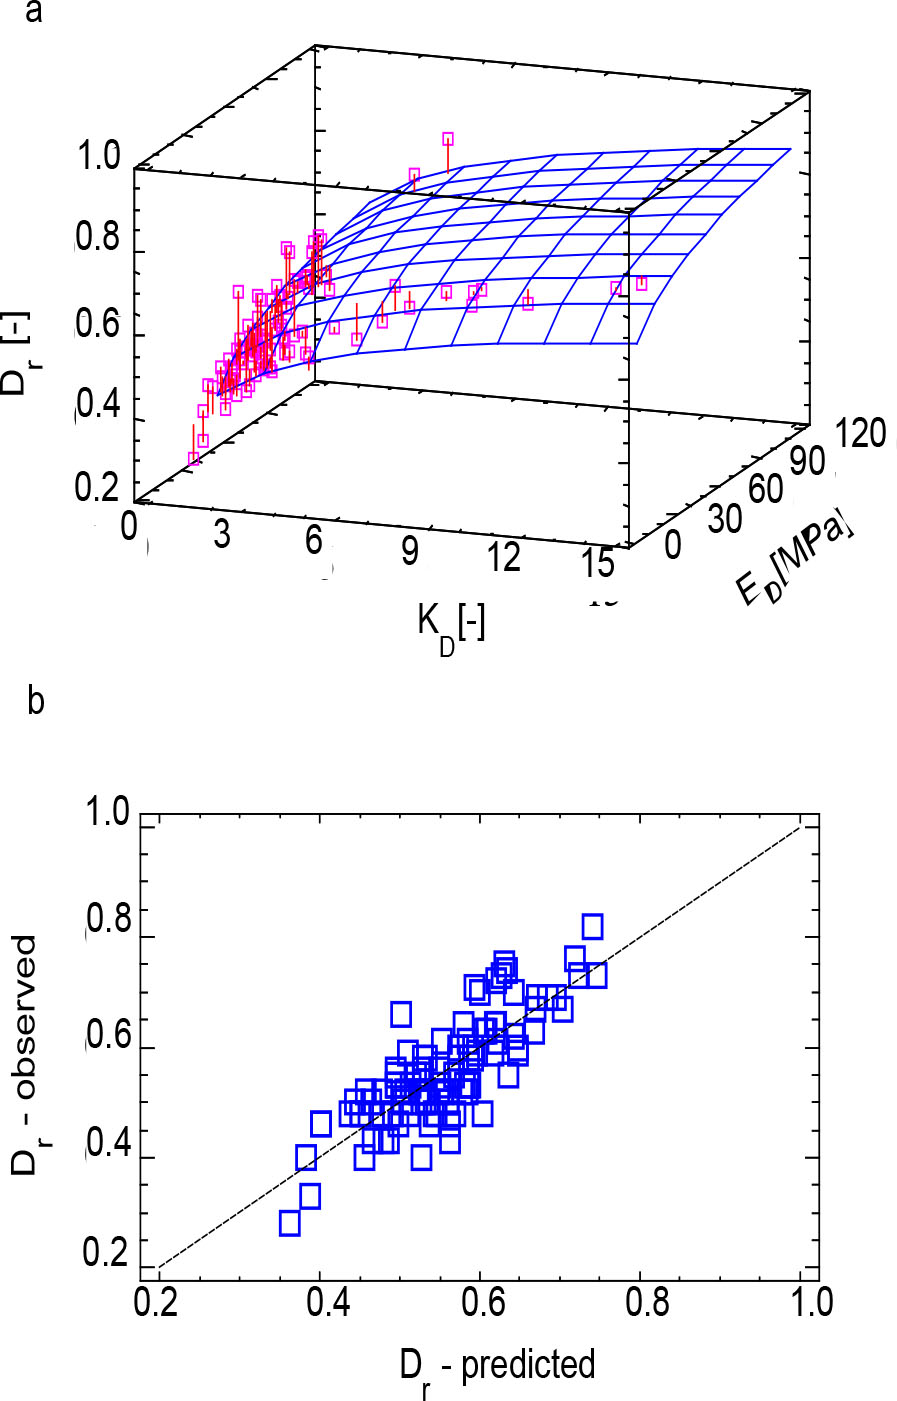
Figure 7:
Plot of Dr = f(KD, ED) relationship (a) and predicted versus obtained data on the investigated area.
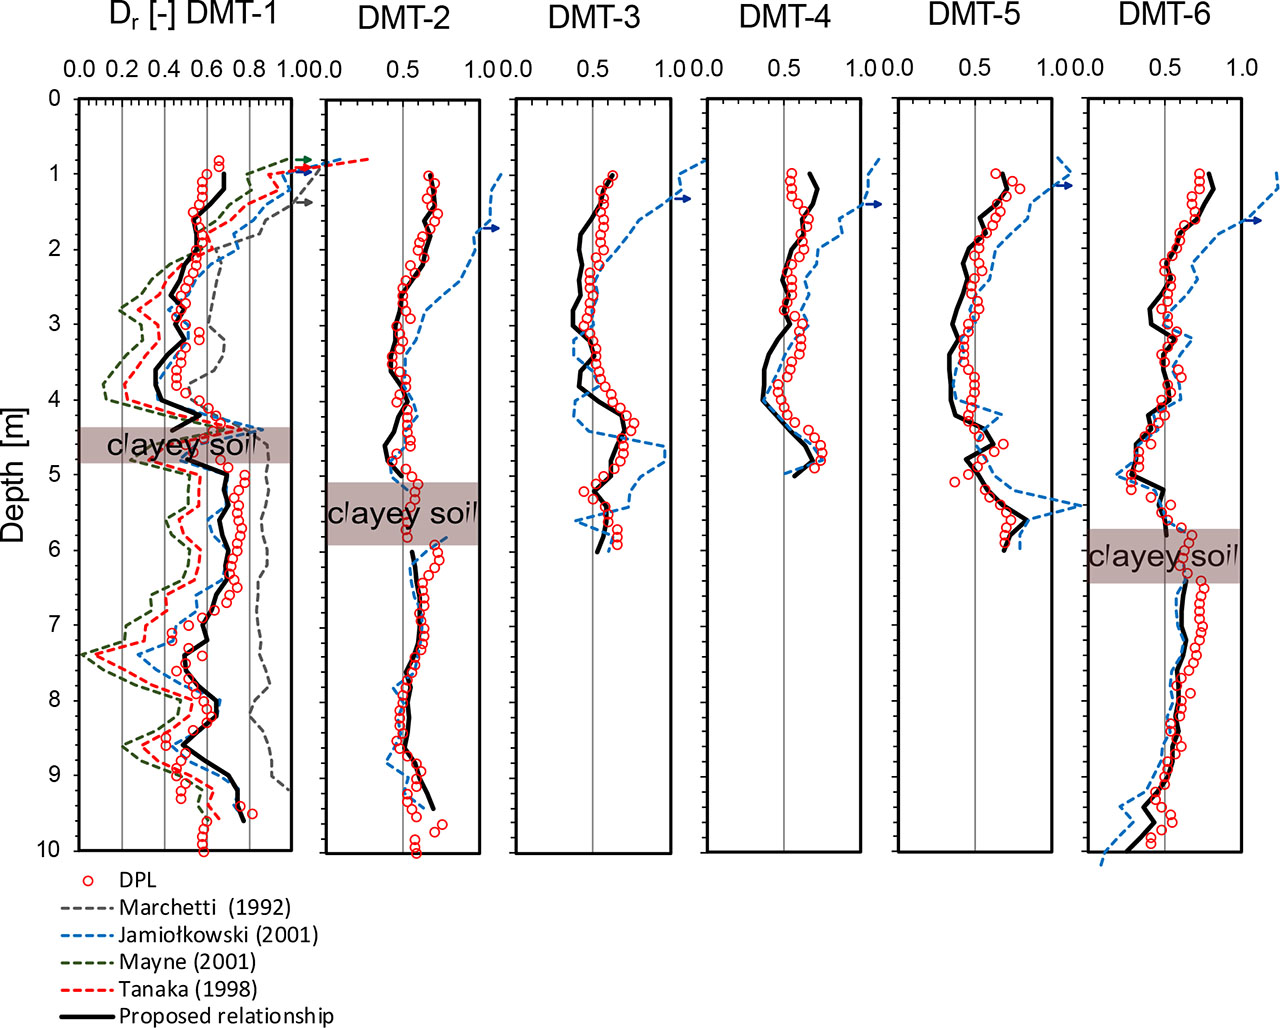
Figure 8:
Relative density (Dr) estimated based on the proposed formula (Eq. 10) versus values determined from DPL tests and calculated from literature-based relationships.
Table 1:
Correlation coefficient matrix for various soil parameters.
| Dr | p0 | p1 | ID | KD | ED | qD | ’v0 | |
|---|---|---|---|---|---|---|---|---|
| Dr | 0.392 | 0.379 | 0.053 | 0.740 | 0.499 | 0.526 | 0.11 | |
| 0.000 | 0.000 | 0.491 | 0.000 | 0.000 | 0.000 | 0.140 | ||
| p0 | 0.392 | 0.951 | 0.139 | 0.156 | 0.816 | 0.322 | 0.535 | |
| 0.000 | 0.000 | 0.069 | 0.042 | 0.000 | 0.000 | 0.000 | ||
| p1 | 0.379 | 0.951 | 0.412 | 0.106 | 0.888 | 0.547 | 0.593 | |
| 0.000 | 0.000 | 0.000 | 0.168 | 0.000 | 0.000 | 0.000 | ||
| ID | 0.053 | 0.139 | 0.412 | 0.12 | 0.394 | 0.178 | 0.343 | |
| 0.491 | 0.069 | 0.000 | 0.127 | 0.000 | 0.000 | 0.000 | ||
| KD | 0.740 | 0.156 | 0.106 | 0.12 | 0.264 | 0.328 | 0.40 | |
| 0.000 | 0.042 | 0.168 | 0.127 | 0.001 | 0.000 | 0.000 | ||
| ED | 0.499 | 0.816 | 0,888 | 0.394 | 0.264 | 0.771 | 0.569 | |
| 0.000 | 0.000 | 0,000 | 0.000 | 0.001 | 0.000 | 0.000 | ||
| qD | 0.526 | 0.322 | 0,547 | 0.178 | 0.328 | 0.771 | 0.355 | |
| 0.000 | 0.000 | 0,000 | 0.000 | 0.000 | 0.000 | 0.000 | ||
| ’v0 | 0.11 | 0.535 | 0.593 | 0.343 | 0.40 | 0.569 | 0.355 | |
| 0.140 | 0.000 | 0.000 | 0.000 | 0.000 | 0.000 | 0.000 |