
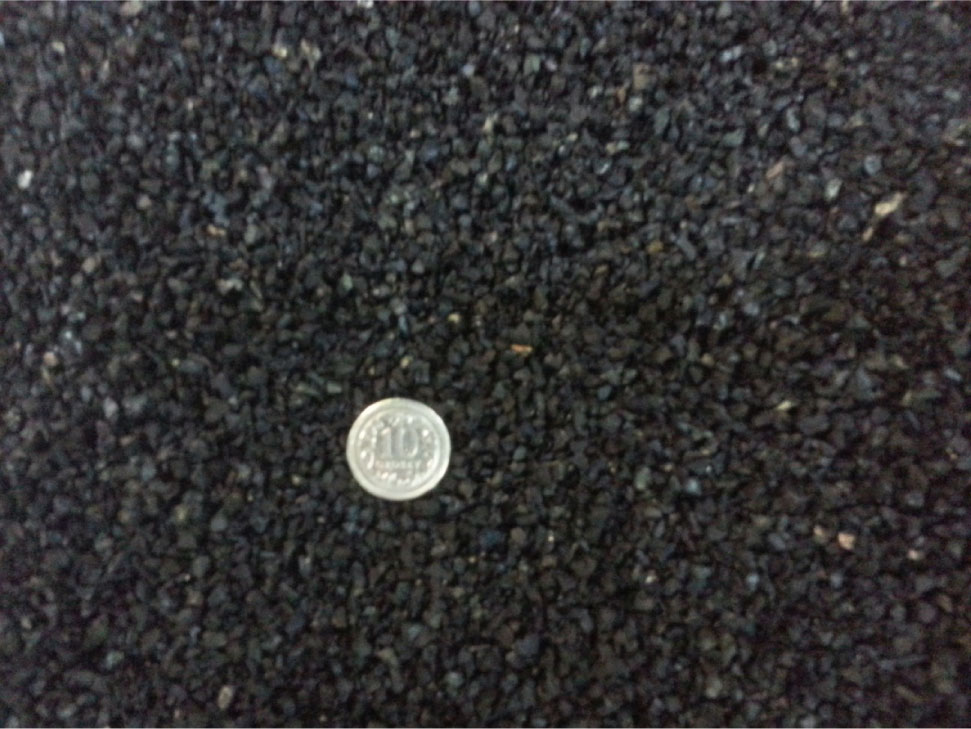
Figure 1:
Rubber waste granulate (G) 1–5 mm used in triaxial tests.
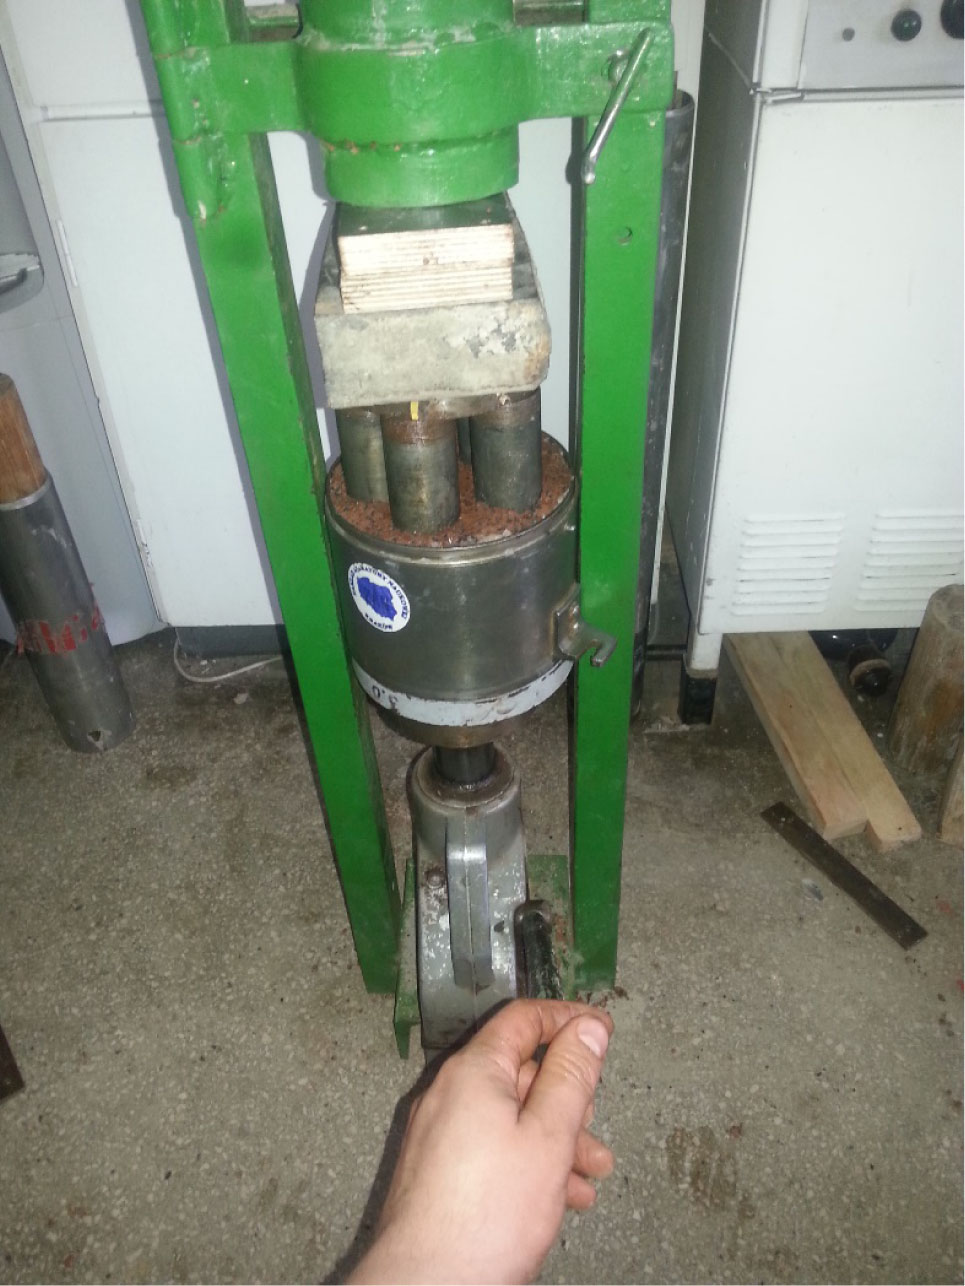
Figure 2:
Preparation of specimens from the red clay–granulate mixture.
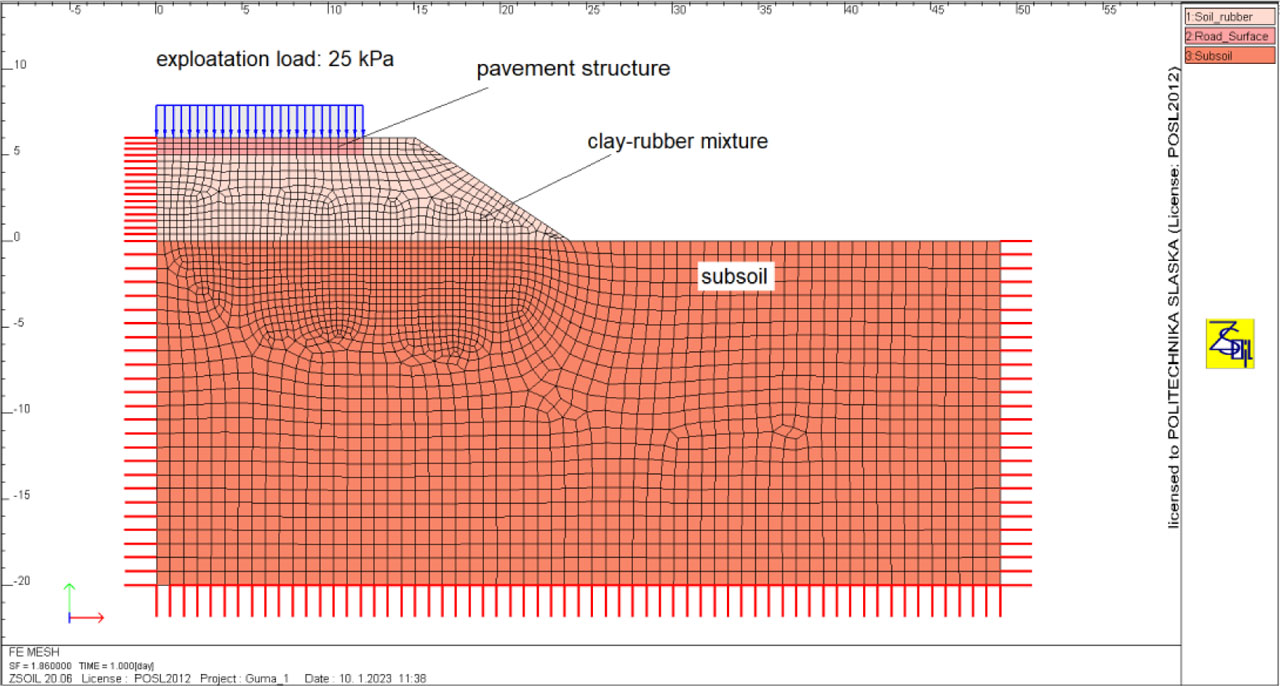
Figure 3:
Model used for stability analysis
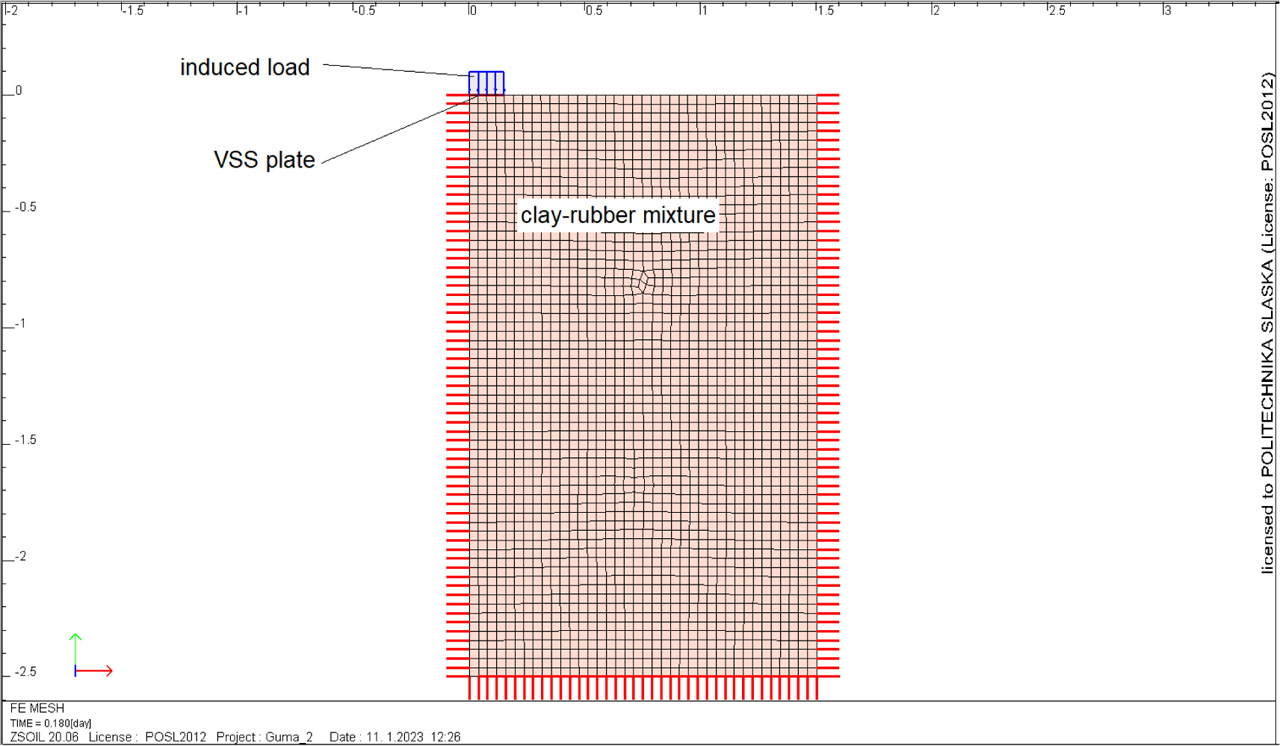
Figure 4:
Model was used to analyze the properties of the subsoil under the road surface construction.
Table 1:
The strength parameters obtained from CU/UU triaxial tests.
| Type of material | CU triaxial tests (cyclic/(*) monotonic) | CU triaxial tests (monotonic) | ||
|---|---|---|---|---|
| Internal friction angle ϕ [°] | Cohesion c [kPa] | Internal friction angle ϕ [°] | Cohesion c [kPa] | |
| RC-G-10 | 24 | 61 | 24 | 62 |
| RC-G-25 | 15 | 30 | 28 | 22 |
| K-G-25 | 9 | 70 | – | – |
| RC | – | – | 21 | 167 |
| K | 25* | 11* | – | – |
Table 2:
Parameters taken for numerical analyses.
| Material zone | Volumetric weight [kN/m3] | Cohesion c [kPa] | Internal friction angle ϕ [°] | Stiffness modulus E [MPa] |
|---|---|---|---|---|
| The corpus of the embankment (soil–rubber mixture) | 15.0 | 30 | 15 | 60 |
| Subsoil under the embankment | 21.0 | 5 | 30 | 40 |
| Pavement structure | 22.0 | Elastic material | 800 | |
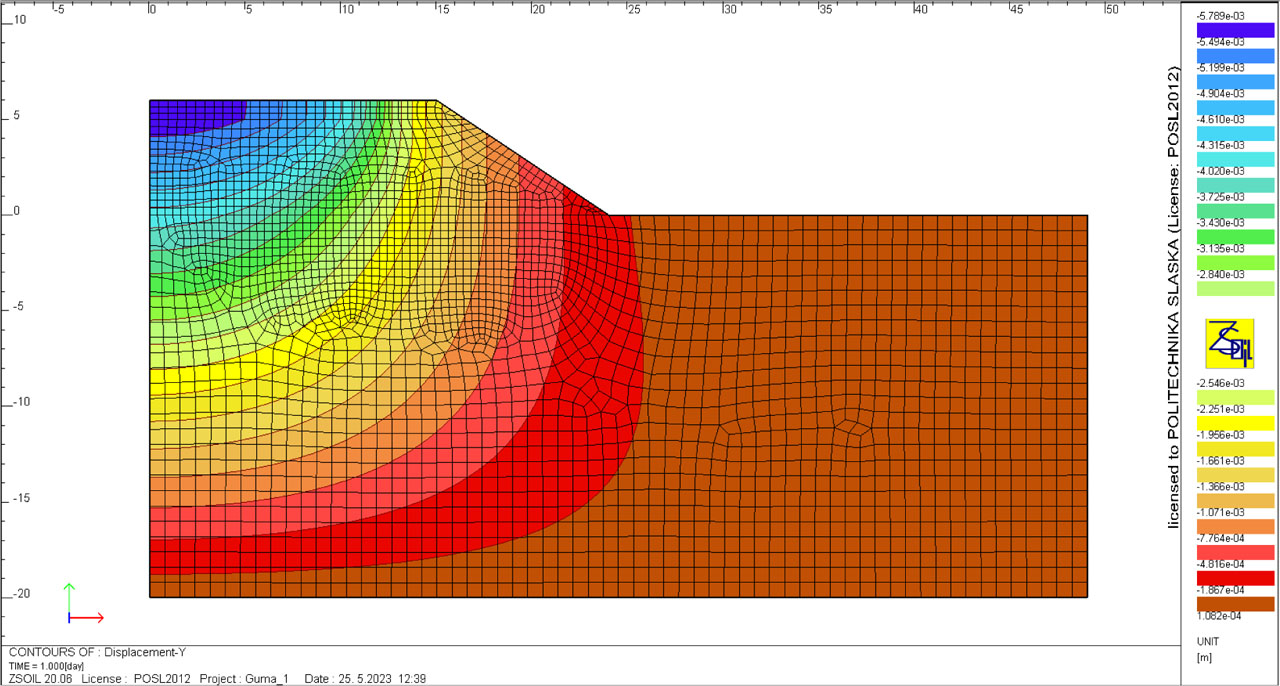
Figure 5:
Settlements caused by the exploitation load of the road surface.
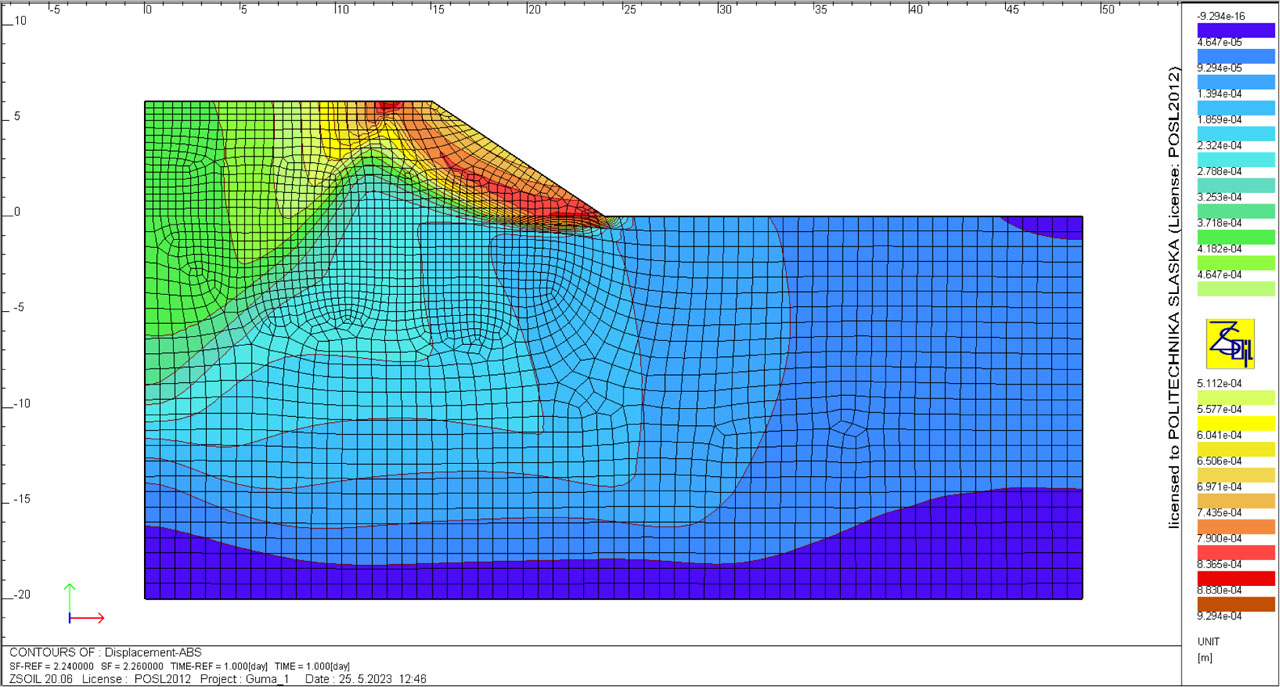
Figure 6:
Map of total displacements at the moment of loss of stability of the embankment slope.
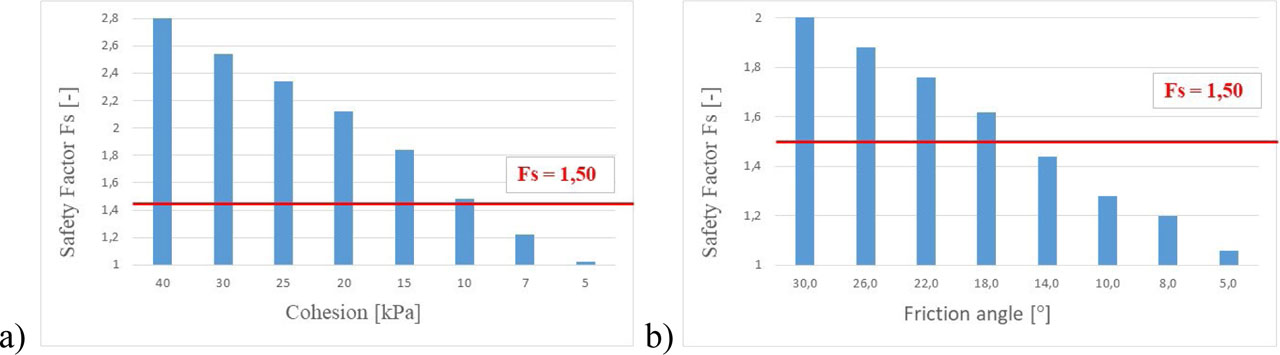
Figure 7:
Analysis of the impact of strength parameters on the value of the safety factor: a) cohesion, b) internal friction angle.
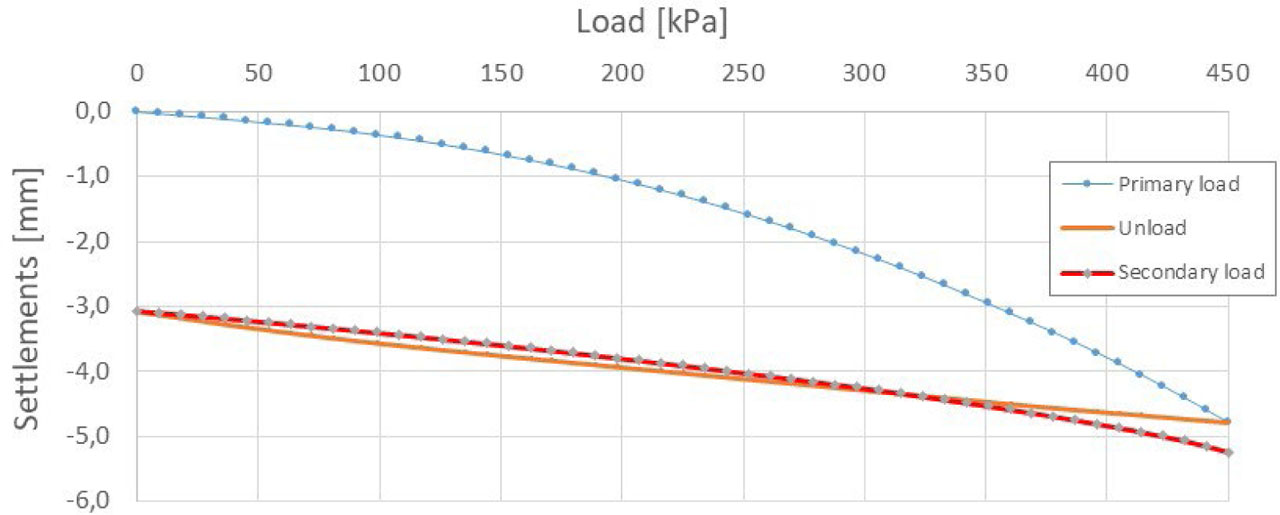
Figure 8:
Stress–settlement relationship for the VSS plate load test simulation.
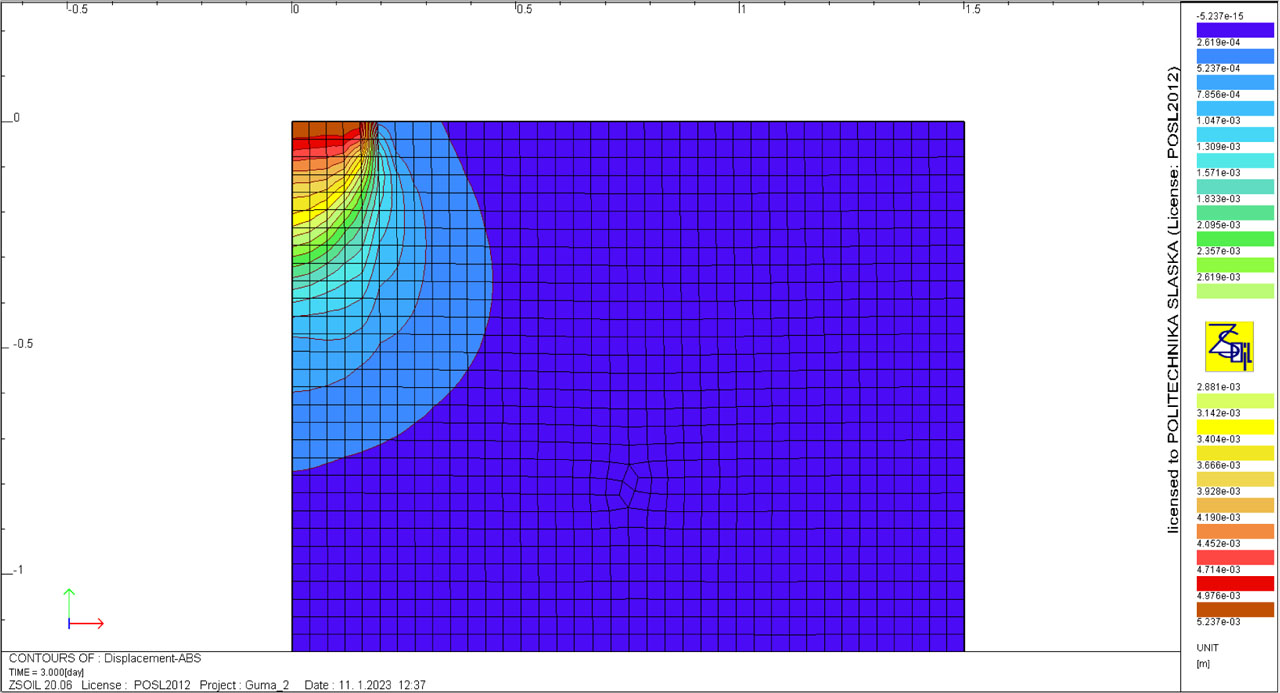
Figure 9.
Map of settlements caused by the load transmitted by the VSS plate.