
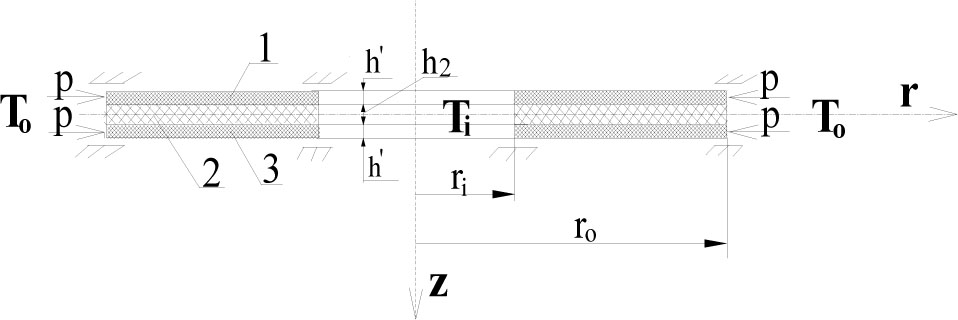
Figure 1
Scheme of thermomechanical loading of a three-layered annular plate built of outer layers 1 and 3 and middle layer 2.
Table 1
Parameters of the plate model.
| Geometrical parameters | |||
| Inner radius ri, m | 0.2 | ||
| Outer radius ro, m | 0.5 | ||
| Facing thickness h′, mm | 1 | ||
| Core thickness h2, mm | 5 | ||
| Ratio of plate initial deflection ξ2 | 0.5, 1, 2 | ||
| Material parameters | |||
| Steel facing | Polyurethane foam of core | ||
| Young's modulus E, GPa | 210 | E2, MPa | 13 |
| Kirchhoff's modulus G, GPa | 80 | G2, MPa | 5 |
| Poisson's ratio ν | 0.3 | ν2 | 0.3 |
| Mass density μ, kg/m3 | 7850 | μ2, kg/m3 | 64 |
| Linear expansion coefficient a, 1/K | 1.2×10⁻⁵ | a2, 1/K | 7×10⁻⁵ |
| Loading parameters | |||
| Rate of thermal loading growth a, K/s (TK7, 1/s) | 200 (20), 800 (20) | ||
| Rate of mechanical loading growth s, MPa/s (K7, 1/s) | 931 (20) | ||
| Constant temperature difference ΔT, K | 800 | ||
Table 2
The values of the dynamic, critical temperature differences ΔTcrdyn depending on the number N of discrete points for the FDM plate model with the imperfection ratio ξ2 = 0.5 subjected to a positive gradient of the temperature field.
| m | ΔTcrdyn (K) | ||||
|---|---|---|---|---|---|
| N = 11 | N = 14 | N = 17 | N = 21 | N = 26 | |
| 0 | 128.6 | 130.0 | 130.1 | 131.6 | 131.5 |
| 1 | 131.9 | 133.7 | 133.7 | 134.2 | 134.7 |
| 2 | 133.5 | 135.5 | 135.5 | 137.2 | 137.0 |
| 3 | 126.4 | 129.3 | 131.2 | 130.9 | 132.4 |
| 4 | 117.5 | 120.7 | 122.1 | 123.5 | 124.8 |
| 5 | 108.7 | 112.3 | 114.9 | 115.9 | 117.1 |
| 6 | 105.7 | 108.9 | 110.4 | 112.8 | 113.8 |
| 7 | 103.8 | 106.8 | 108.8 | 109.5 | 111.7 |
| 8 | 103.7 | 107.9 | 110.3 | 112.8 | 116.4 |
Table 3
The values of the dynamic, critical mechanical loads pcrdyn with the corresponding temperature differences ΔTb for the axisymmetric FDM plate model (m = 0) with the imperfection ratio ξ2 = 2 subjected to a mechanical load and increasing with the value a = 800 K/s temperature field with a positive gradient.
| Number N | 11 | 14 | 17 | 21 | 26 |
|---|---|---|---|---|---|
| pcrdyn (MPa)/ΔTb (K) | 30.74/26.4 | 29.35/25.2 | 31.21/26.8 | 30.74/26.4 | 31.21/26.8 |
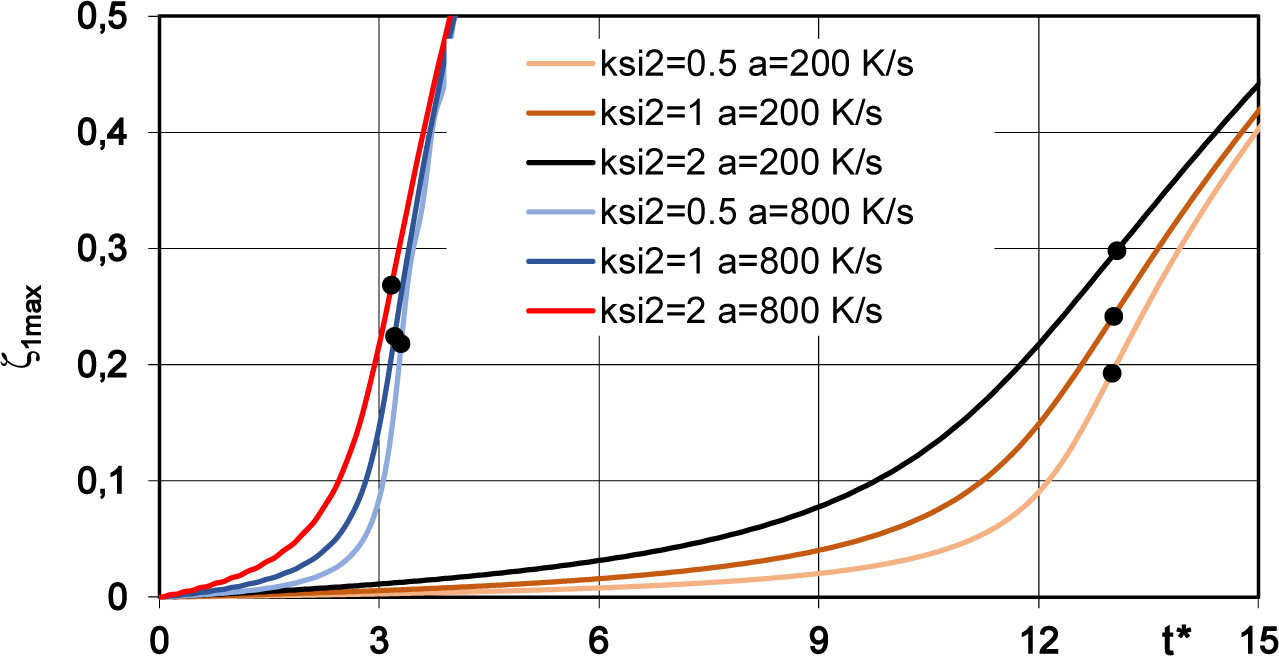
Figure 2
Deflections of the axisymmetrical m = 0 plate model versus imperfection ratio ξ2 under a temperature field with a positive gradient and two rates a = 200 K/s and a = 800 K/s.
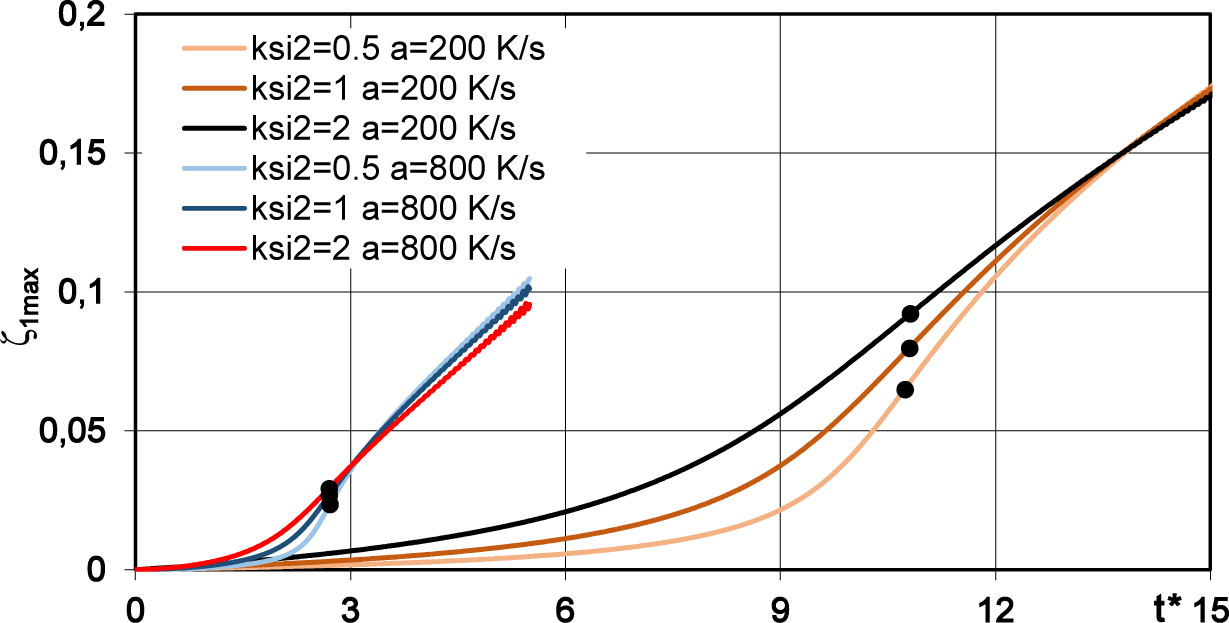
Figure 3
Deflections of the asymmetrical m = 7 plate model versus the imperfection ratio ξ2 under a temperature field with a positive gradient and two rates a = 200 K/s and a = 800 K/s.
Table 4
Values of critical temperature differences ΔTcrdyn for the axisymmetrical m = 0 FDM plate model versus the imperfection ratio ξ2 under a temperature field with a positive gradient and two rates a = 200 K/s and a = 800 K/s.
| Rate a (K/s) | ΔTcrdyn (K) | ||
|---|---|---|---|
| ξ2 | |||
| 0.5 | 1 | 2 | |
| 200 | 130.0 | 130.2 | 130.7 |
| 800 | 132.0 | 128.4 | 126.8 |
Table 5
Values of critical temperature differences ΔTcrdyn for the asymmetrical m = 7 FDM plate model versus the imperfection rate ξ2 under a temperature field with a positive gradient and two rates a = 200 K/s and a = 800 K/s.
| Ratio a (K/s) | ΔTcrdyn (K) | ||
|---|---|---|---|
| ξ2 | |||
| 0.5 | 1 | 2 | |
| 200 | 107.4 | 108.0 | 108.2 |
| 800 | 108.8 | 108.4 | 108.4 |
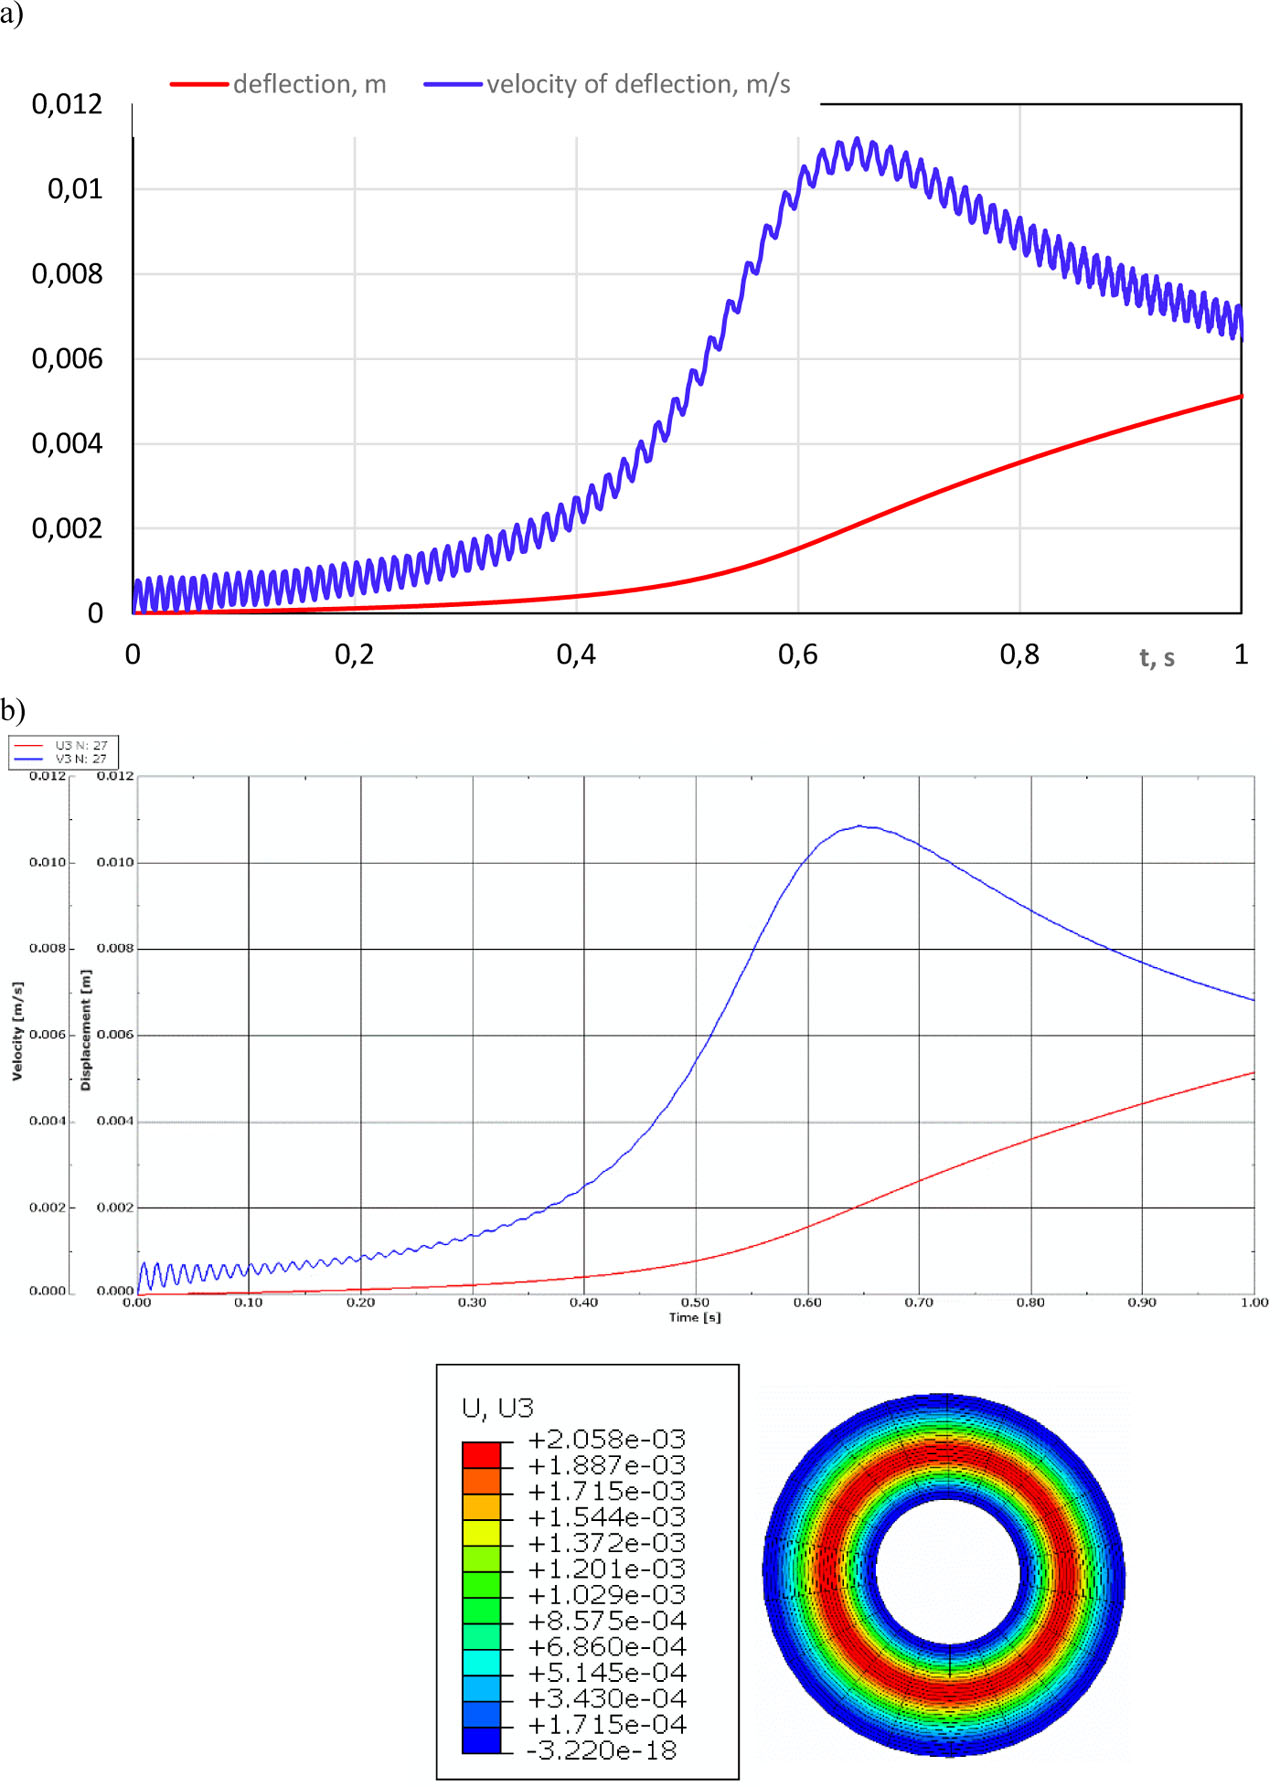
Figure 4
Time histories of deflections and velocity of deflection for plate model m = 0 with the imperfection ratio ξ2 = 2 loaded thermally with a positive temperature gradient, with rate a = 200 K/s: a) FDM model, b) FEM model with critical deflection form.
Table 6
Values of critical temperature differences ΔTcrdyn for the axisymmetrical m = 0 FEM plate model versus the imperfection ratio ξ2 under a temperature field with a positive gradient and two rates a = 200 K/s and a = 800 K/s.
| Rate a (K/s) | ΔTcrdyn (K) | ||
|---|---|---|---|
| ξ2 | |||
| 0.5 | 1 | 2 | |
| 200 | 115.2 | 121.2 | 129.2 |
| 800 | 124.8 | 128.0 | 132.8 |
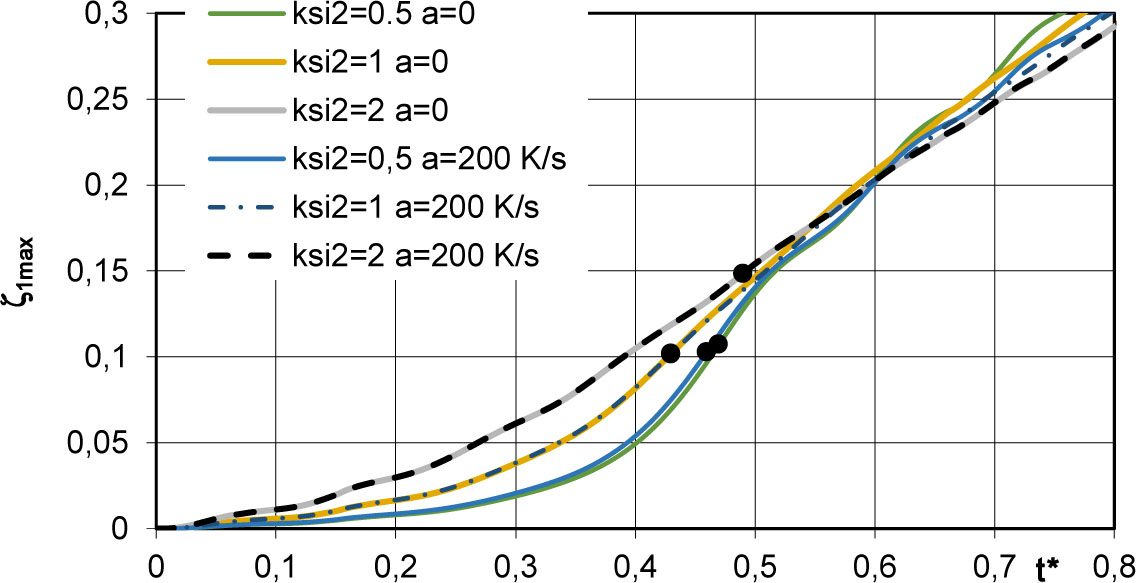
Figure 5
Deflections of the asymmetrical m = 7 plate model with different imperfection ratios ξ2 under mechanical load and thermal load with a positive temperature gradient and various rates a.
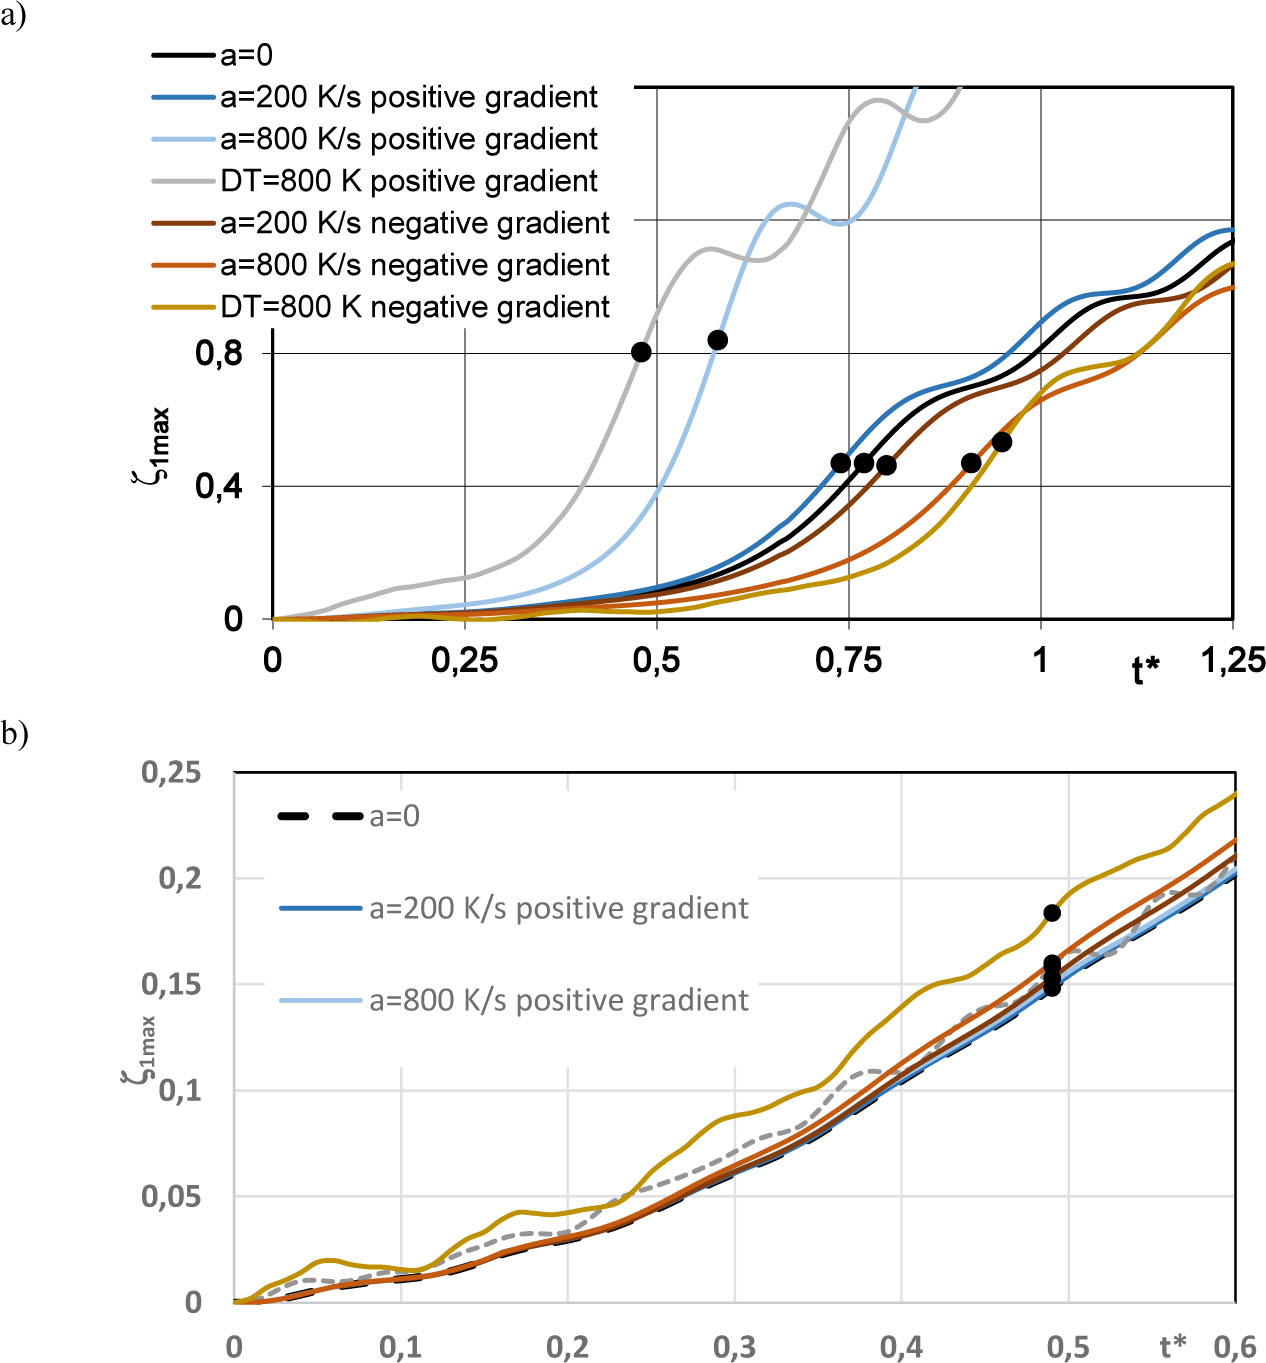
Figure 6
Time histories of deflections for the FDM plate with ξ2 = 2 thermomechanically loaded with various rates a or fixed temperature ΔT = 800 K: a) axisymmetrical plate mode m = 0 and b) asymmetrical plate mode m = 7.
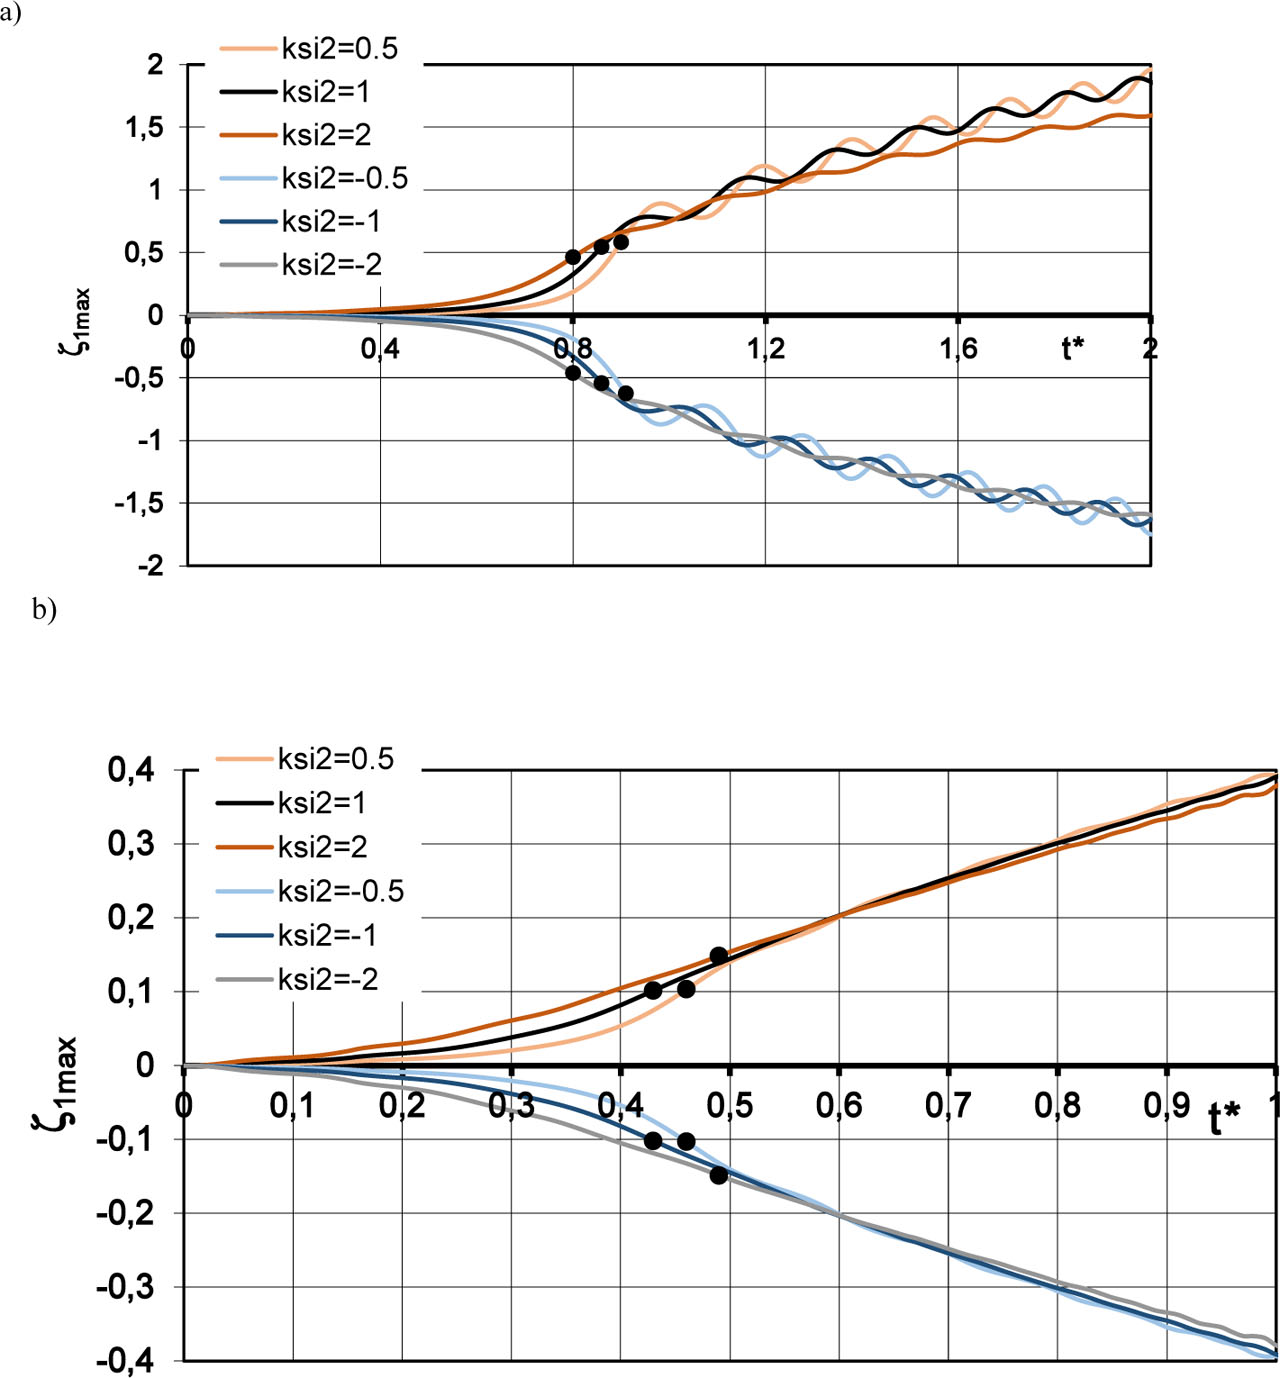
Figure 7
Deflections of a) axisymmetrical plate mode m = 0 [11], b) asymmetrical plate mode m = 7 versus negative and positive imperfection ratios ξ2 under mechanical load and thermal load with a negative gradient.
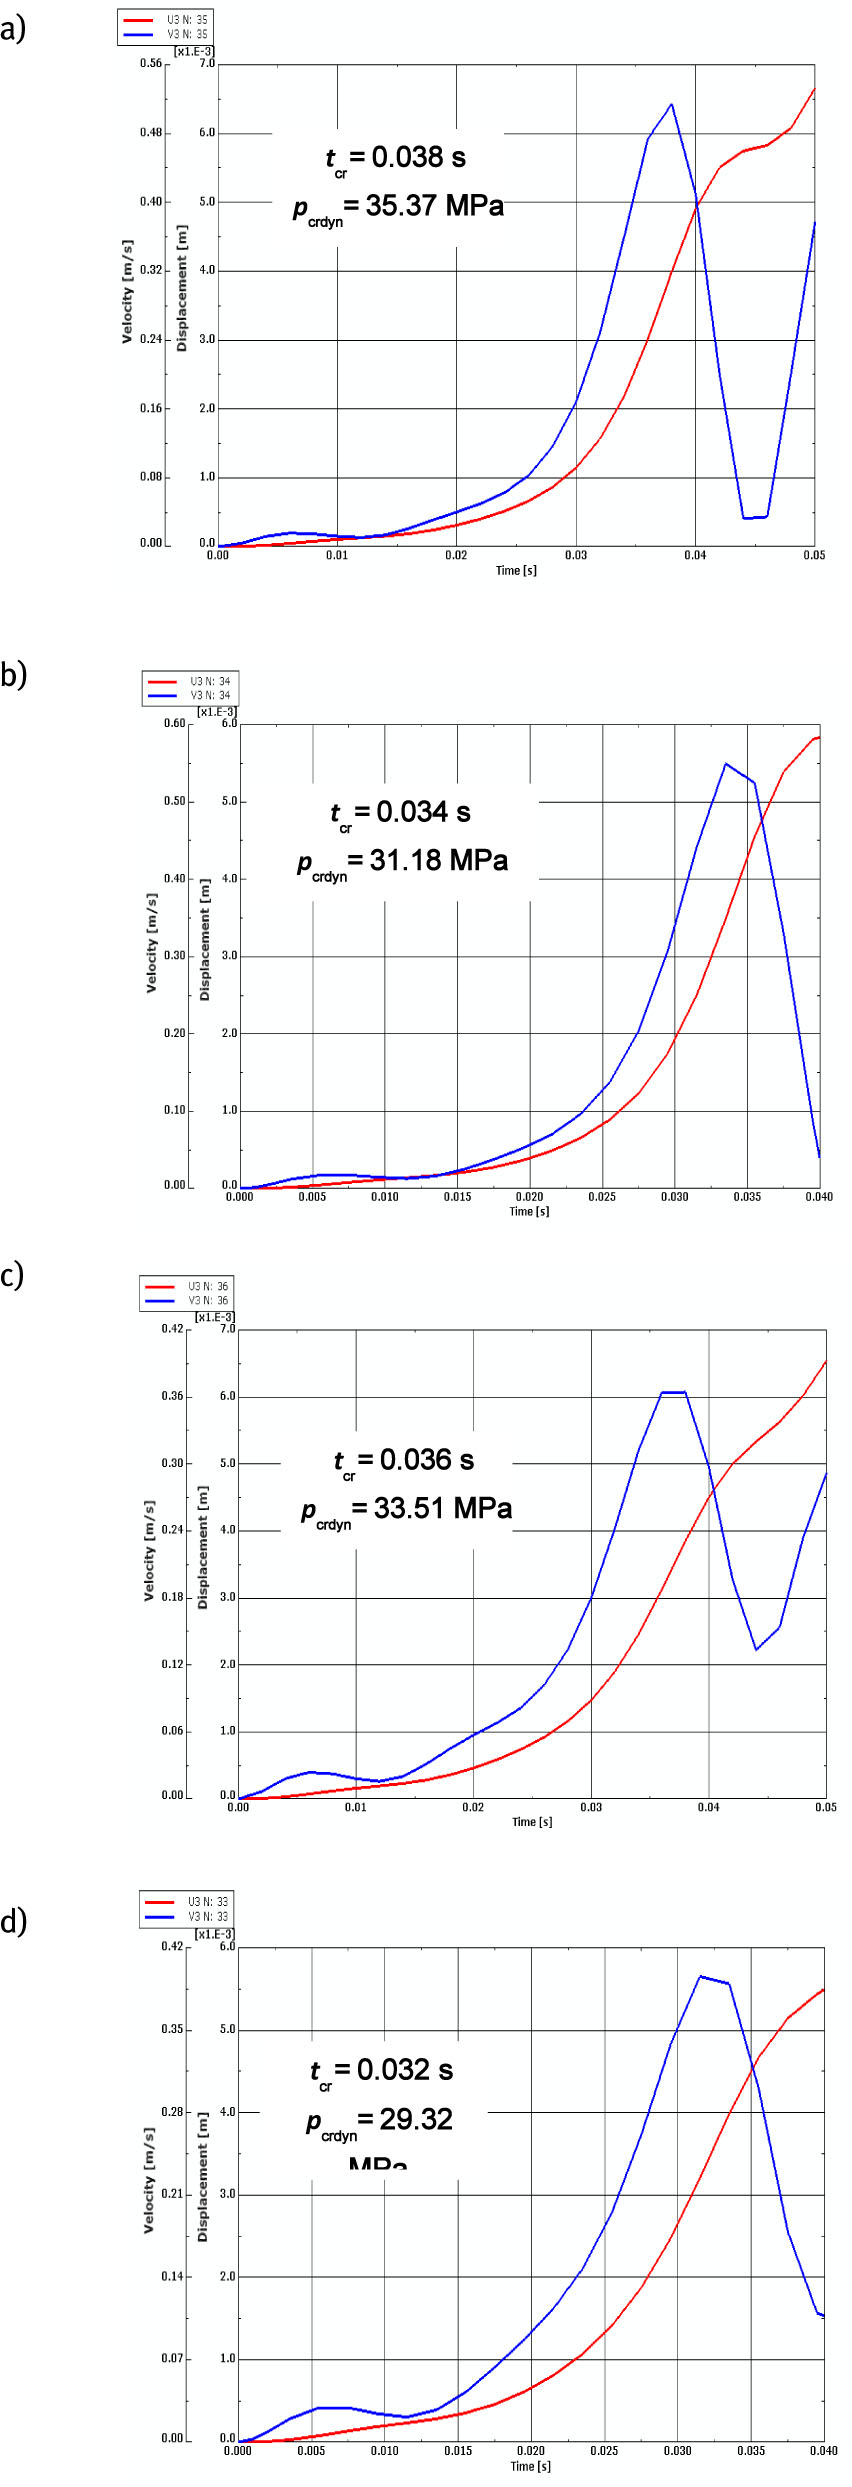
Figure 8
Time histories of deflections and velocity of deflections for the axisymmetrical m = 0 FEM plate model thermomechanically loaded with a positive temperature gradient versus different imperfection ratios ξ2 and temperature growth loads a: a) ξ2 = 1, a = 200 K/s, b) ξ2 = 1, a = 800 K/s, c) ξ2 = 2, a = 200 K/s, d) ξ2 = 2, a = 800 K/s.
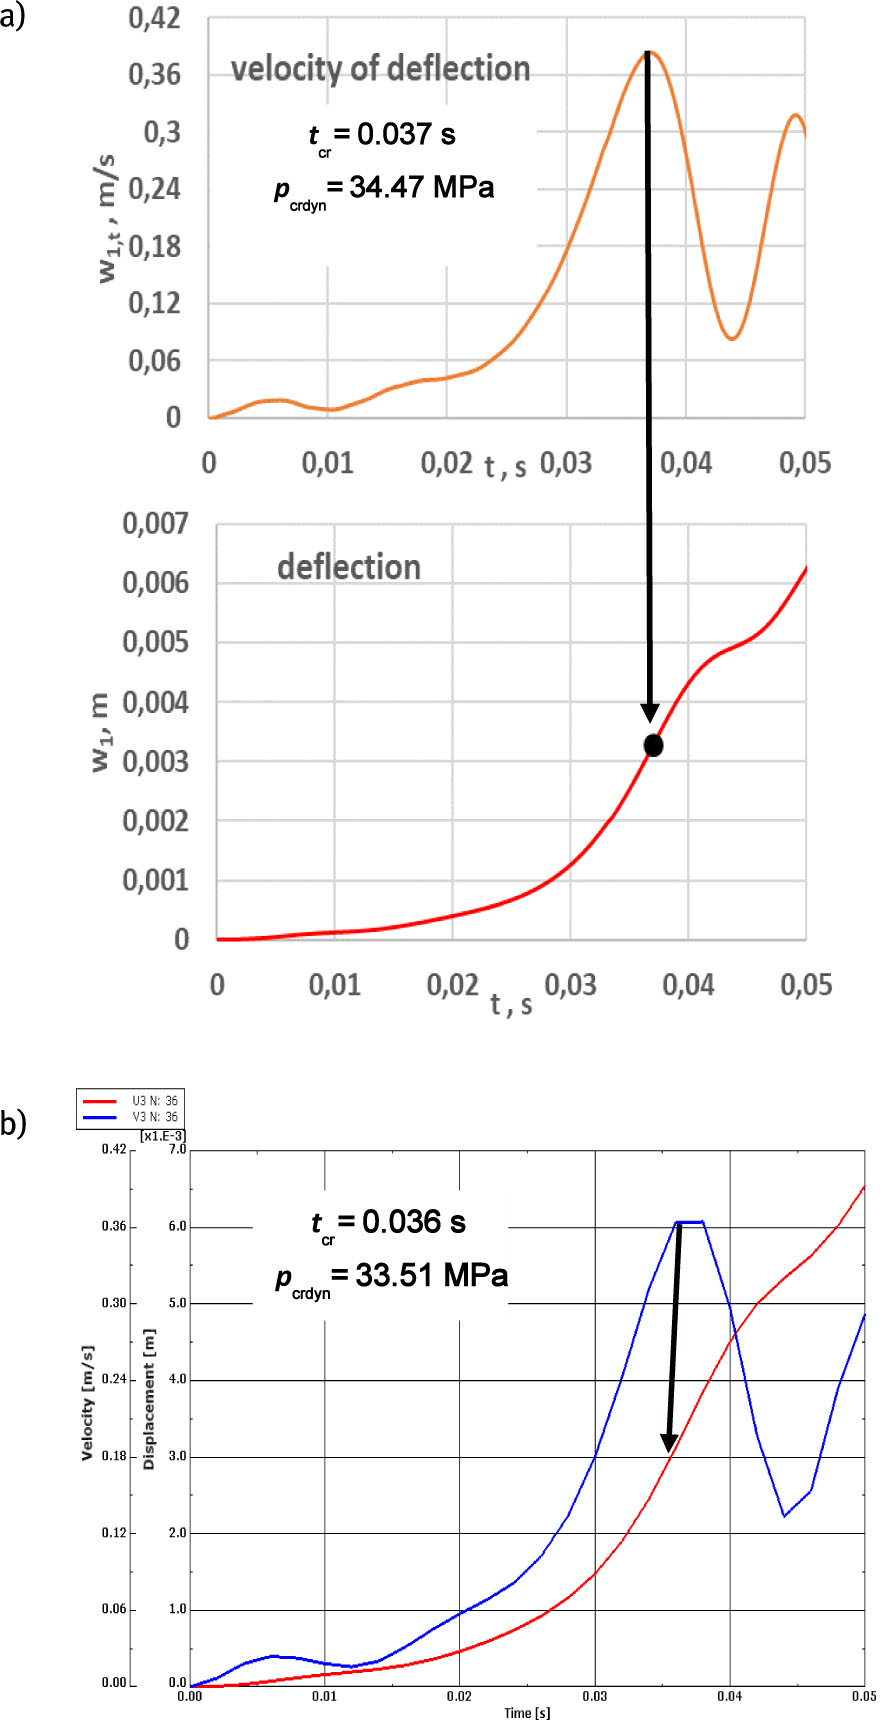
Figure 9
Time histories of deflections and velocity of deflections for a) FDM plate model and b) FEM plate model m = 0, ξ2 = 1 loaded mechanically and thermally with a positive temperature gradient and rate a = 200 K/s.
Table 7
Values of critical dynamic mechanical loads pcrdyn and corresponding temperature differences ΔTb for the axisymmetrical m = 0 FDM plate model thermomechanically loaded and imperfected with ratio ξ2 = 2.
| a (K/s) ΔT (K) | pcrdyn (MPa)/DTb (K) | |
|---|---|---|
| ξ2 = 2 | ||
| Positive gradient | Negative gradient | |
| 0 | 35.8/0 | 35.8/0 |
| 200 | 34.47/7.4 | 37.26/8.0 |
| 800 | 27.12/23.2 | 42.39/36.4 |
| ΔT = 800 | 22.36/19.2 | 44.25/38.0 |
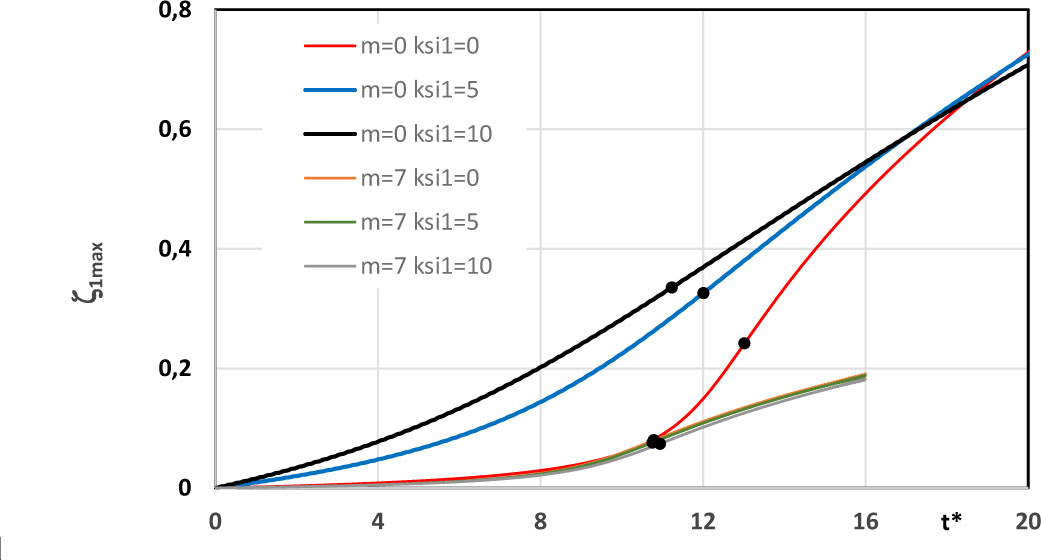
Figure 10
Deflections of the FDM plate model ξ2 = 1 loaded thermally with a positive temperature gradient and rate a = 200 K/s versus calibrating number ξ1.
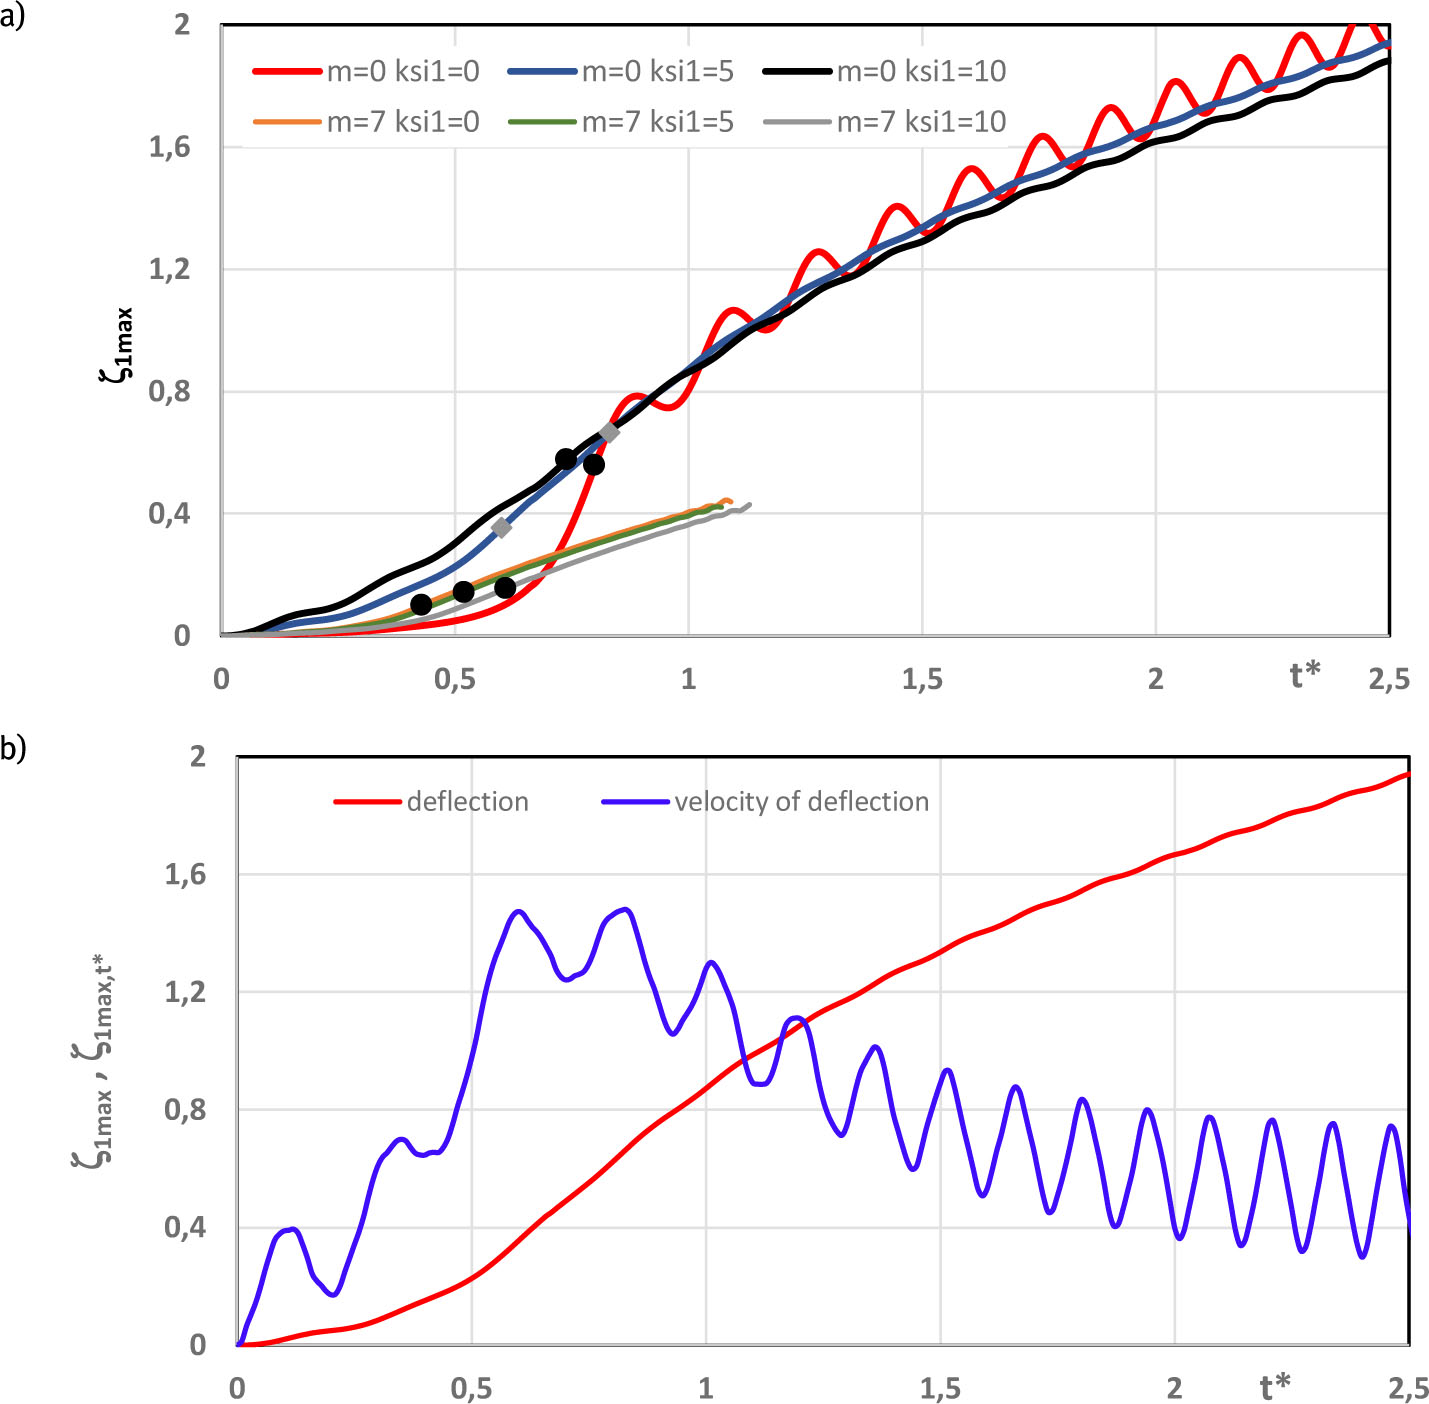
Figure 11
Deflections of the FDM plate model ξ2 = 1 loaded thermomechanically with a positive temperature gradient and rate a = 200 K/s versus a) different values of calibrating number ξ1 and b) value of calibrating number ξ1 = 5 for axisymmetrical plate m = 0.
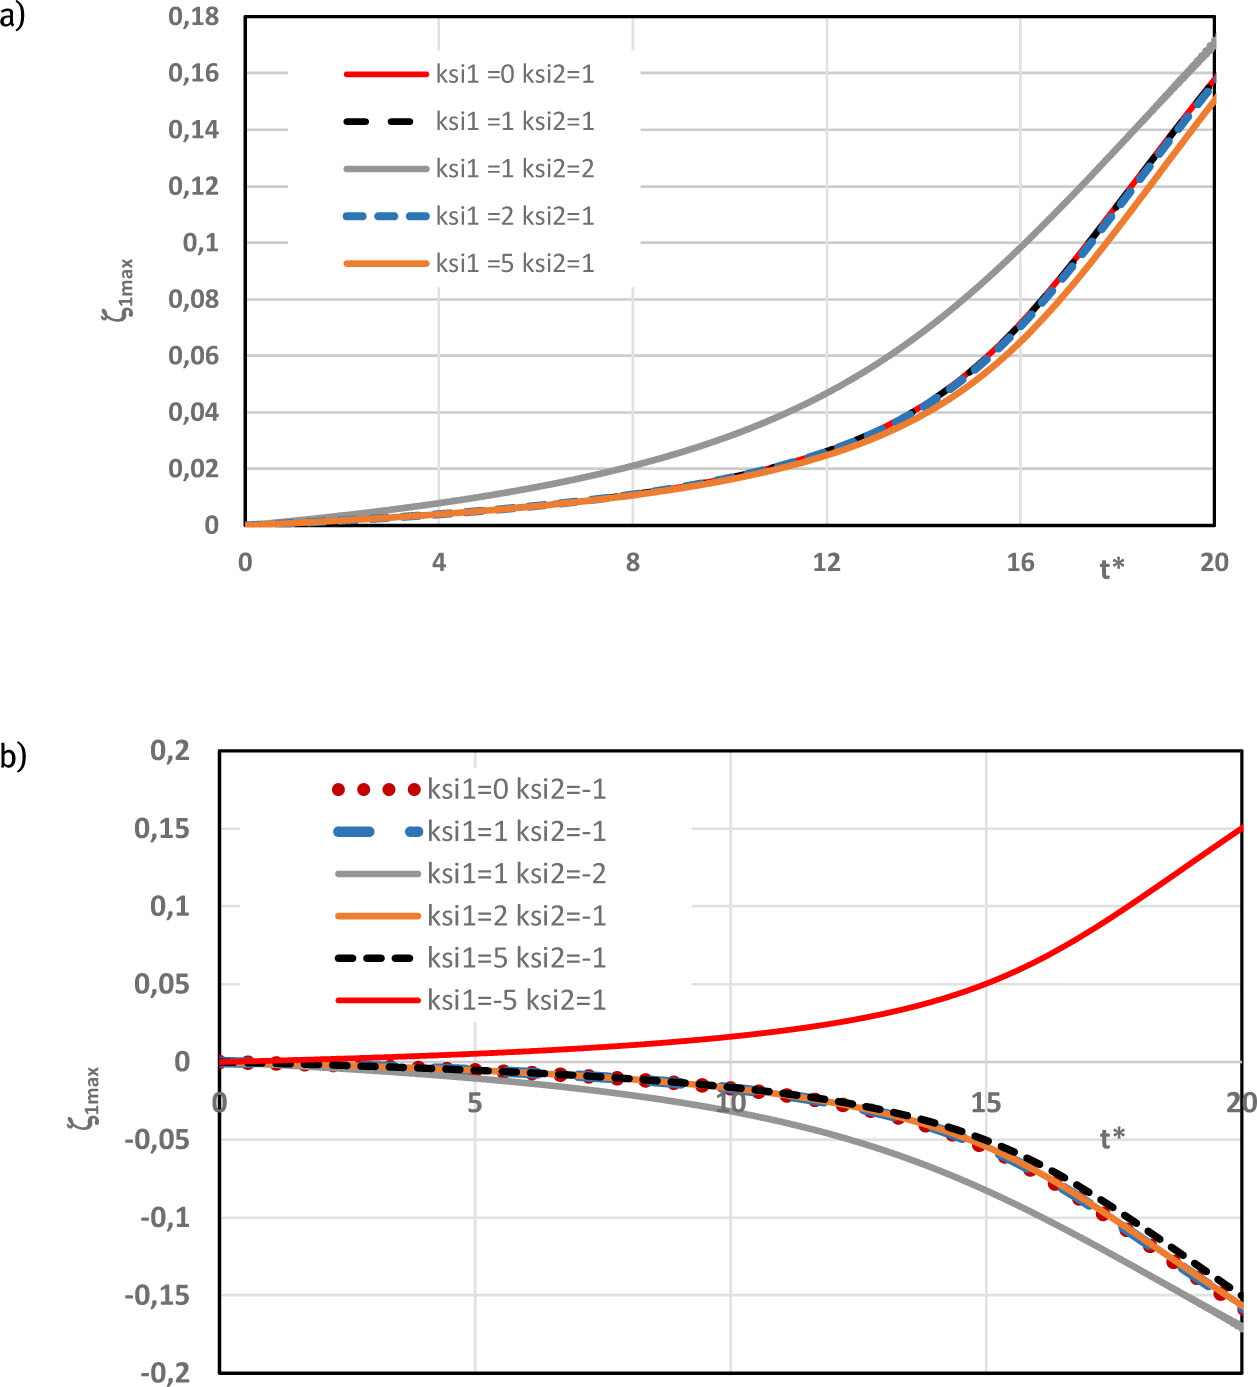
Figure 12
Deflections of the FDM waved m = 7 plate model loaded thermally with a positive temperature gradient and rate a = 200 K/s for mixed values of imperfection ratios: a) only positive, b) positive and negative.
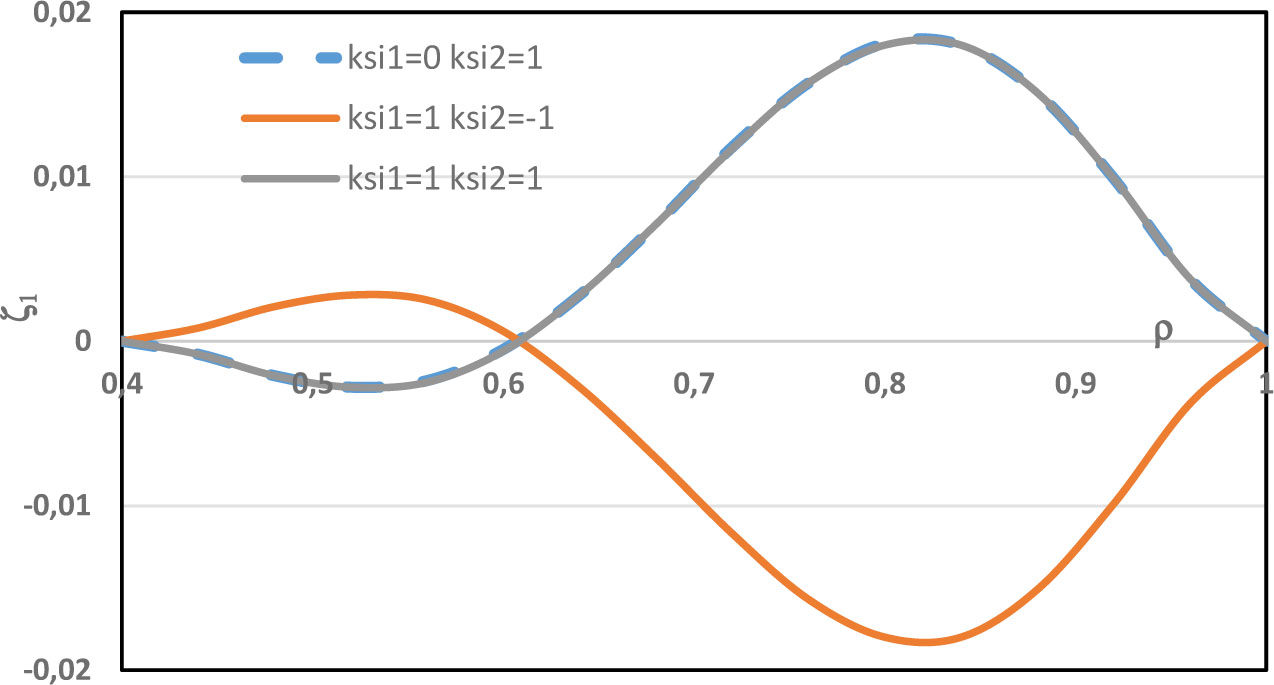
Figure 13
Influence of imperfection ratios on the distribution of the FDM waved m = 7 plate model deflections in a radial direction caused by thermal loading with a positive temperature gradient and rate a = 200 K/s.