
Table 1
Examples of factors indicating the geotechnical conditions.
| Type of monitoring | Geotechnical condition indicators |
|---|---|
| Subsurface displacement monitoring | Displacement value (mm) |
| Displacement increment speed (mm/day) | |
| Deformation depth (m) | |
| Deformation character | |
| Pore-water pressure monitoring | Pore-water pressure value (bar) |
| Pressure increment speed (bar/day) | |
| Sensor installation depth (m b.g.l.) | |
| Temperature (°C) | |
| Surface displacement monitoring | Horizontal displacement value (mm) |
| Benchmark subsidence value (mm) | |
| Displacement increment speed (mm/day) | |
| Displacement azimuth (°) | |
| Soil subsidence monitoring | Subsidence value (mm) |
| Deformation increment speed (mm/day) | |
| Groundwater table monitoring | Groundwater table depth (cm) |
| Groundwater table depth differences in successive measurements (cm) | |
| In situ observations | Visual changes on slope surfaces |
| Rate of changes |
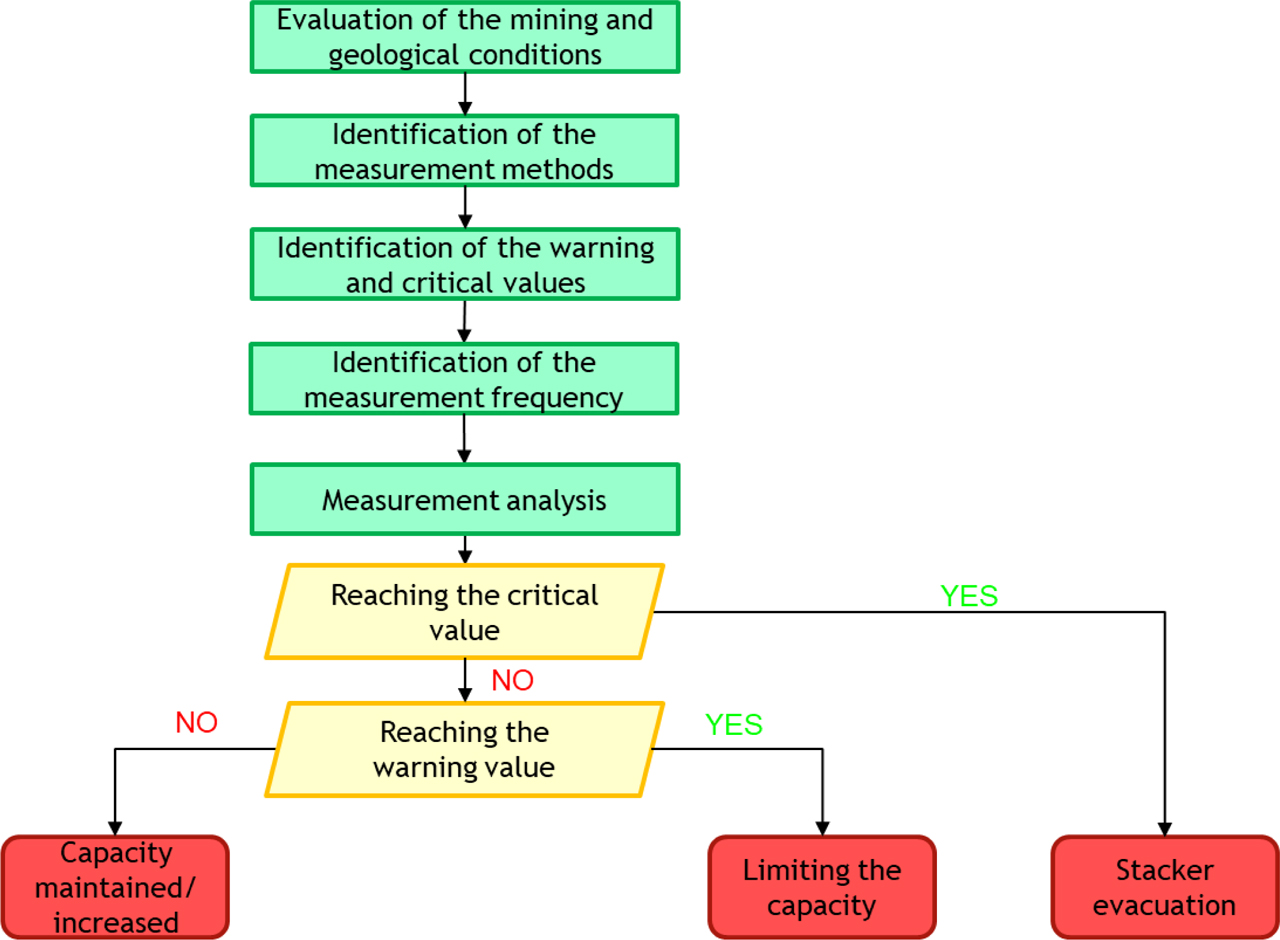
Figure 1
The procedure of the observation method for the control of stacker capacity.
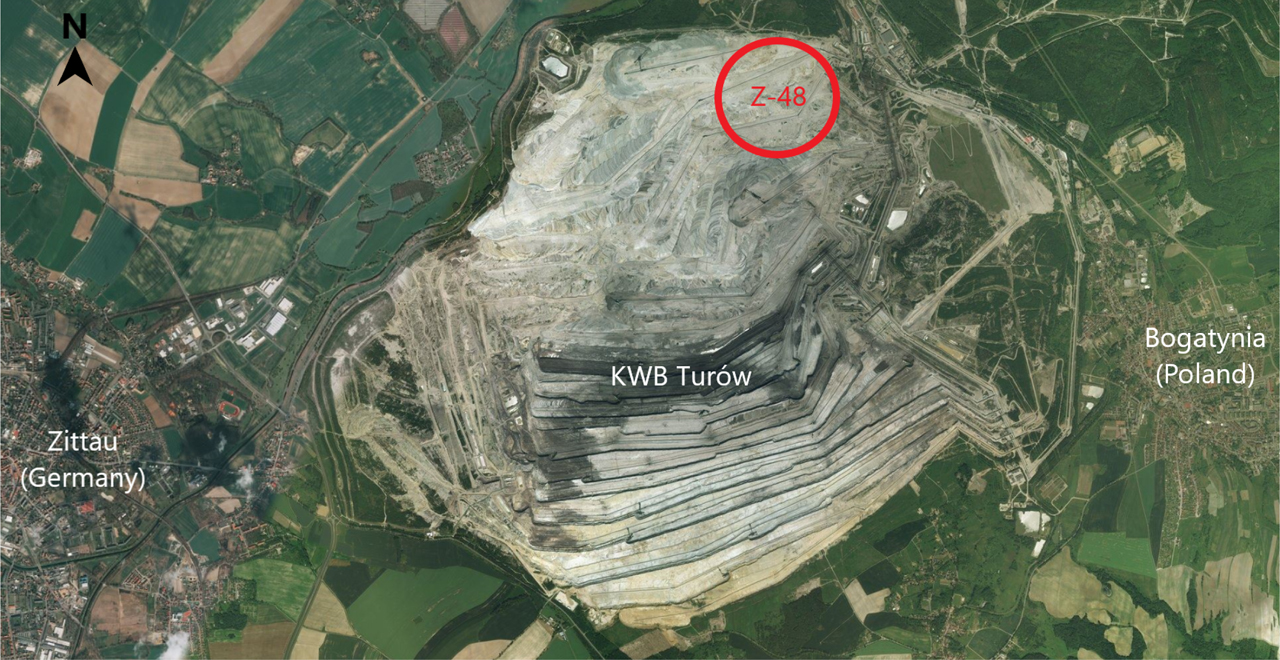
Figure 2
Operating area of stacker Z-48 in 2019 (Bing Maps).
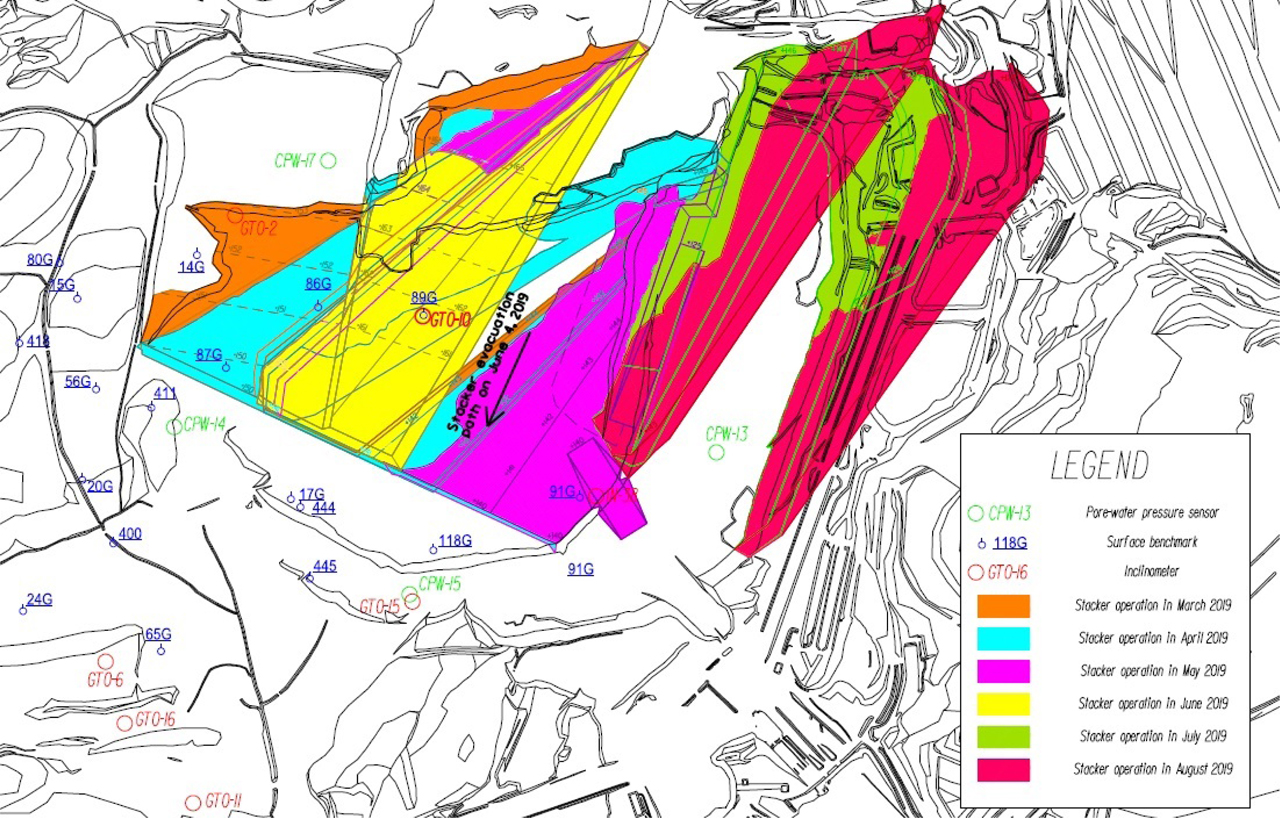
Figure 3
Operating area of stacker Z-48 with inclinometer locations.
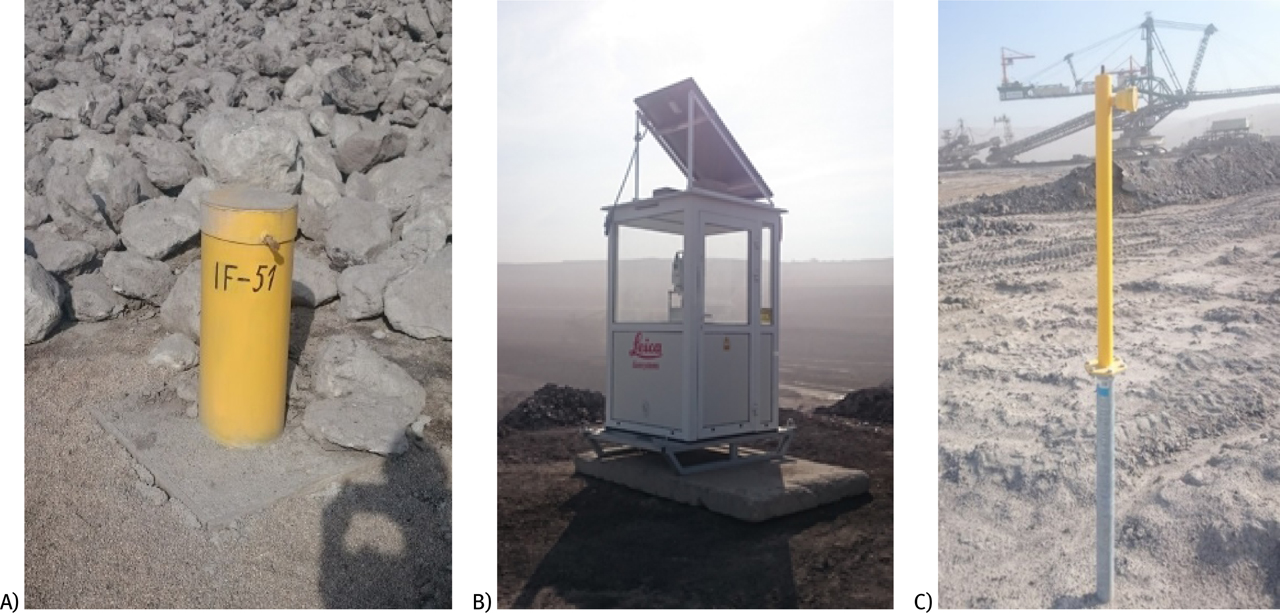
Figure 4
(A) Inclinometer, (B) box of the GeoMoS system, (C) the GeoMoS benchmark.
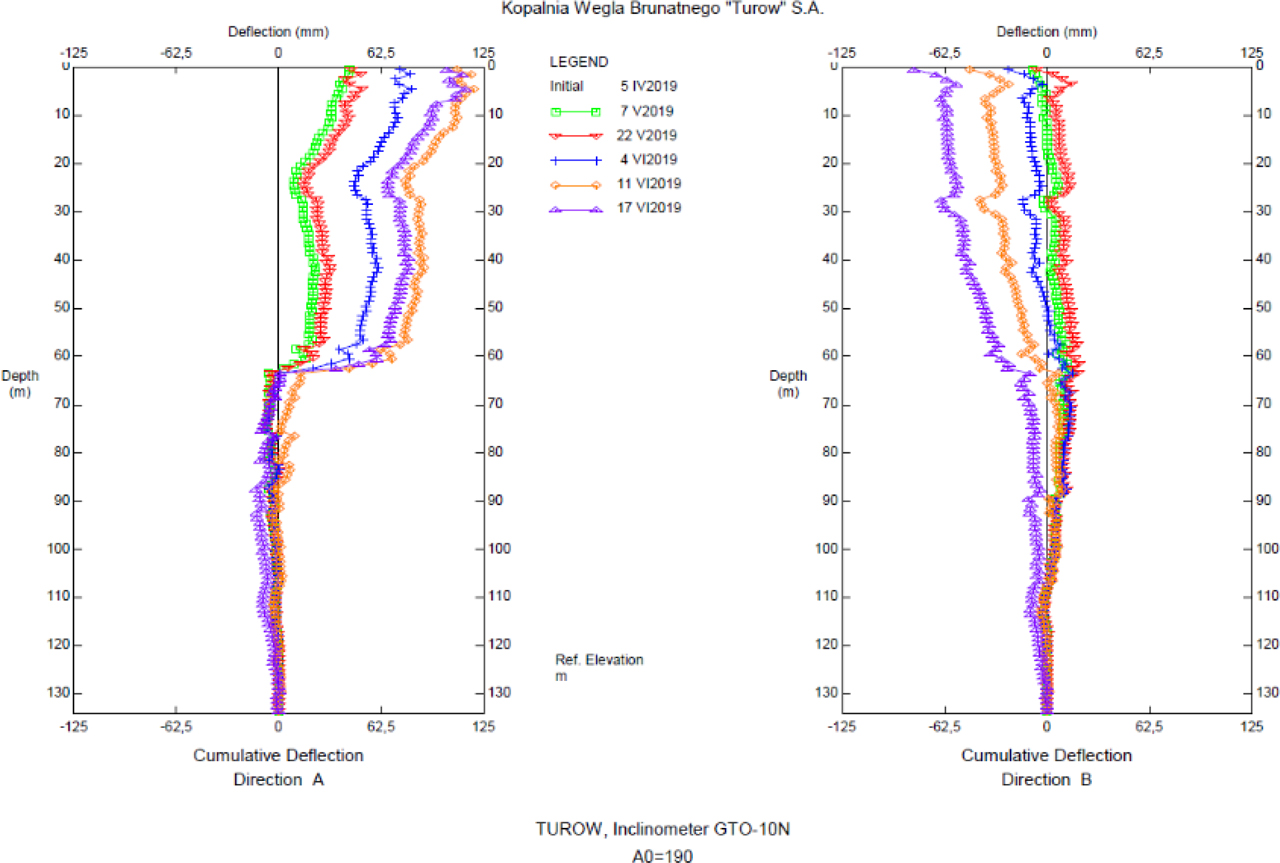
Figure 5
Subsurface displacements on inclinometer GTO-10.
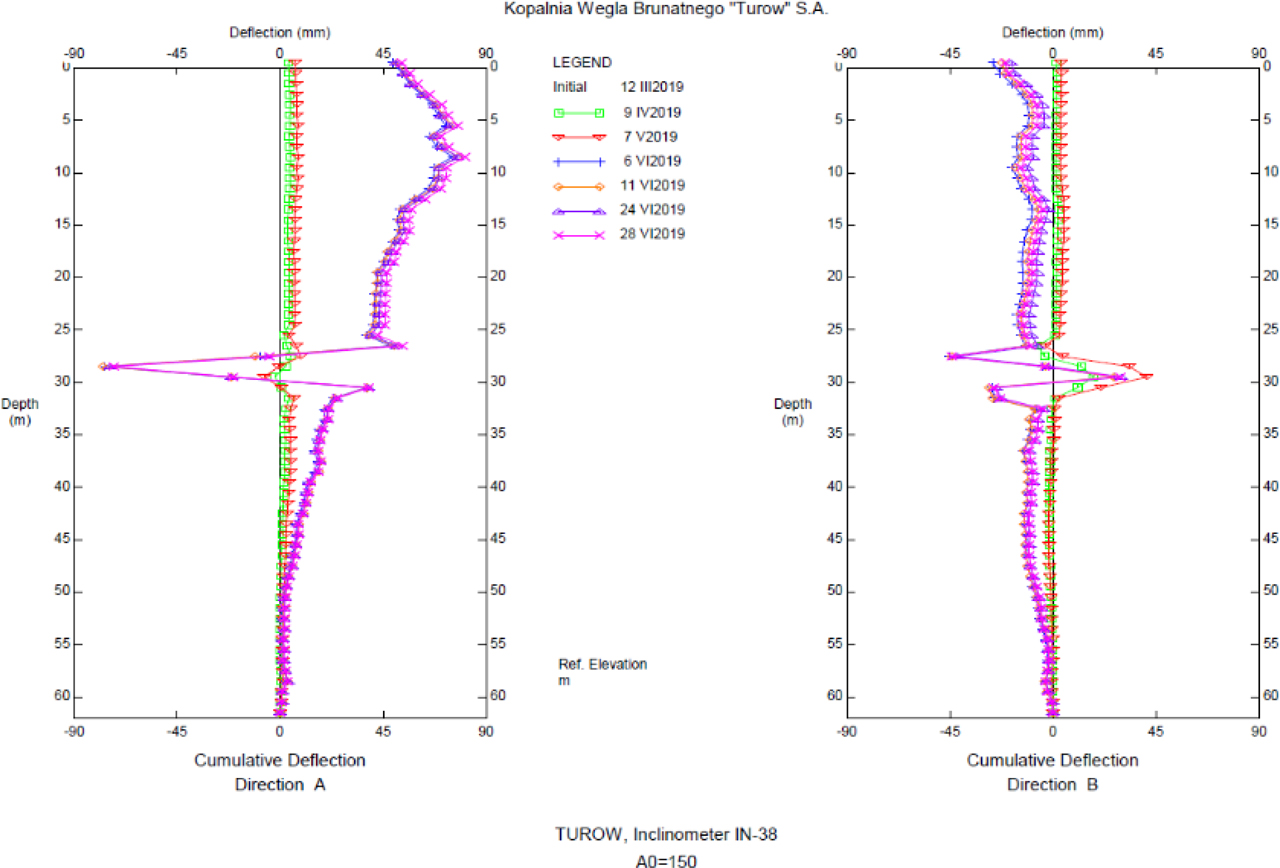
Figure 6
Subsurface displacements on inclinometer IN-38.
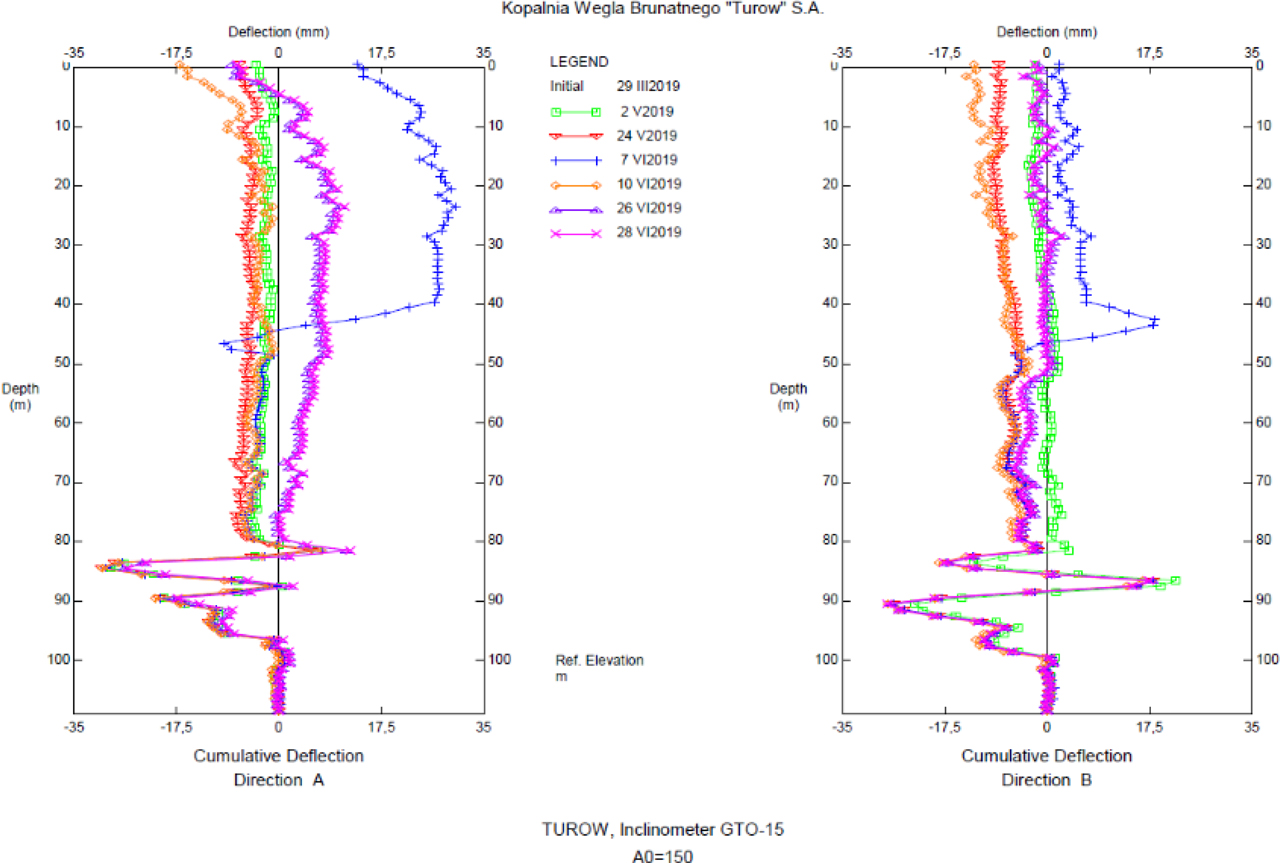
Figure 7
Subsurface displacements on inclinometer GTO-15.
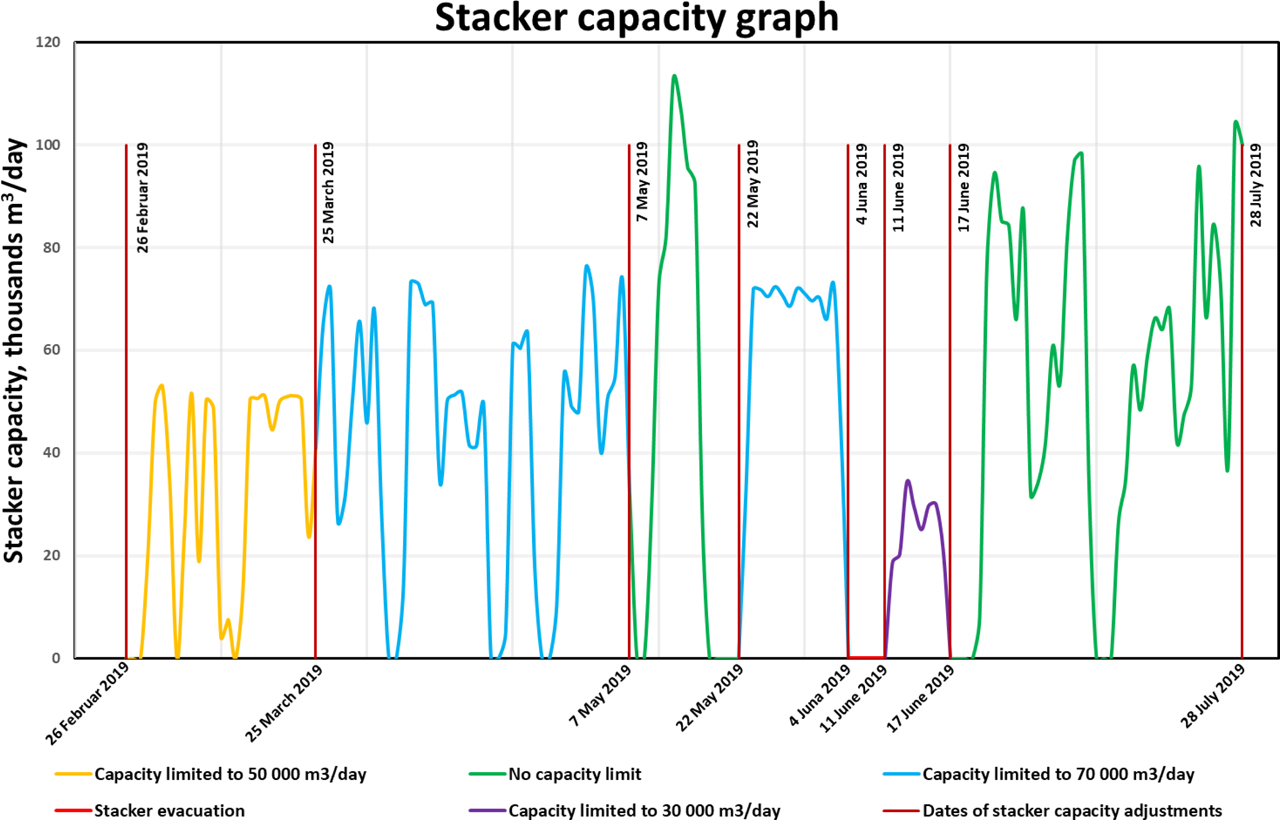
Figure 8
Capacity of stacker Z-48 over the analyzed 5-month period.