
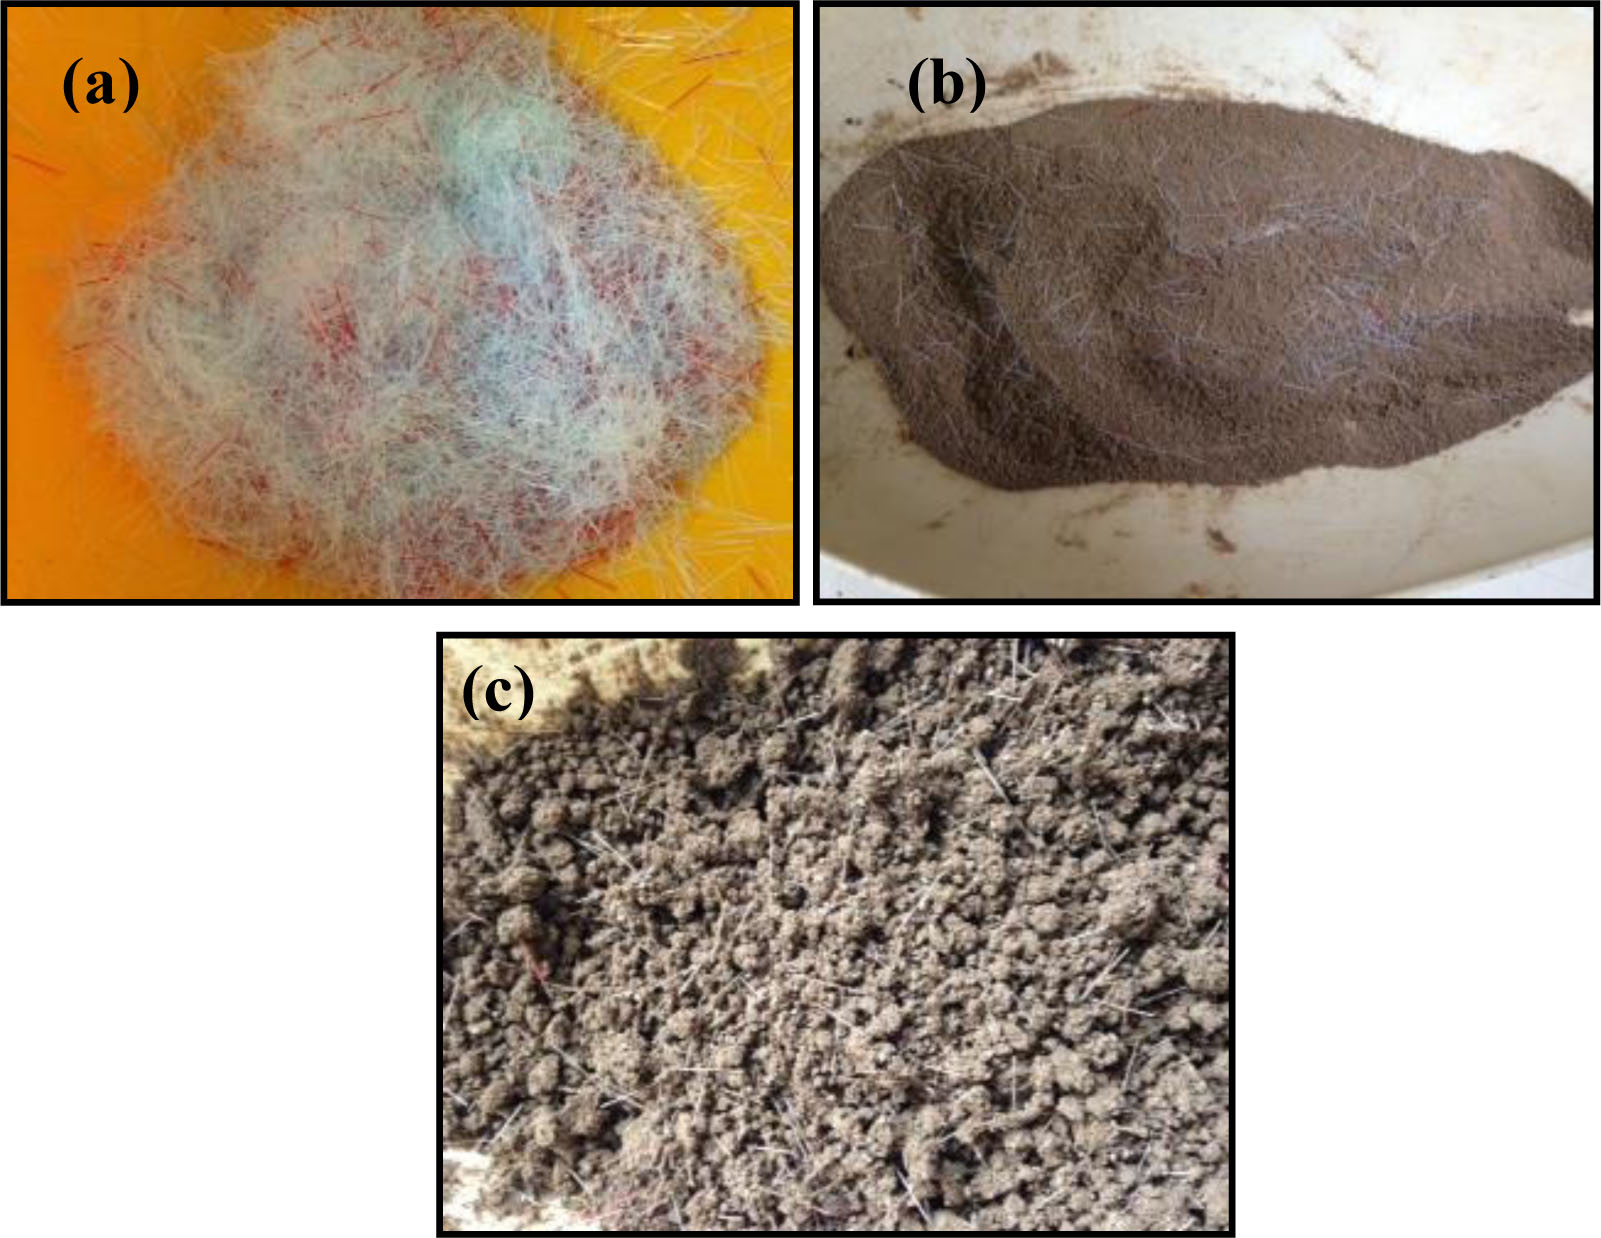
Figure 1
Toothbrush bristles (a) after cutting, (b) after mixing with dry soil, (c) after adding optimum water content.
Table 1
Some properties of clayey soil used in tests.
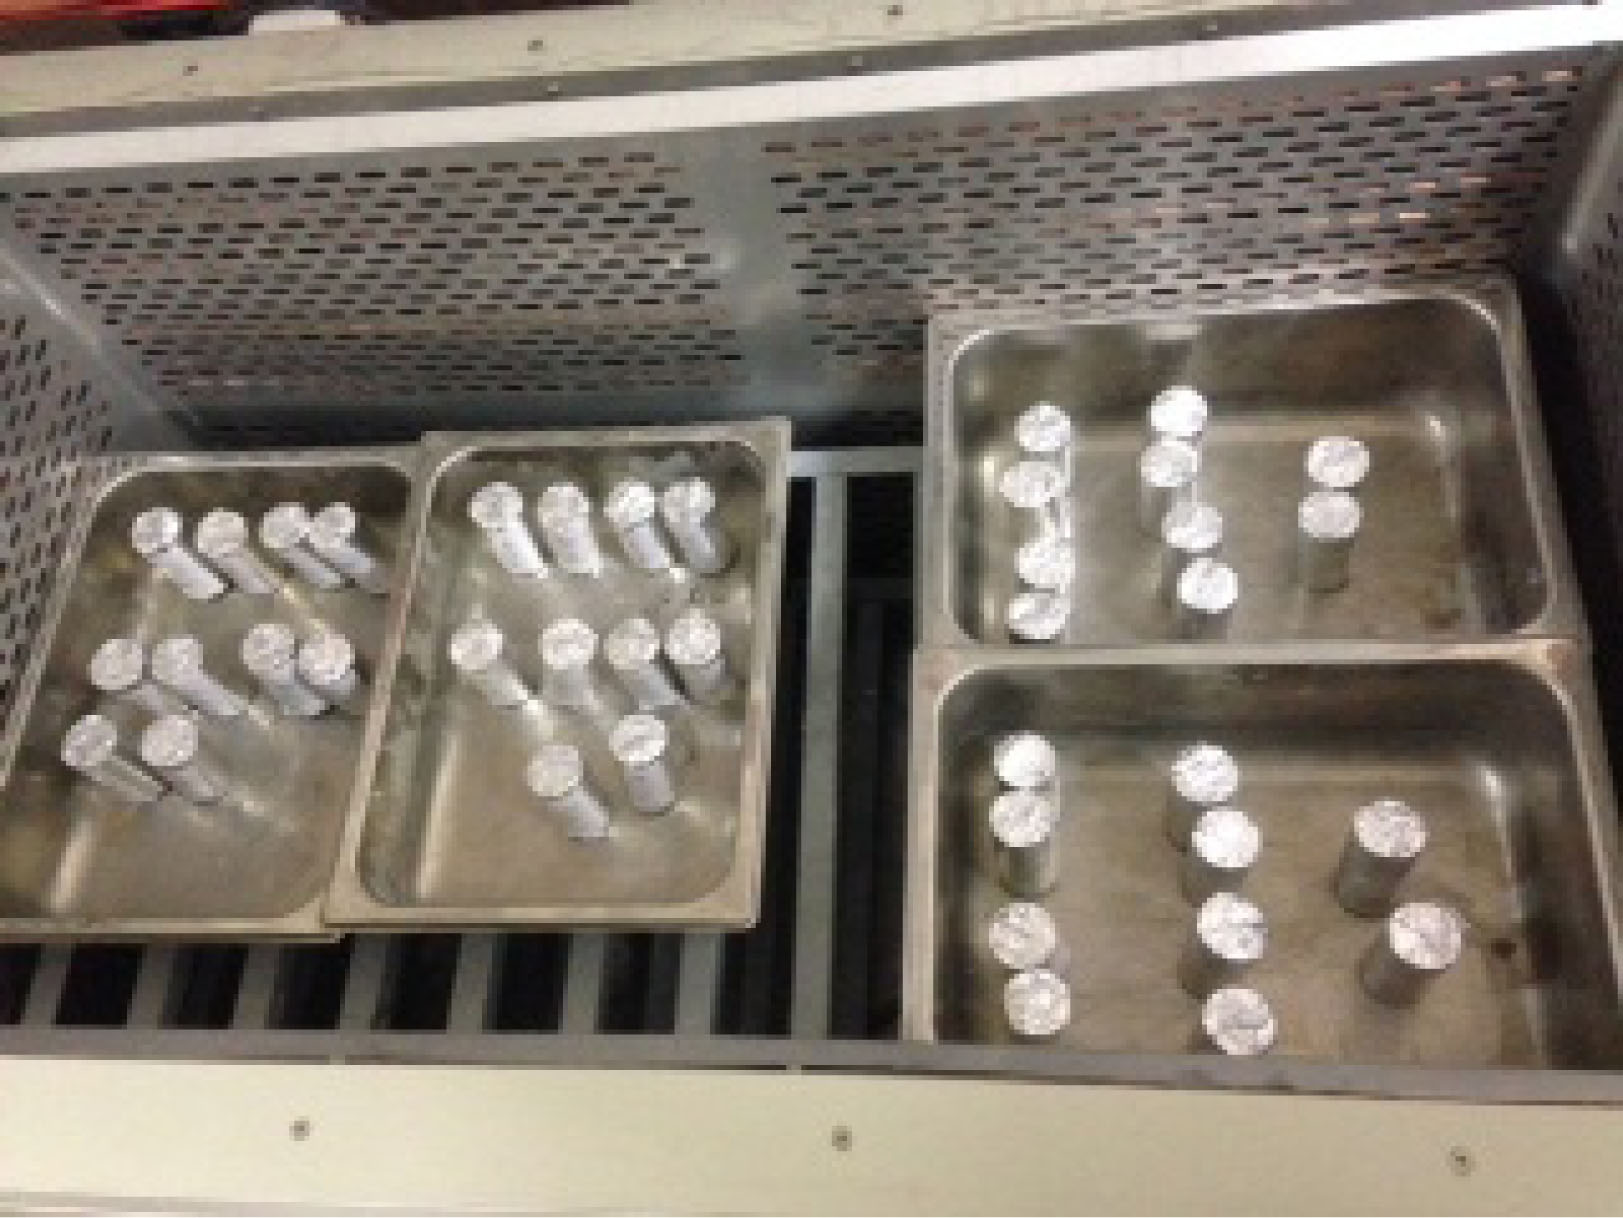
Figure 2
Closed system full automatic freezing–thawing test cabinet.
Table 2
Prepared samples, WTB ratios and number of freezing–thawing cycles.
| Sample Description | WTB Ratio (%) | Number of Cycles |
|---|---|---|
| Unreinforced | 0.0 | 0–3–6–9–12 |
| Reinforced-1 | 0.2 | 0–3–6–9–12 |
| Reinforced-2 | 0.4 | 0–3–6–9–12 |
| Reinforced-3 | 0.6 | 0–3–6–9–12 |
| Reinforced-4 | 0.8 | 0–3–6–9–12 |
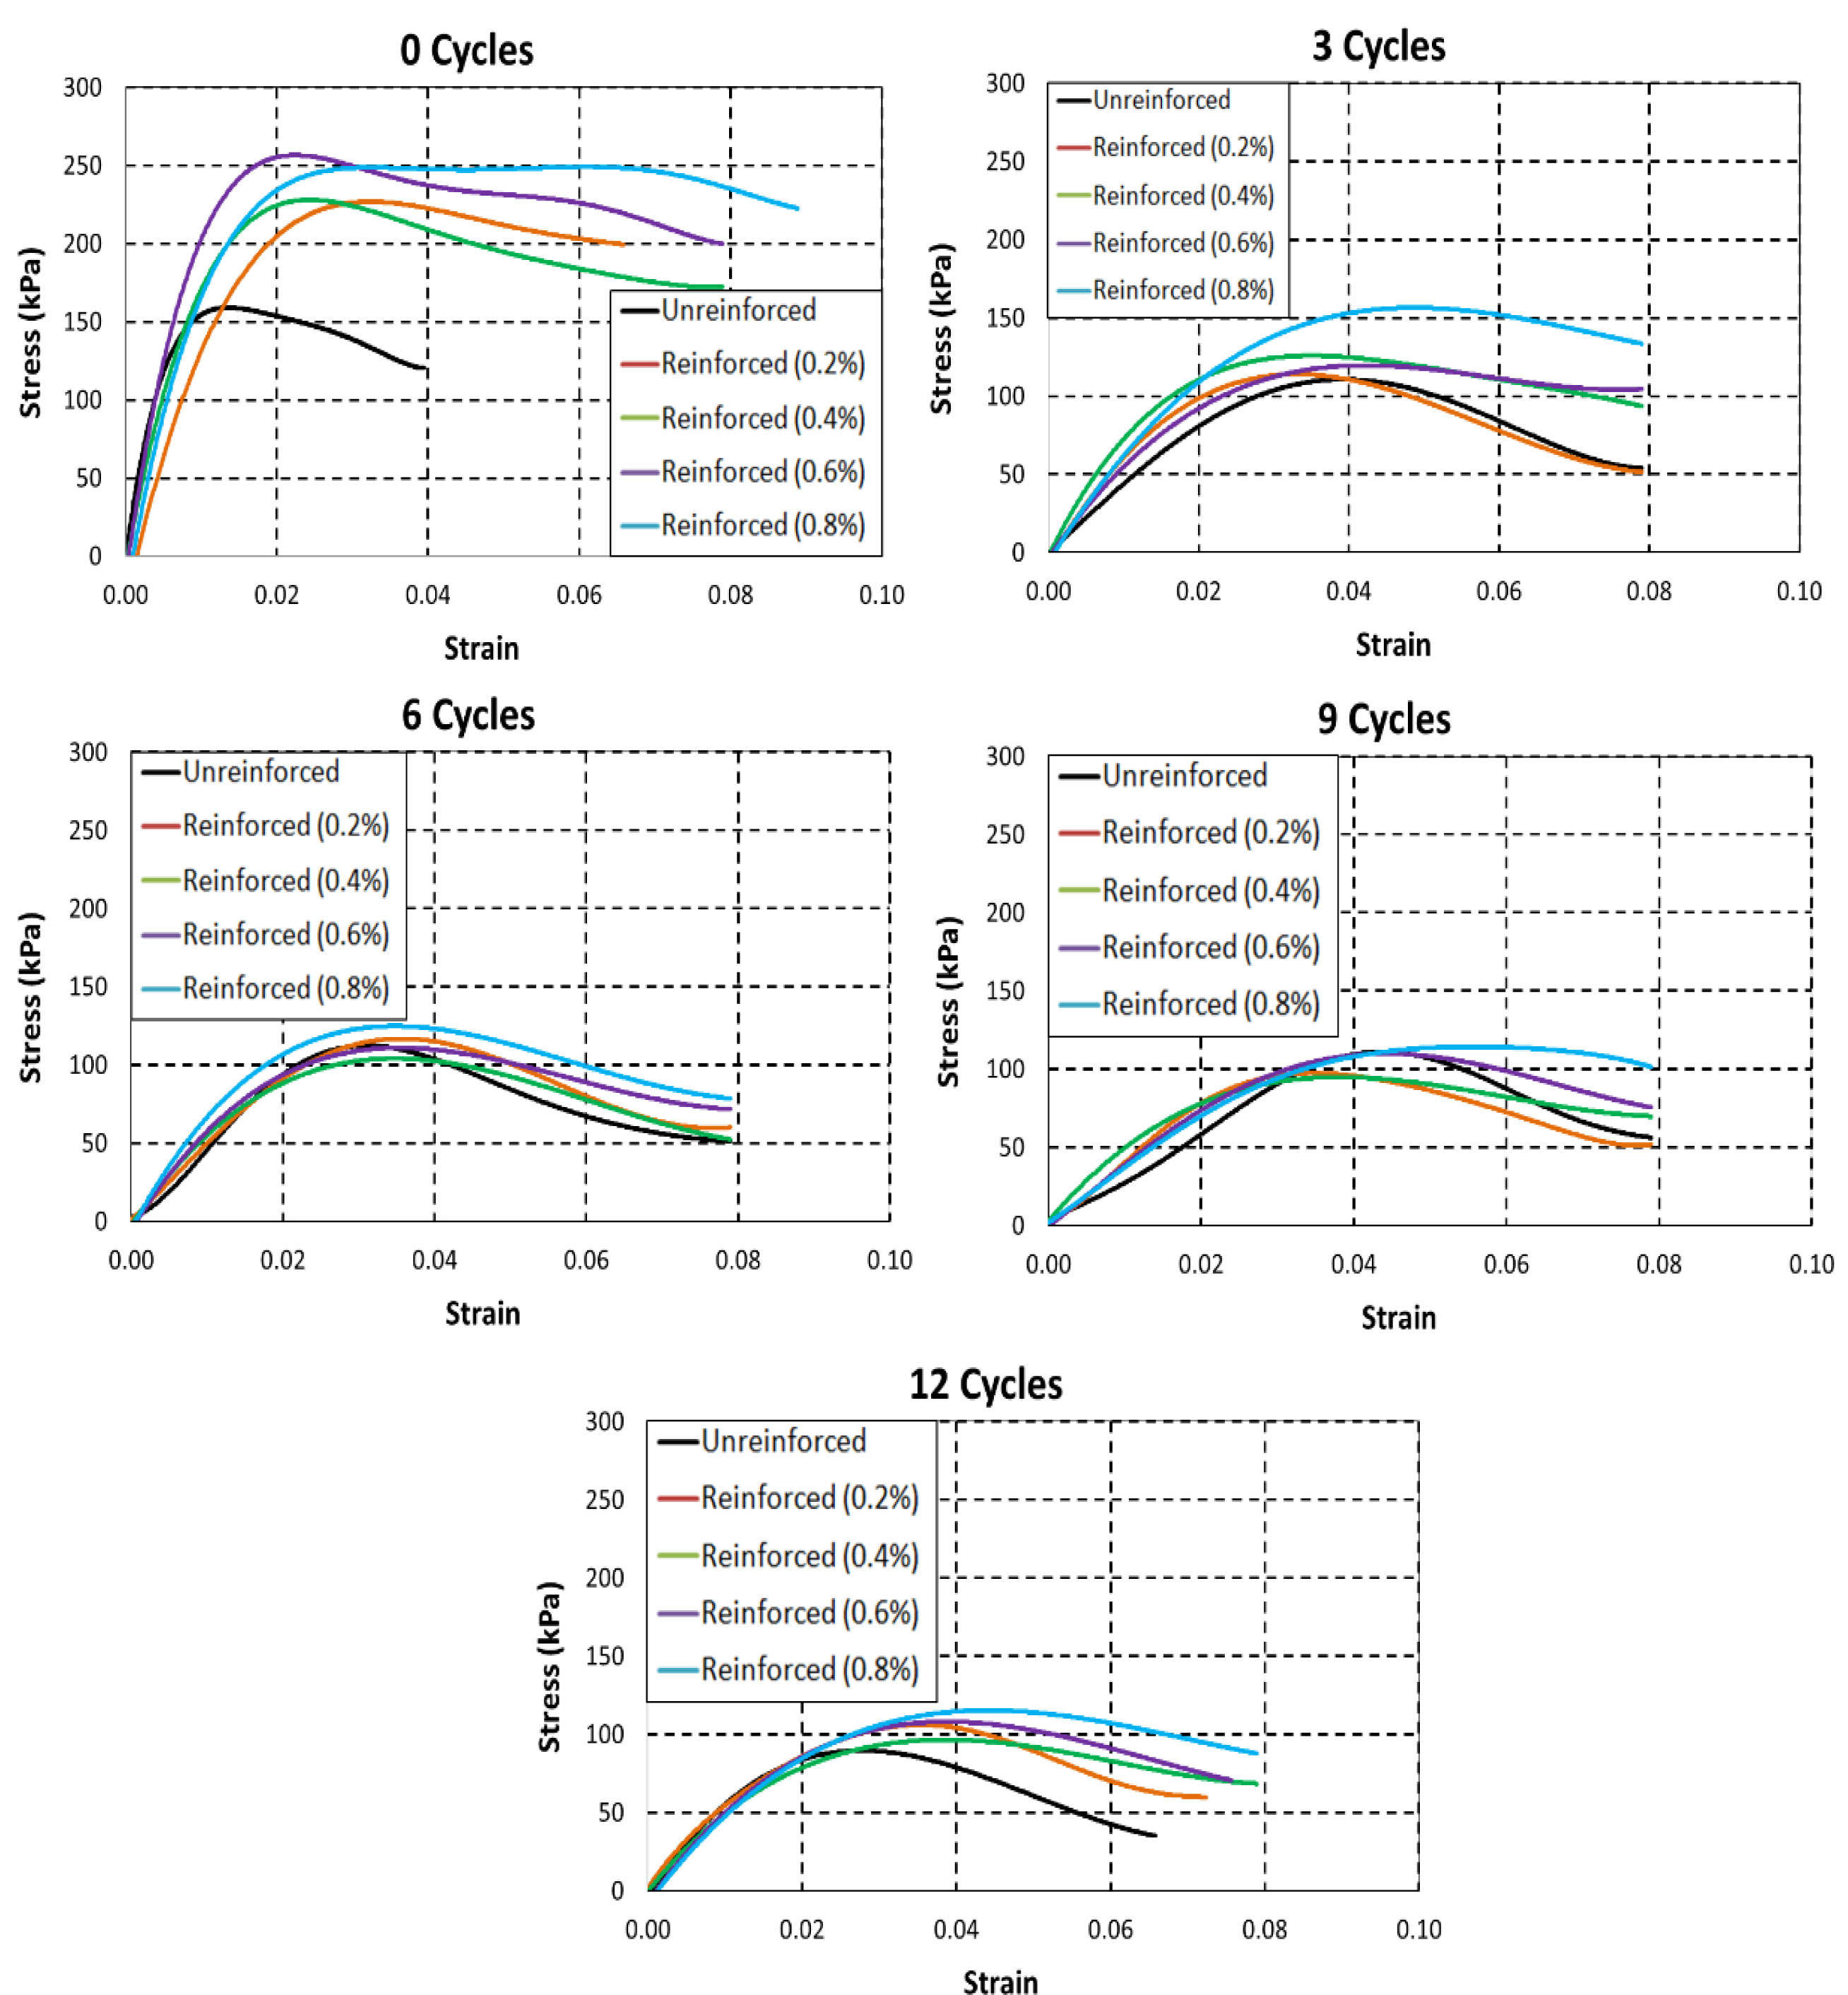
Figure 3
Stress–strain curves of samples at (a) 0 cycle, (b) 3 cycles, (c) 6 cycles, (d) 9 cycles, (e)12 cycles.
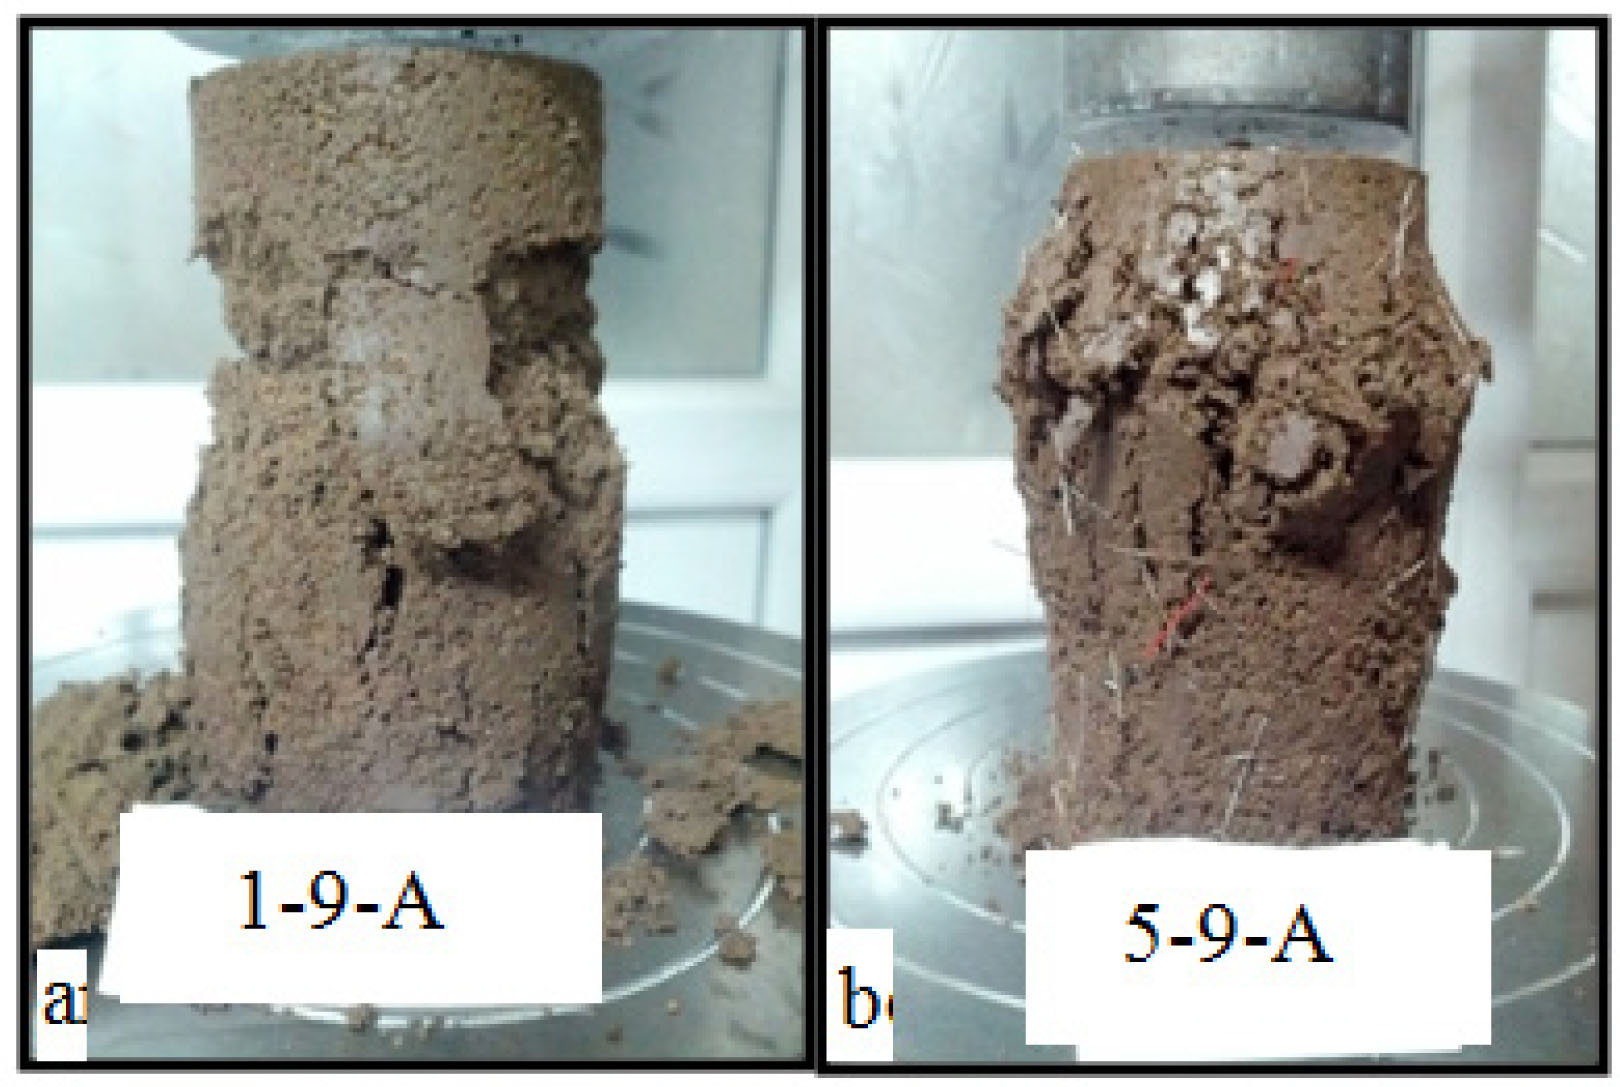
Figure 4
Unconfined compression test: (a) unreinforced sample (9 cycles), (b) reinforced sample (toothbrush bristles 0.8% ratio, 9 cycles).
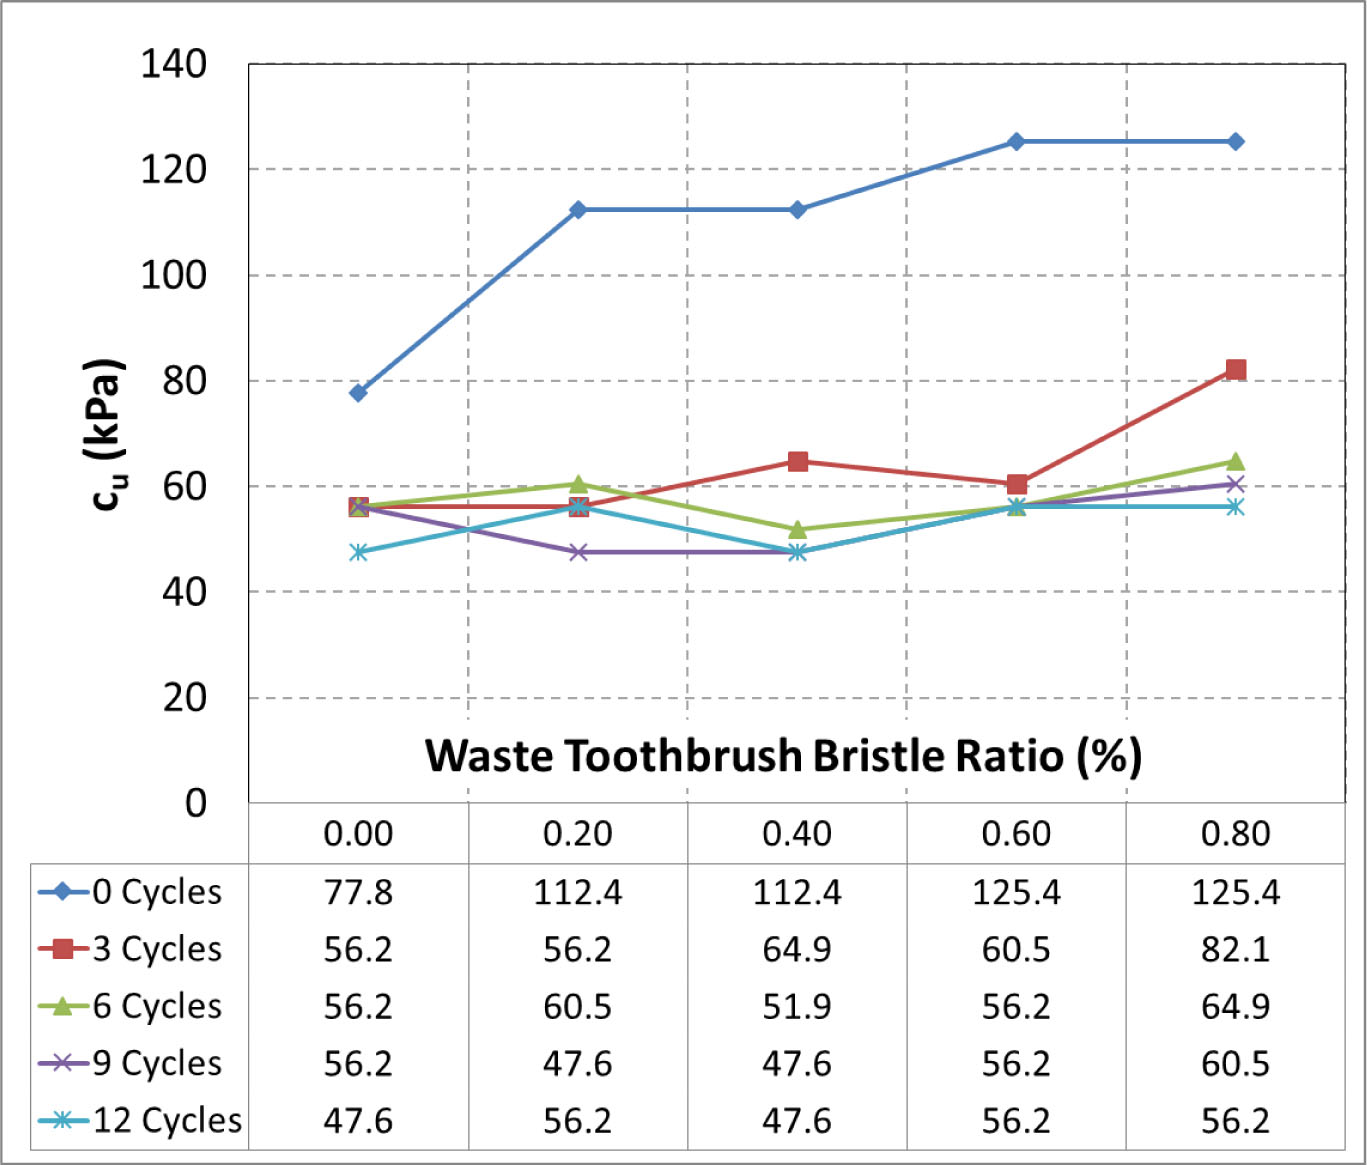
Figure 5
Waste toothbrush bristle ratio vs. undrained shear strength.
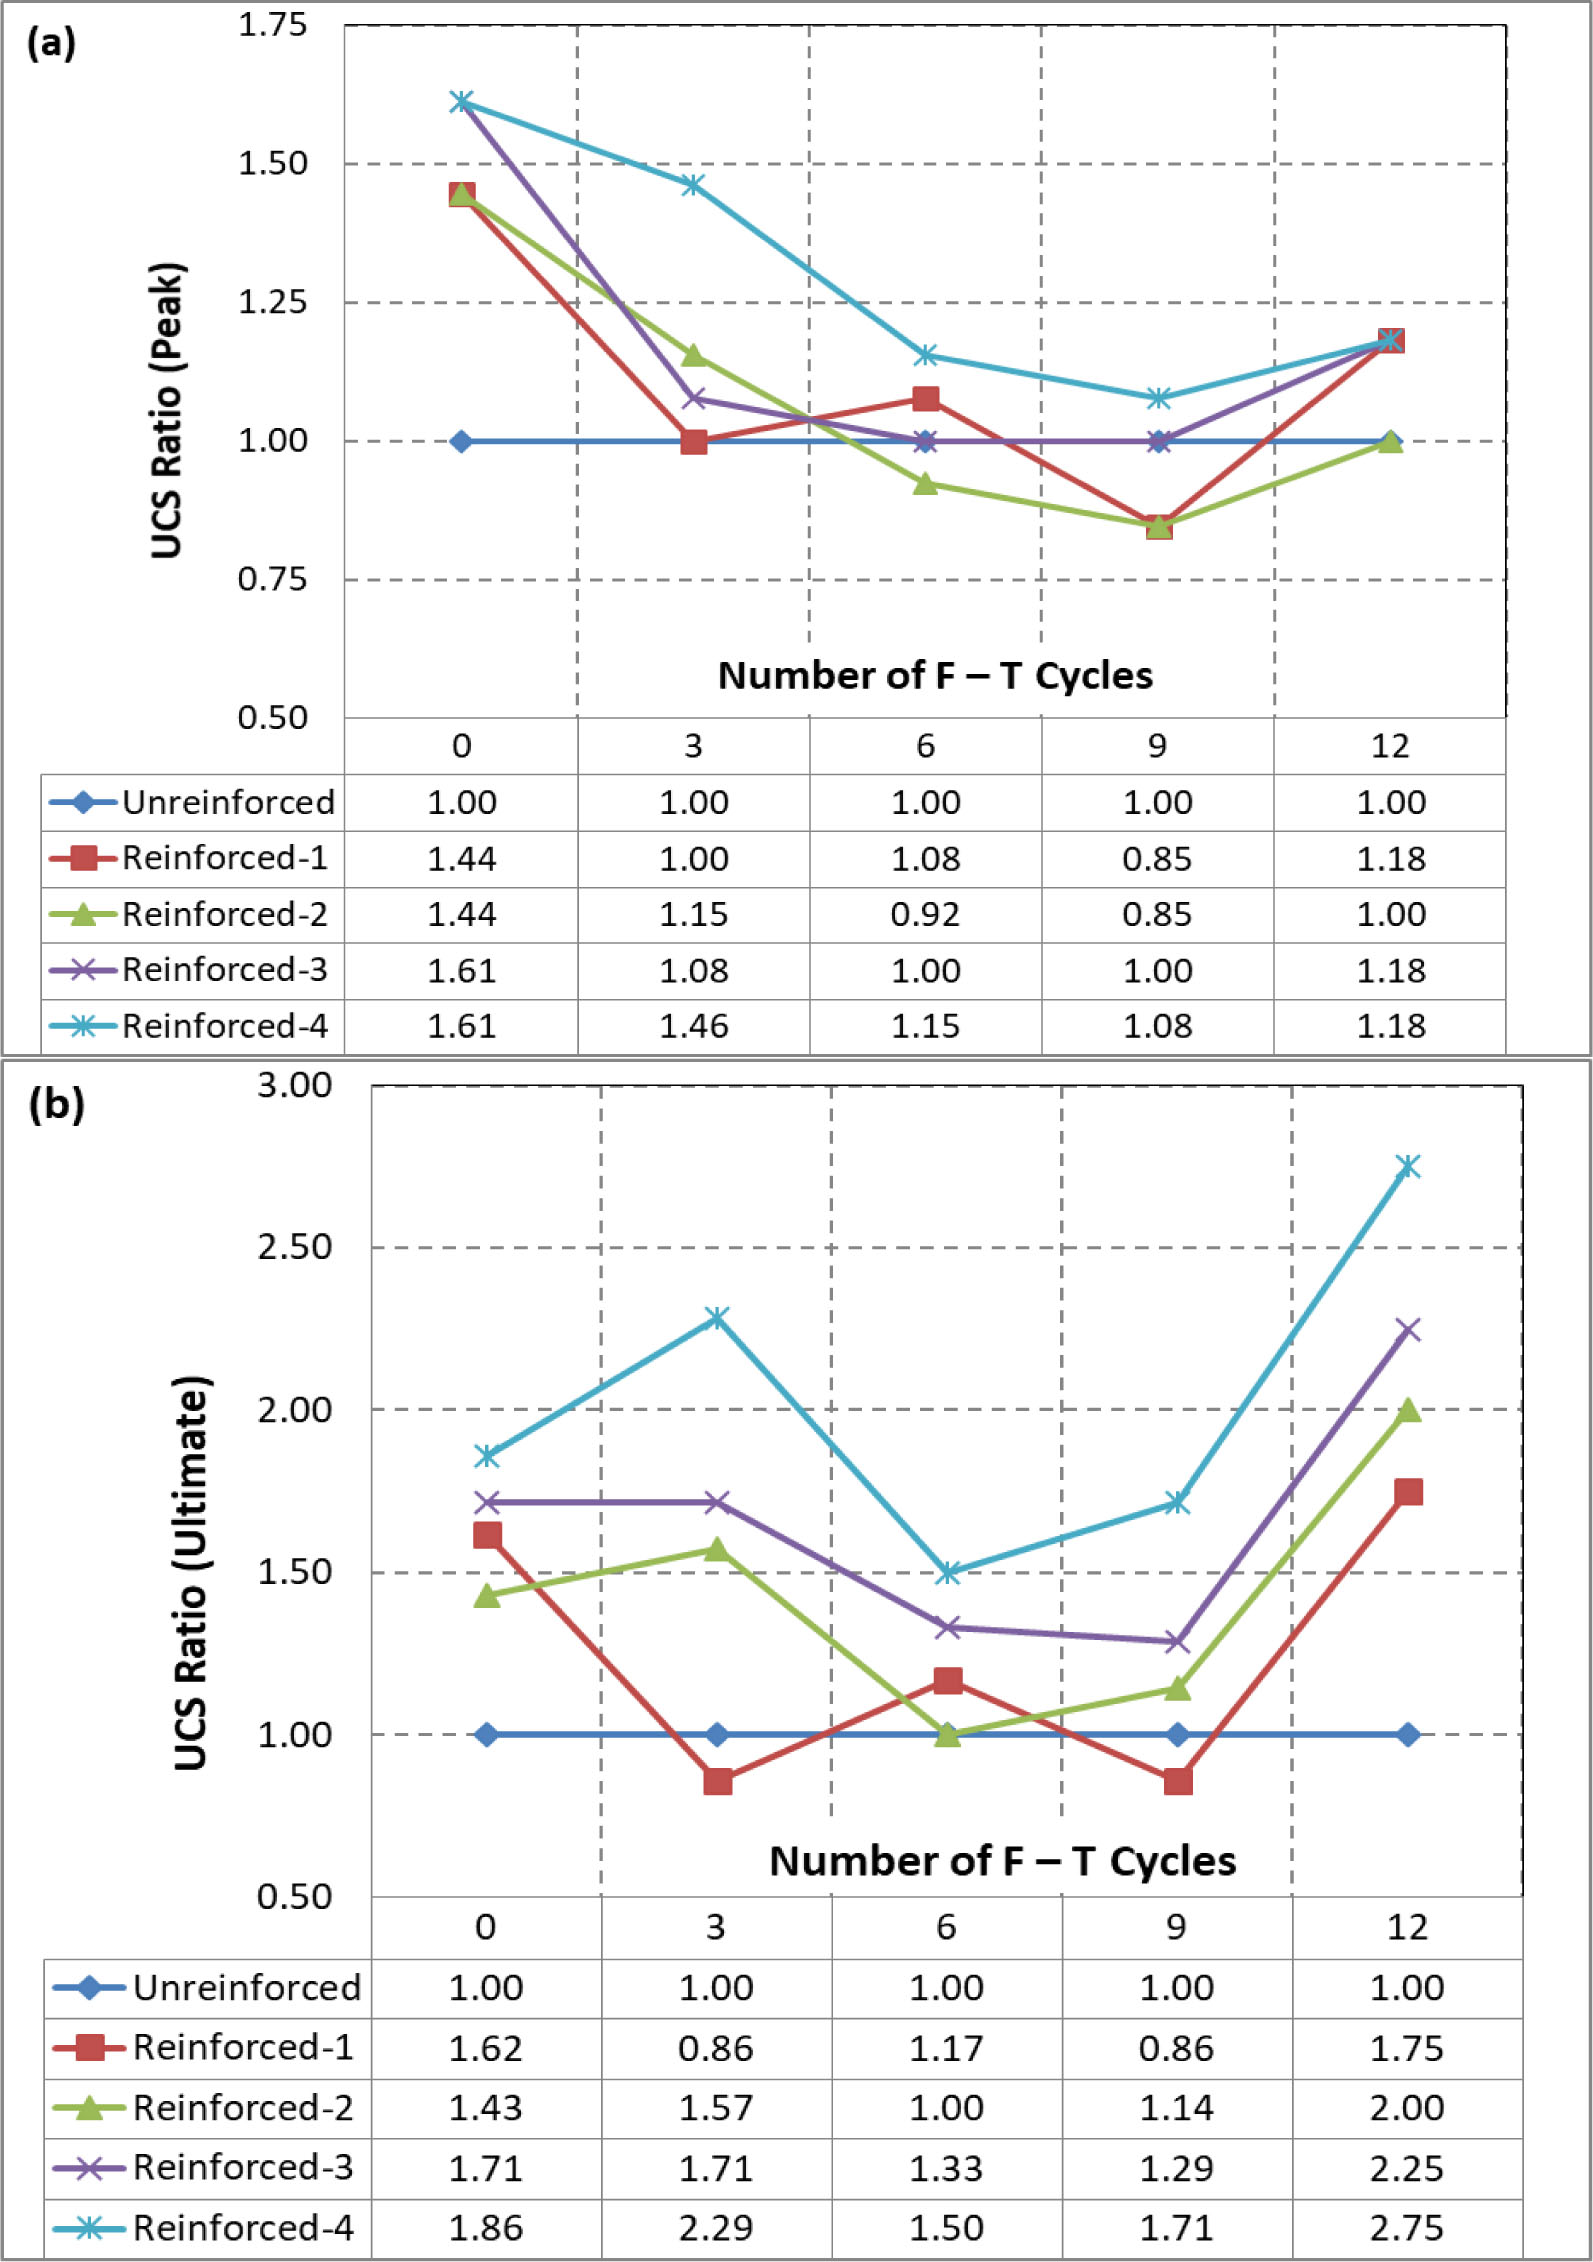
Figure 6
Relationship between (a) the peak UCS ratio, (b) the ultimate UCS ratio and freezing–thawing cycles.
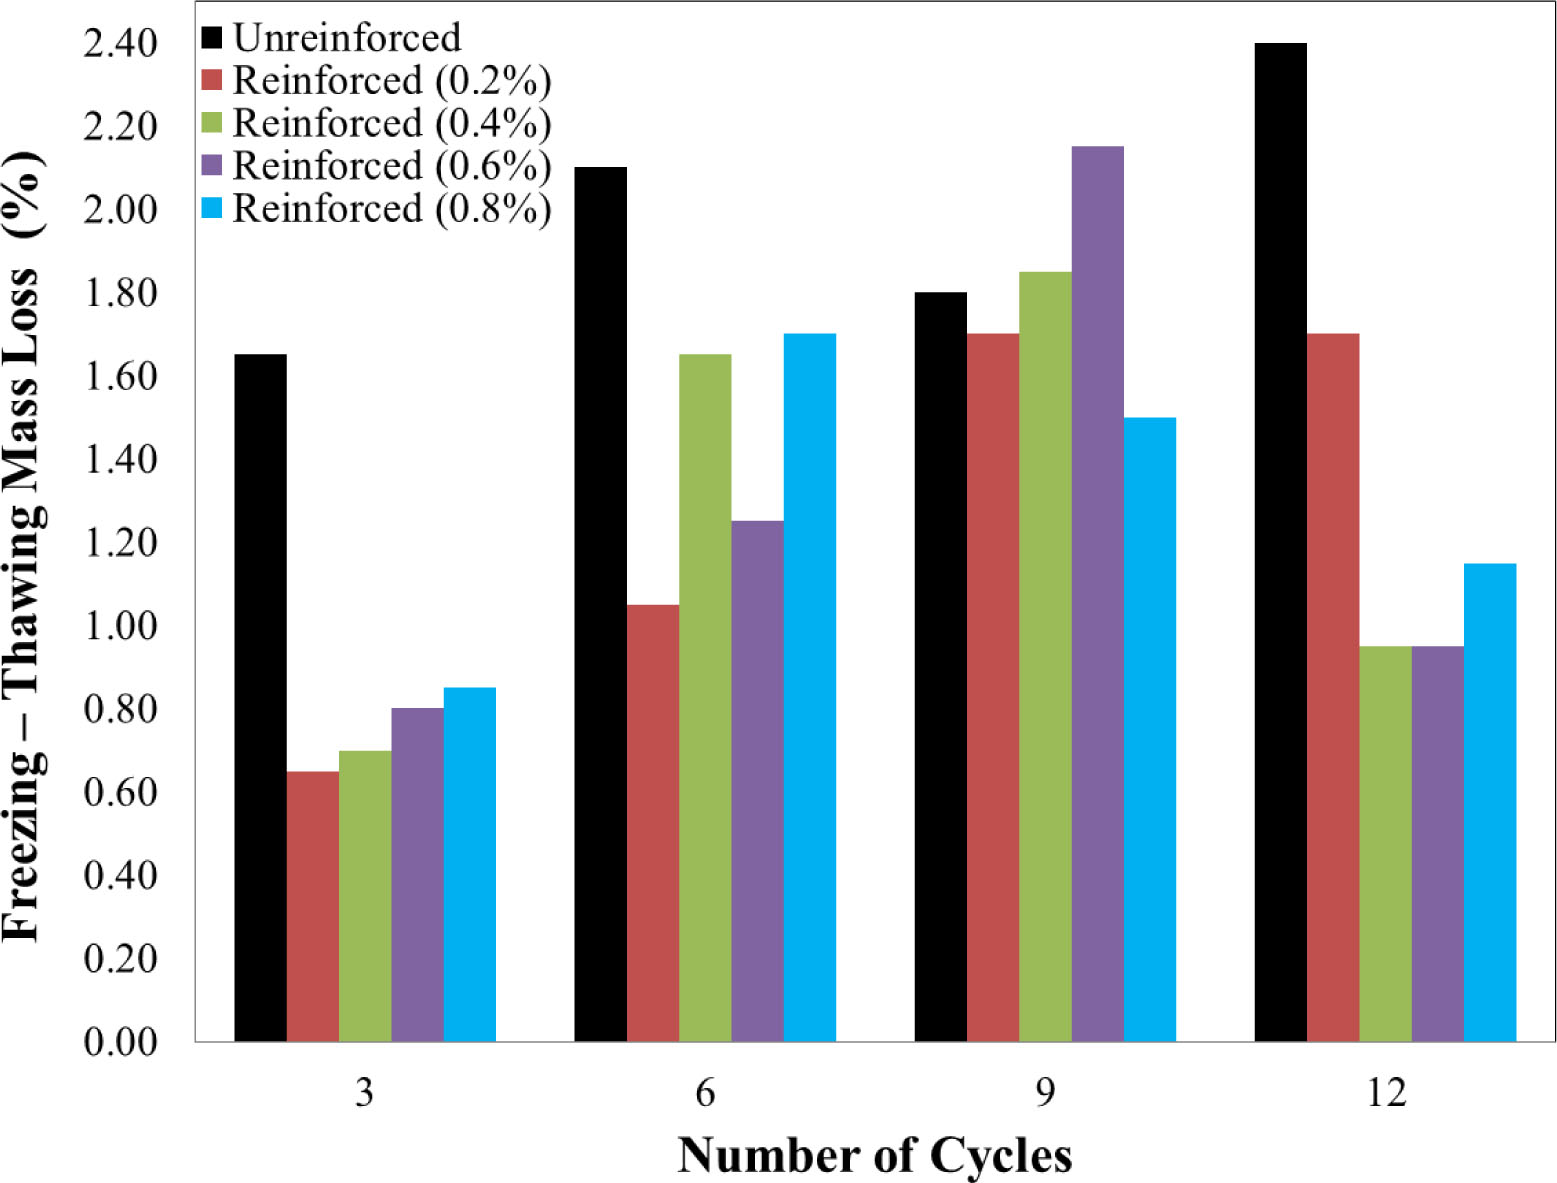
Figure 7
Relationship between FTML and freezing–thawing cycles.