
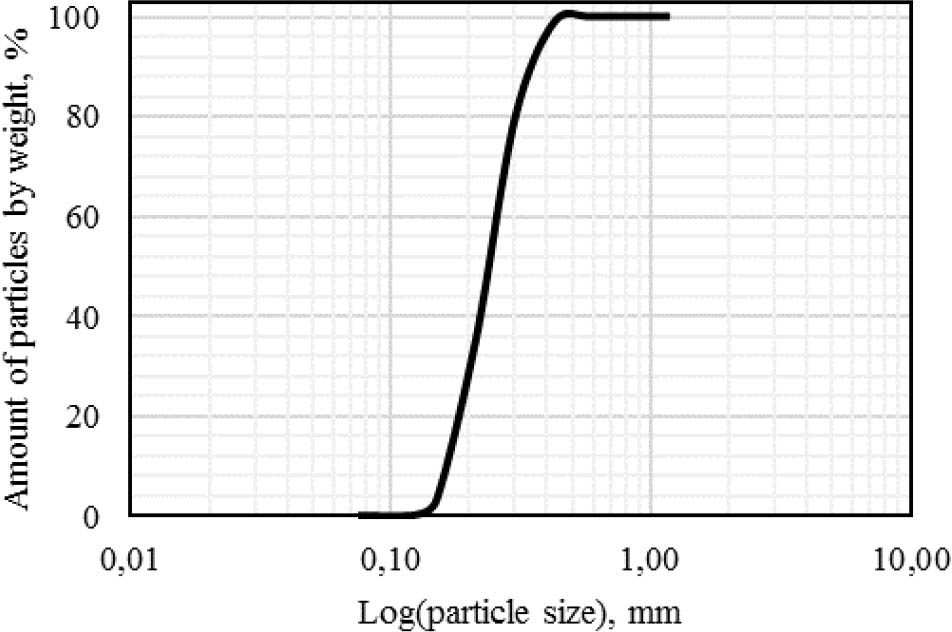
Figure 1
Granulometric curve of the investigated soil.
Table 1
The main properties of flexible and rigid geogrids (taken from the technical brochures of suppliers).
| Properties | Basetrac® Grid PP 40 | Secugrid 40/40 Q1 | Basetrac® Grid PET 40 |
|---|---|---|---|
| Nominal tensile strength (machine direction), nominal tensile strength (cross-machine direction) | ≥40 kN/m | ≥40 kN/m | ≥40 kN/m |
| Strain at nominal tensile strength | 7% | 7% | 10% |
| Durability | Predicted to be durable for a minimum of 100 years in natural soils with 4 ≤ pH ≤ 9 and soil temperatures ≤25 C if covered within 30 days after installation | Predicted to be durable for a minimum of 100 years in natural soils with 4 ≤ pH ≤ 9 and soil temperatures ≤25 C if covered within 30 days after installation | Predicted to be durable for a minimum of 100 years in natural soils with 4 ≤ pH ≤ 9 and soil temperatures ≤25 C if covered within 30 days after installation |
Table 2
Density of investigated samples.
| Sample | Density, g/cm3 |
|---|---|
| Unreinforced | 1.72–1.73 |
| Basetrac® Grid PP 40 | 1.67–1.69 |
| Secugrid 40/40 Q1 | 1.69–1.70 |
| Basetrac® Grid PET 40 | 1.69–1.72 |
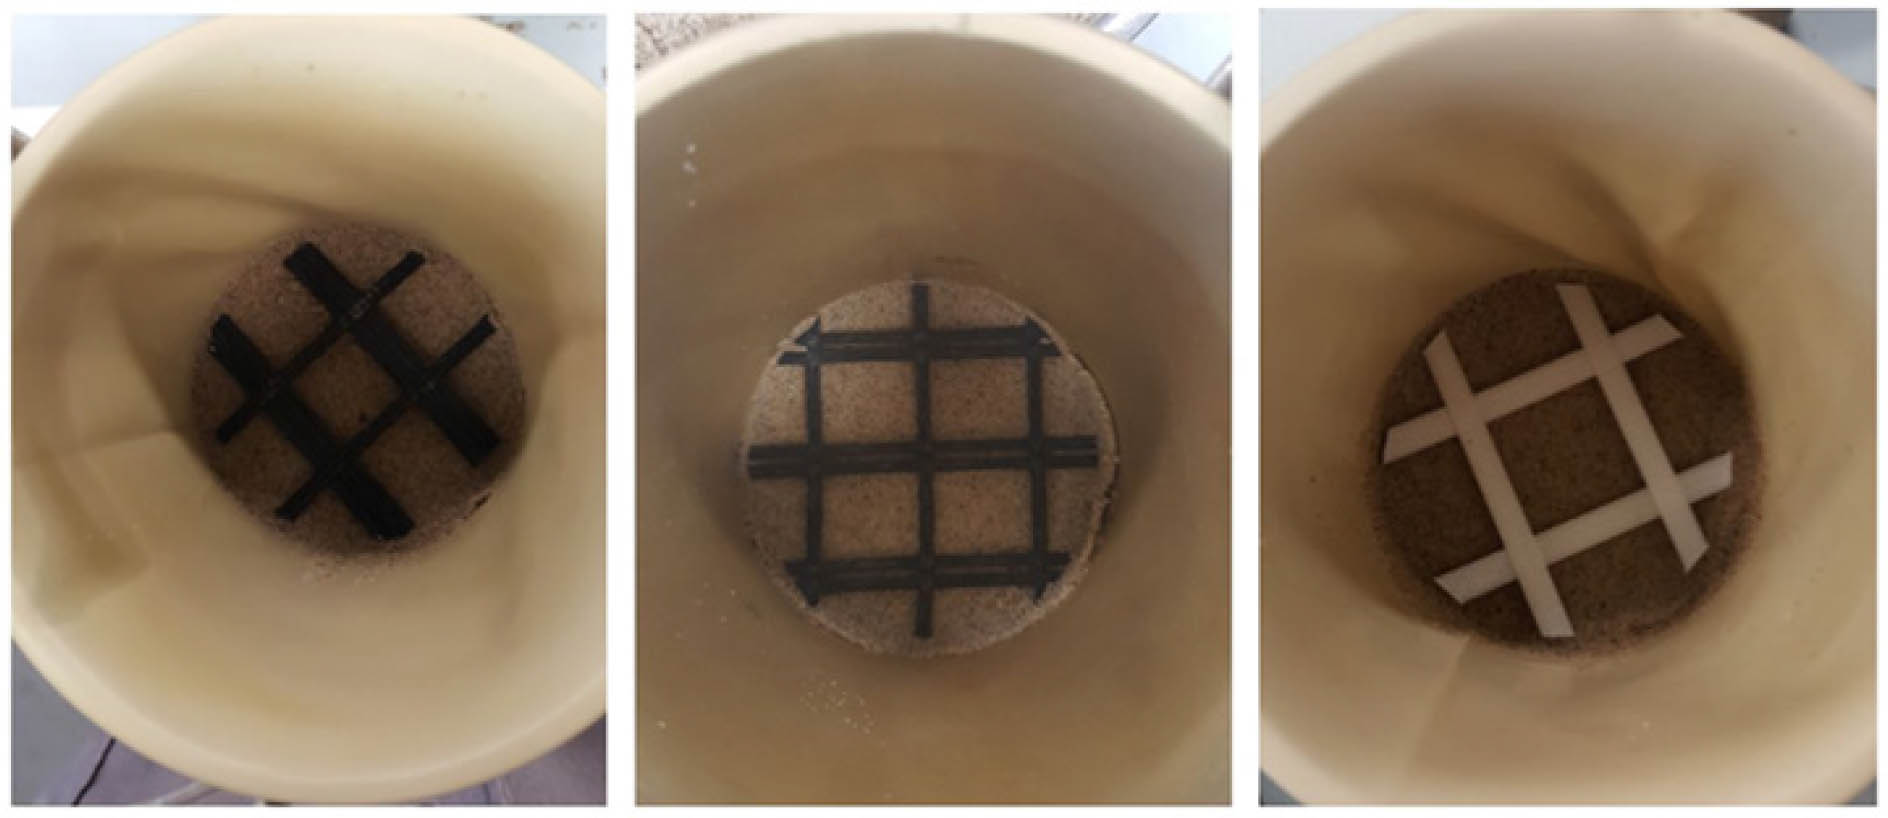
Figure 2
Sample reinforcement with geogrid: left – flexible Basetrac® Grid PP 40 geogrid; middle – flexible Basetrac® Grid PET 40 geogrid; right – rigid Secugrid 40/40 Q1 geogrid.
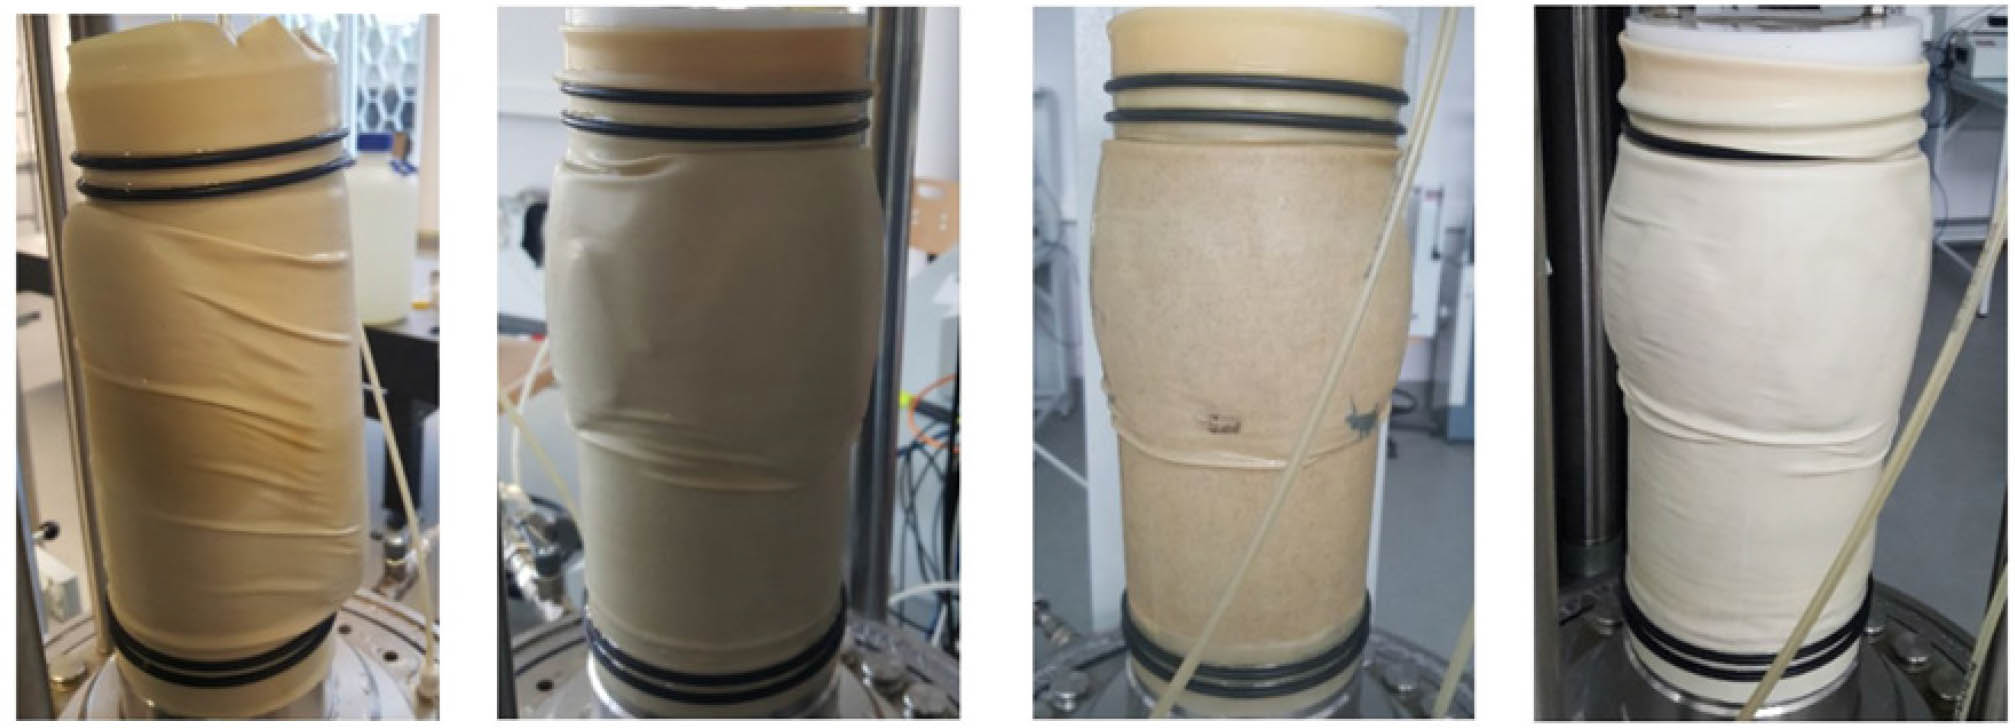
Figure 3
Sample failure shape (from left to right): unreinforced; reinforced with Basetrac® Grid PP 40 geogrid; reinforced with Basetrac® Grid PET 40 geogrid; reinforced with Secugrid 40/40 Q1 geogrid.
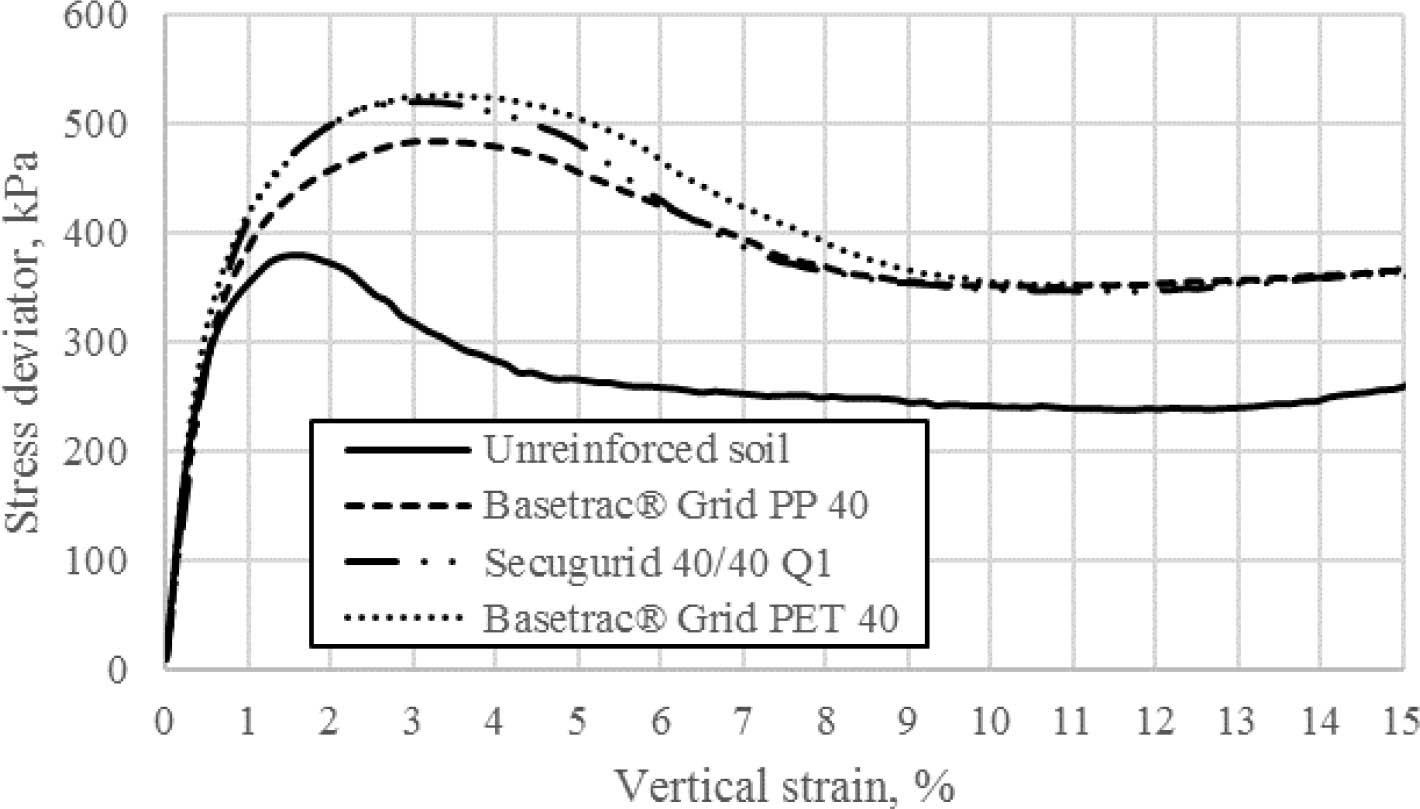
Figure 4
Dependence of stress deviator on the vertical strain of unreinforced and reinforced soil samples with geogrids when the cell pressure σ3 = 100 kPa.
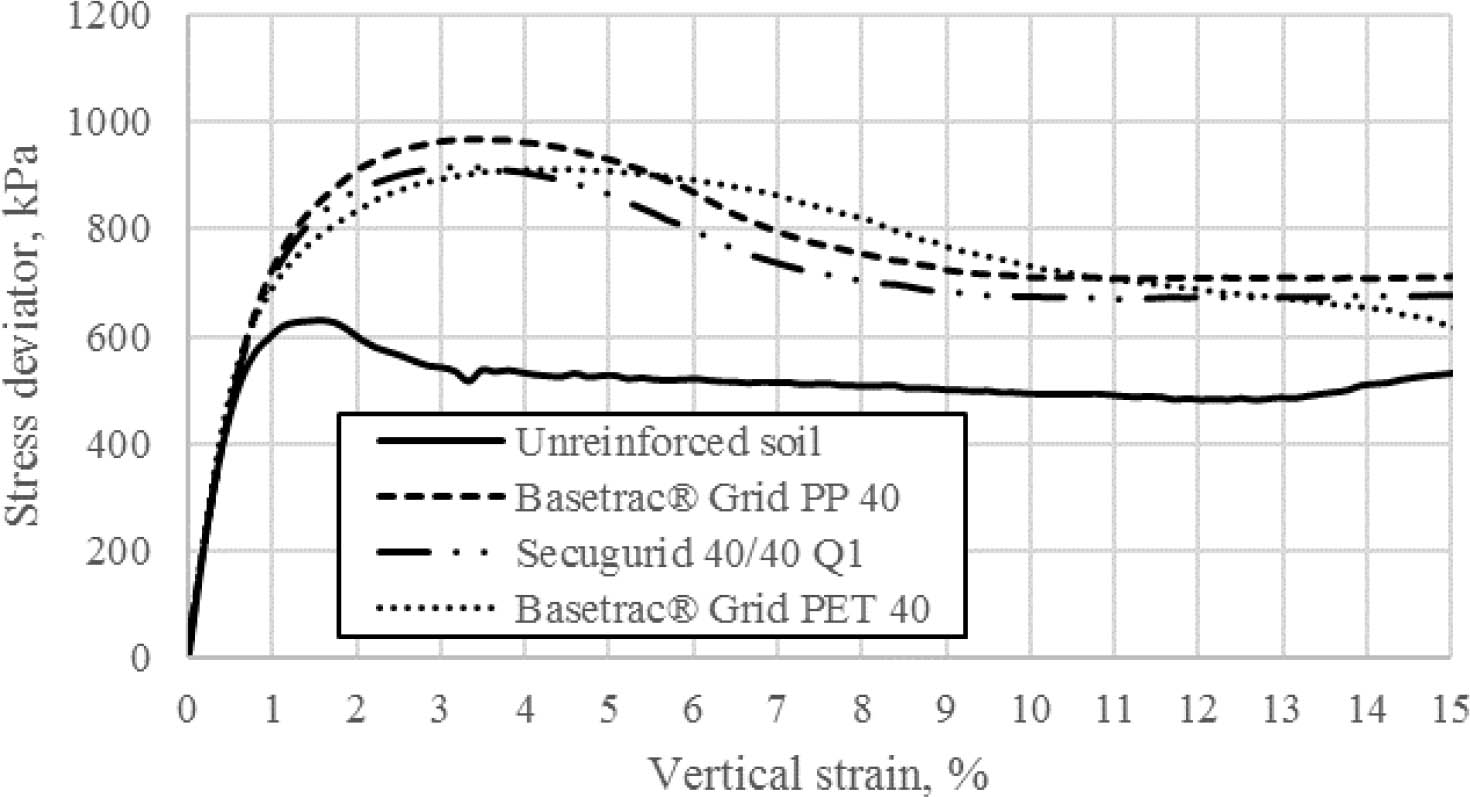
Figure 5
Dependence of stress deviator on the vertical strain of unreinforced and reinforced soil samples with geogrids when the cell pressure σ3 = 200 kPa.
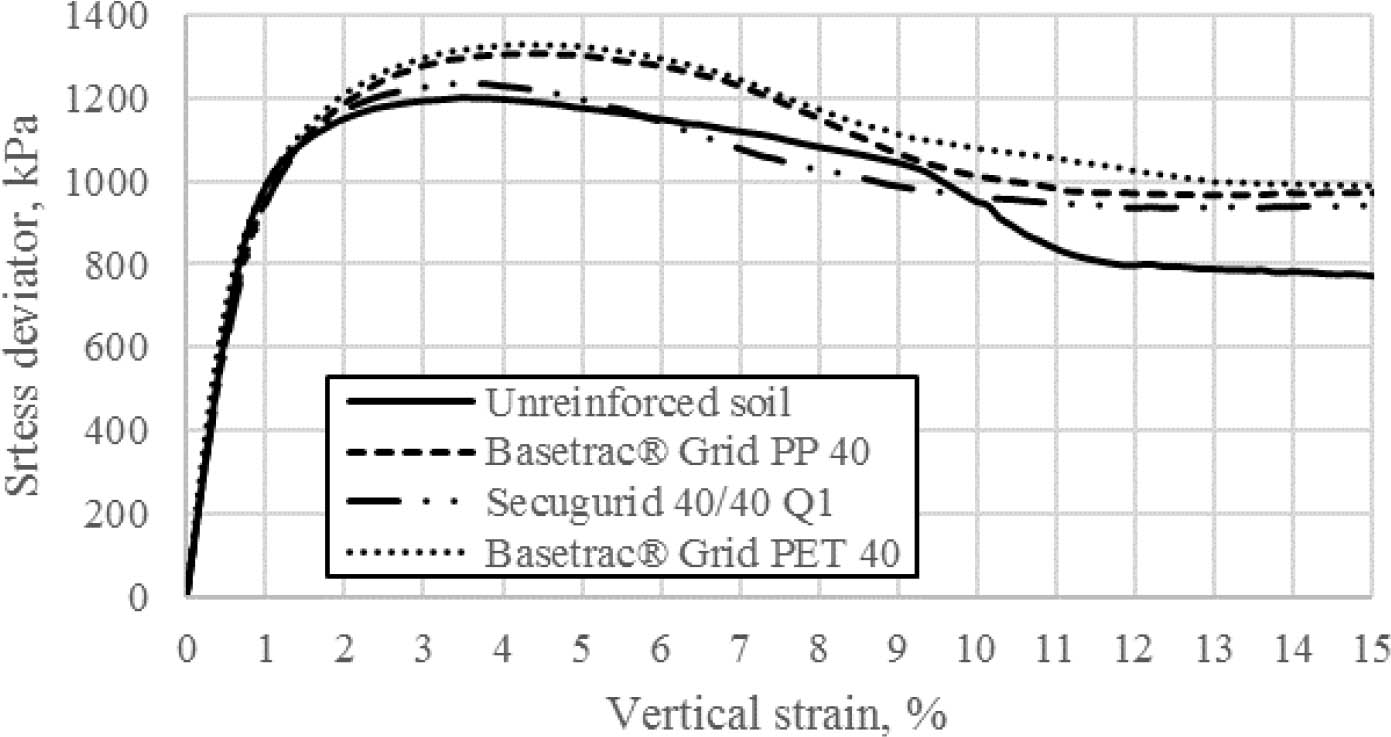
Figure 6
Dependence of stress deviator on the vertical strain of unreinforced and reinforced soil samples with geogrids when the cell pressure σ3 = 300 kPa.
Table 3
Unreinforced and reinforced soil with geogrid shearing strength.
| Peak strength | ||||||
|---|---|---|---|---|---|---|
| Test conditions | Cell pressure σ3, kPa | Max stress deviator σ1–σ3, kPa | Vertical strain ɛ, % | Angle of internal friction ϕ′, ° | Cohesion c′ kPa | Shearing strength ratio (reinforced/unreinforced) |
| Unreinforced | 104.54 | 380.67 | 1.5810 | 40.77 | 0.00 | - |
| 202.98 | 627.85 | 1.5758 | - | |||
| 305.39 | 1202.45 | 3.4799 | - | |||
| Basetrac® Grid PP 40 | 106.68 | 484.87 | 3.3234 | 42.28 | 22.82 | 1.31 |
| 204.78 | 966.78 | 3.4615 | 1.31 | |||
| 305.30 | 1308.82 | 4.4283 | 1.12 | |||
| Secugrid 40/40 Q1 | 106.20 | 521.38 | 3.0033 | 39.78 | 43.47 | 1.43 |
| 205.65 | 916.87 | 3.3232 | 1.31 | |||
| 305.13 | 1233.04 | 3.6346 | 1.09 | |||
| Basetrac® Grid PET 40 | 107.01 | 526.76 | 3.3171 | 41.90 | 20.27 | 1.32 |
| 206.10 | 908.43 | 5.0638 | 1.27 | |||
| 306.44 | 1328.61 | 4.1152 | 1.11 | |||
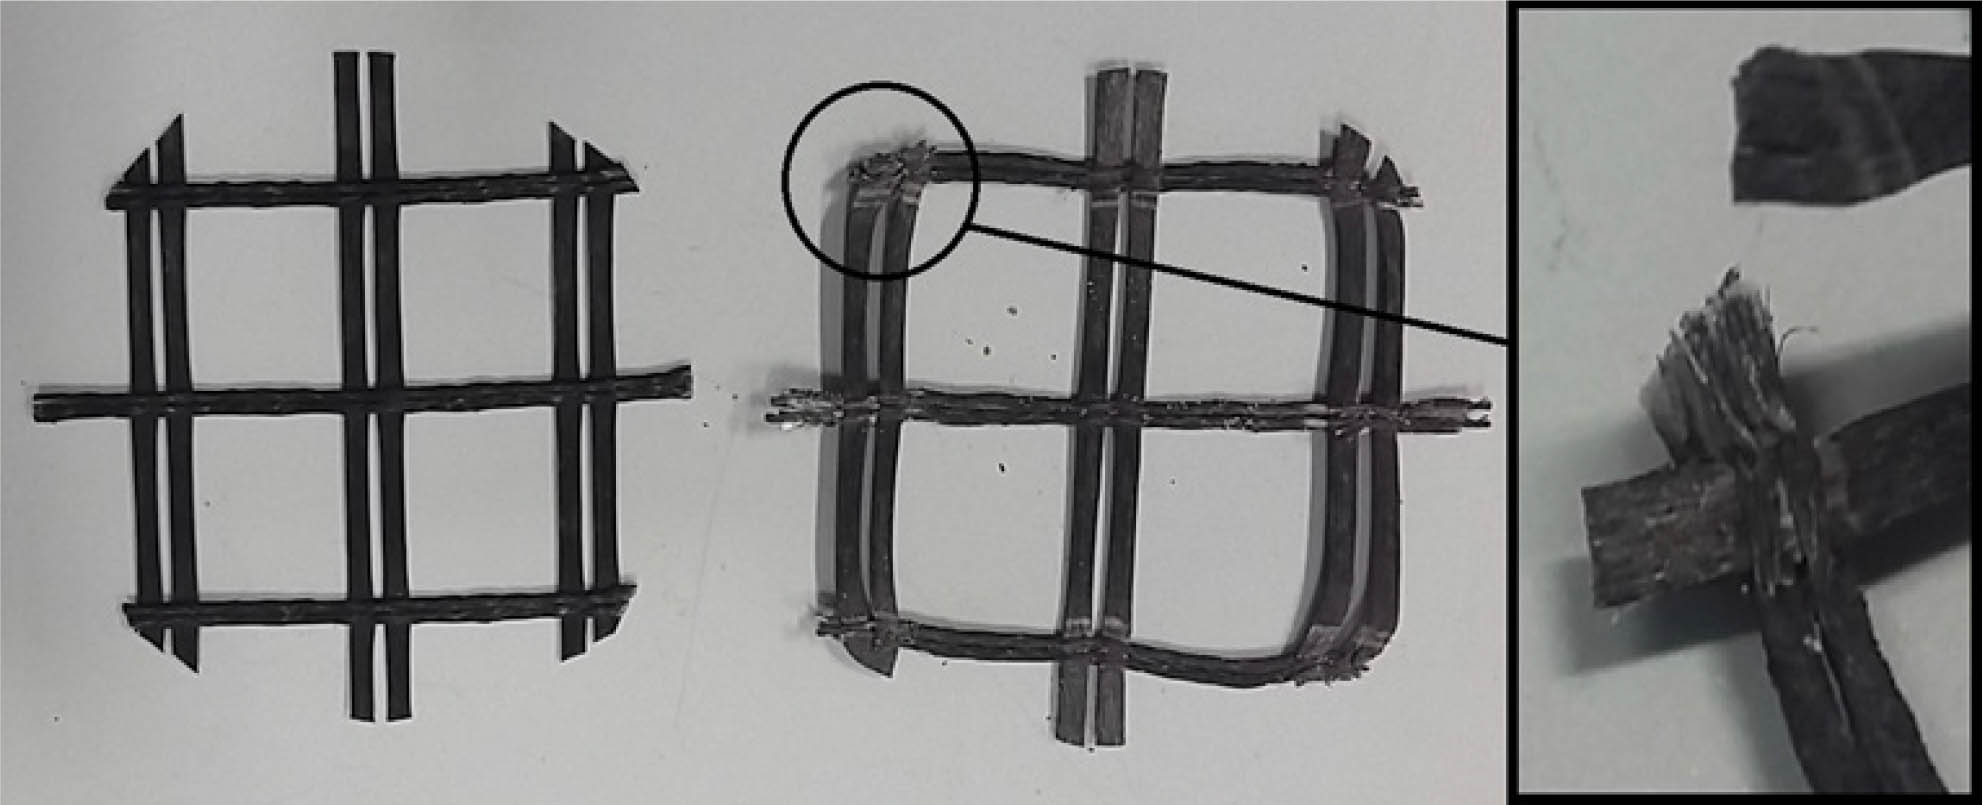
Figure 7
Basetrac® Grid PET 40 geogrid condition: left – geogrid without damages before test; right – geogrid damages after test.
Table 4
Simulated unreinforced and reinforced soil shearing strength with PLAXIS 3D.
| Test conditions | Experimental results | Simulation | ||
|---|---|---|---|---|
| Cell pressure σ3, kPa | Max stress deviator σ1–σ3, kPa | Cell pressure σ3, kPa | Max stress deviator σ1–σ3, kPa | |
| Unreinforced | 104.54 | 380.67 | 100.0 | 365.0 |
| 202.98 | 627.85 | 200.0 | 740.0 | |
| 305.39 | 1202.45 | 300.0 | 1110.0 | |
| Basetrac® Grid PP 40 | 106.68 | 484.87 | 100.0 | 470.0 |
| 204.78 | 966.78 | 200.0 | 960.0 | |
| 305.30 | 1308.82 | 300.0 | 1410.0 | |
| Basetrac® Grid PET 40 | 107.01 | 526.76 | 100.0 | 510.0 |
| 206.10 | 908.43 | 200.0 | 910.0 | |
| 306.44 | 1328.61 | 300.0 | 1460.0 | |
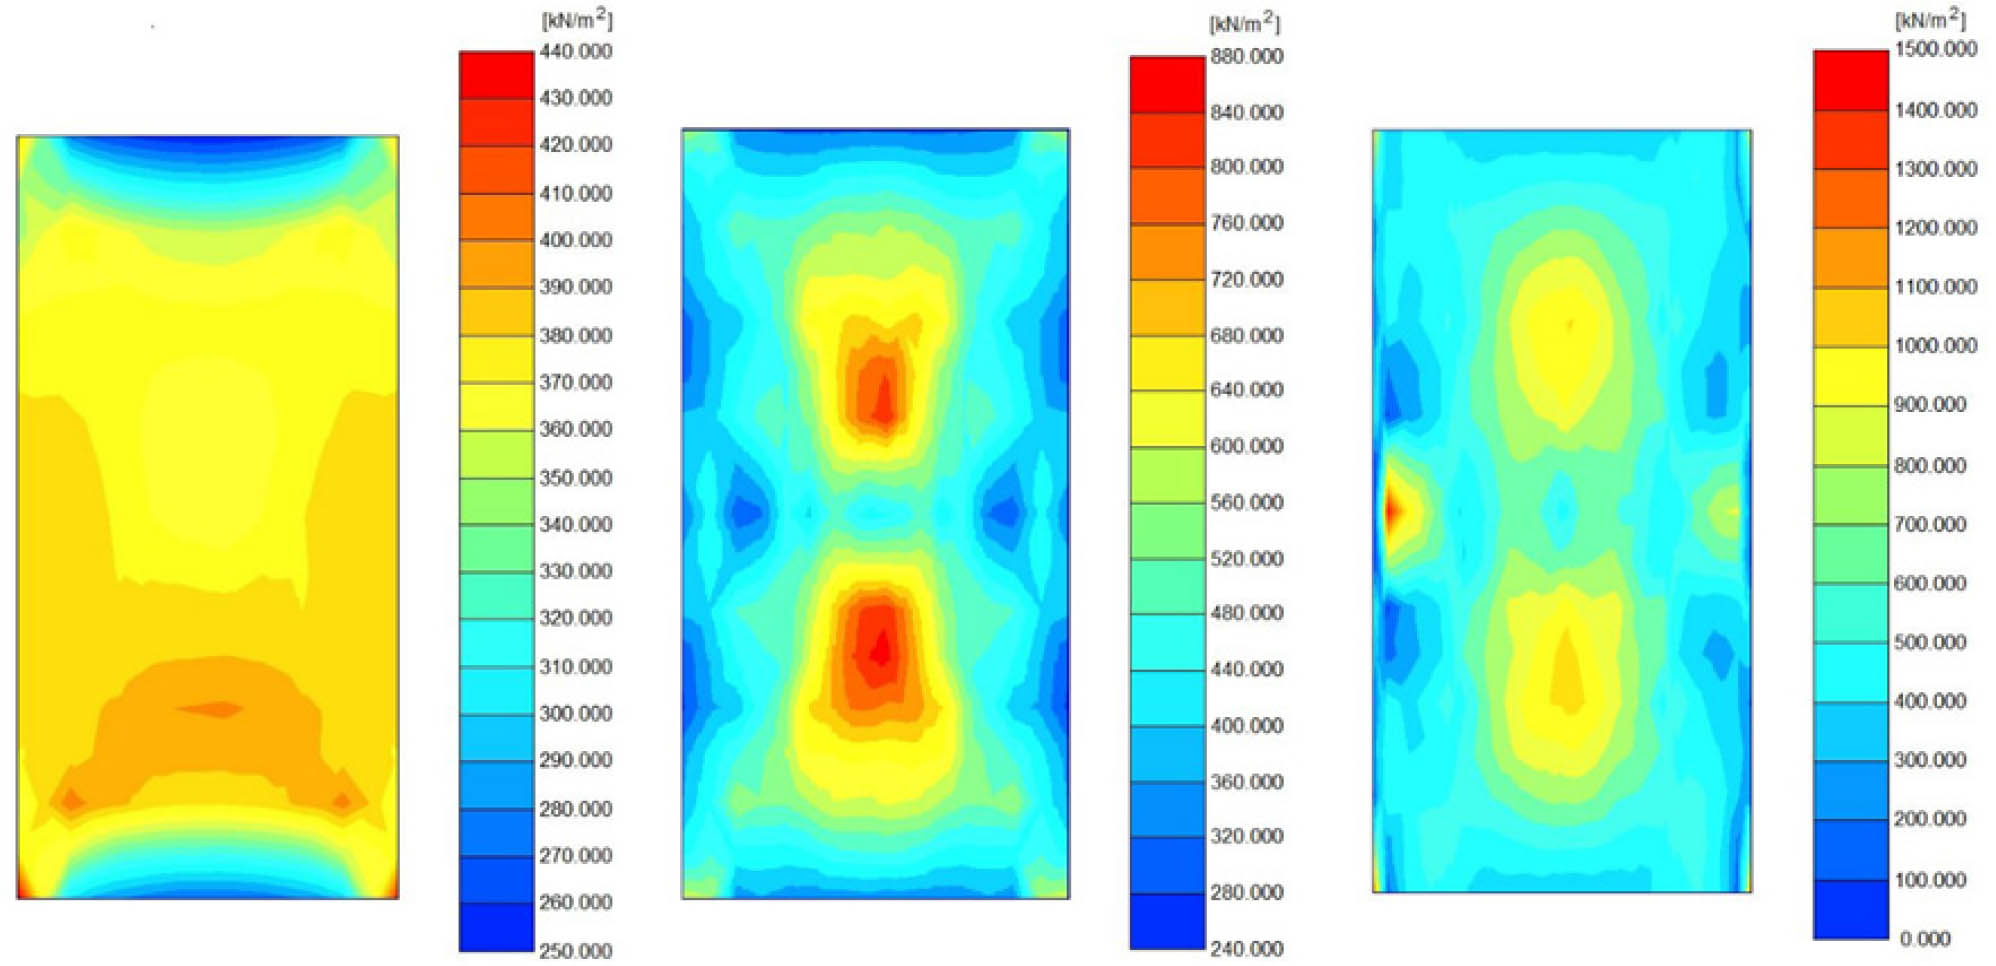
Figure 8
Distribution of stress deviator in vertical cross section when the cell pressure σ3 = 100 kPa: left – unreinforced sample; middle – sample reinforced with Basetrac® Grid PP 40 geogrid; right – sample reinforced with Basetrac® Grid PET 40 geogrid.
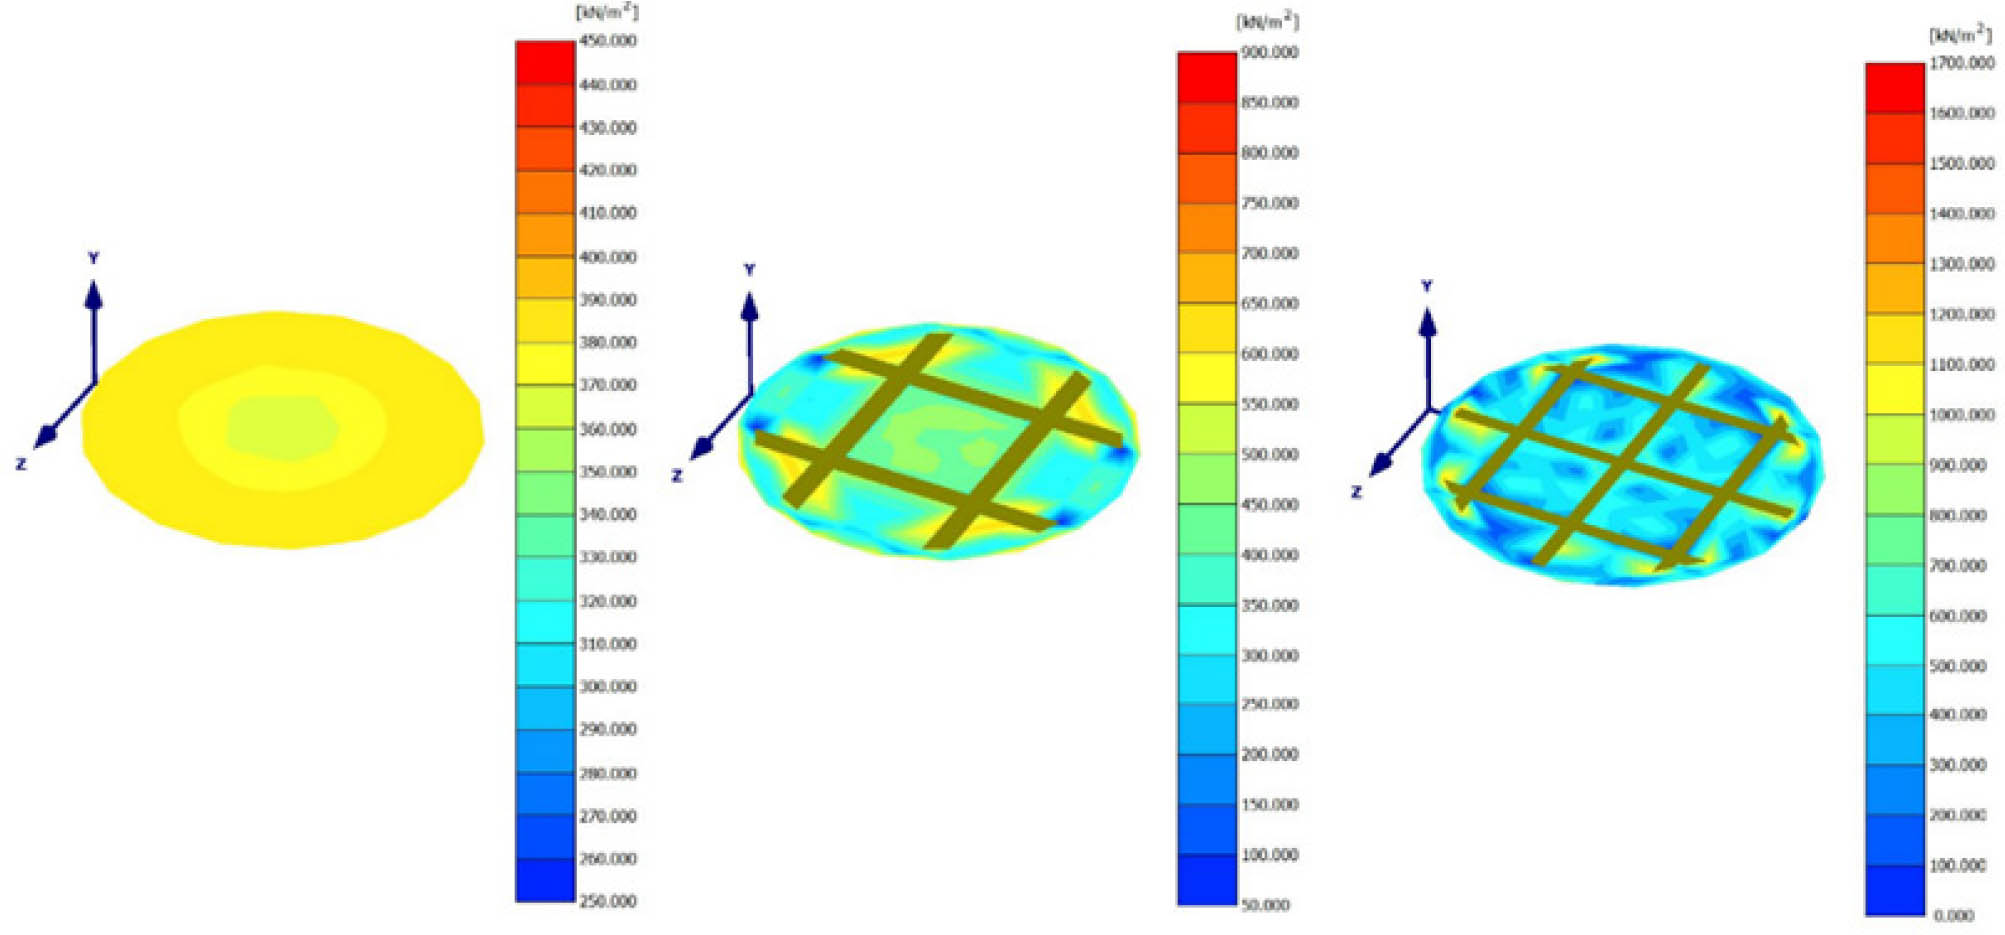
Figure 9
Distribution of stress deviator in the horizontal plane at the geogrid position when the cell pressure σ3 =100 kPa: left – unreinforced sample; middle – sample reinforced with Basetrac® Grid PP 40 geogrid; right – sample reinforced with Basetrac® Grid PET 40 geogrid.
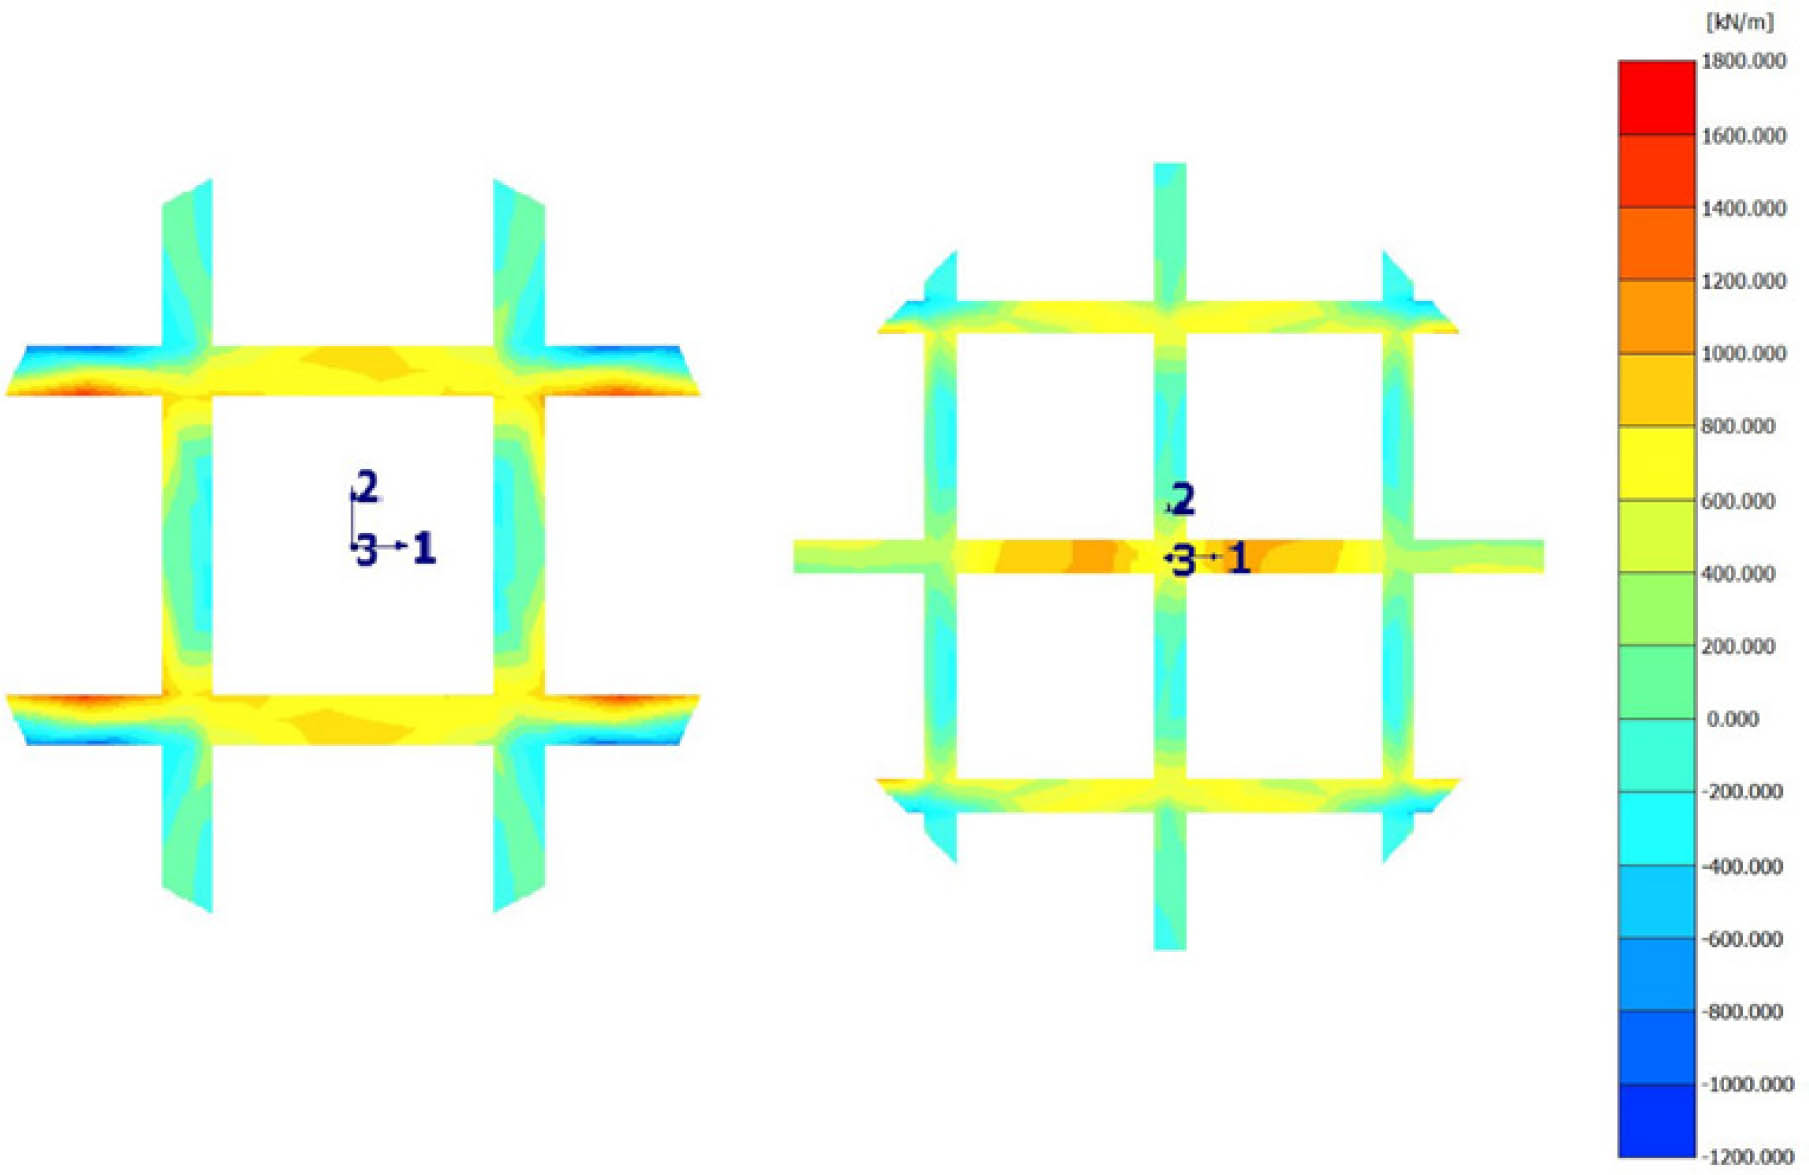
Figure 10
Distribution of tension forces along axis 1 in the geogrids when the cell pressure σ3 = 300 kPa: left – sample reinforced with Basetrac® Grid PP 40 geogrid; right – sample reinforced with Basetrac® Grid PET 40 geogrid.
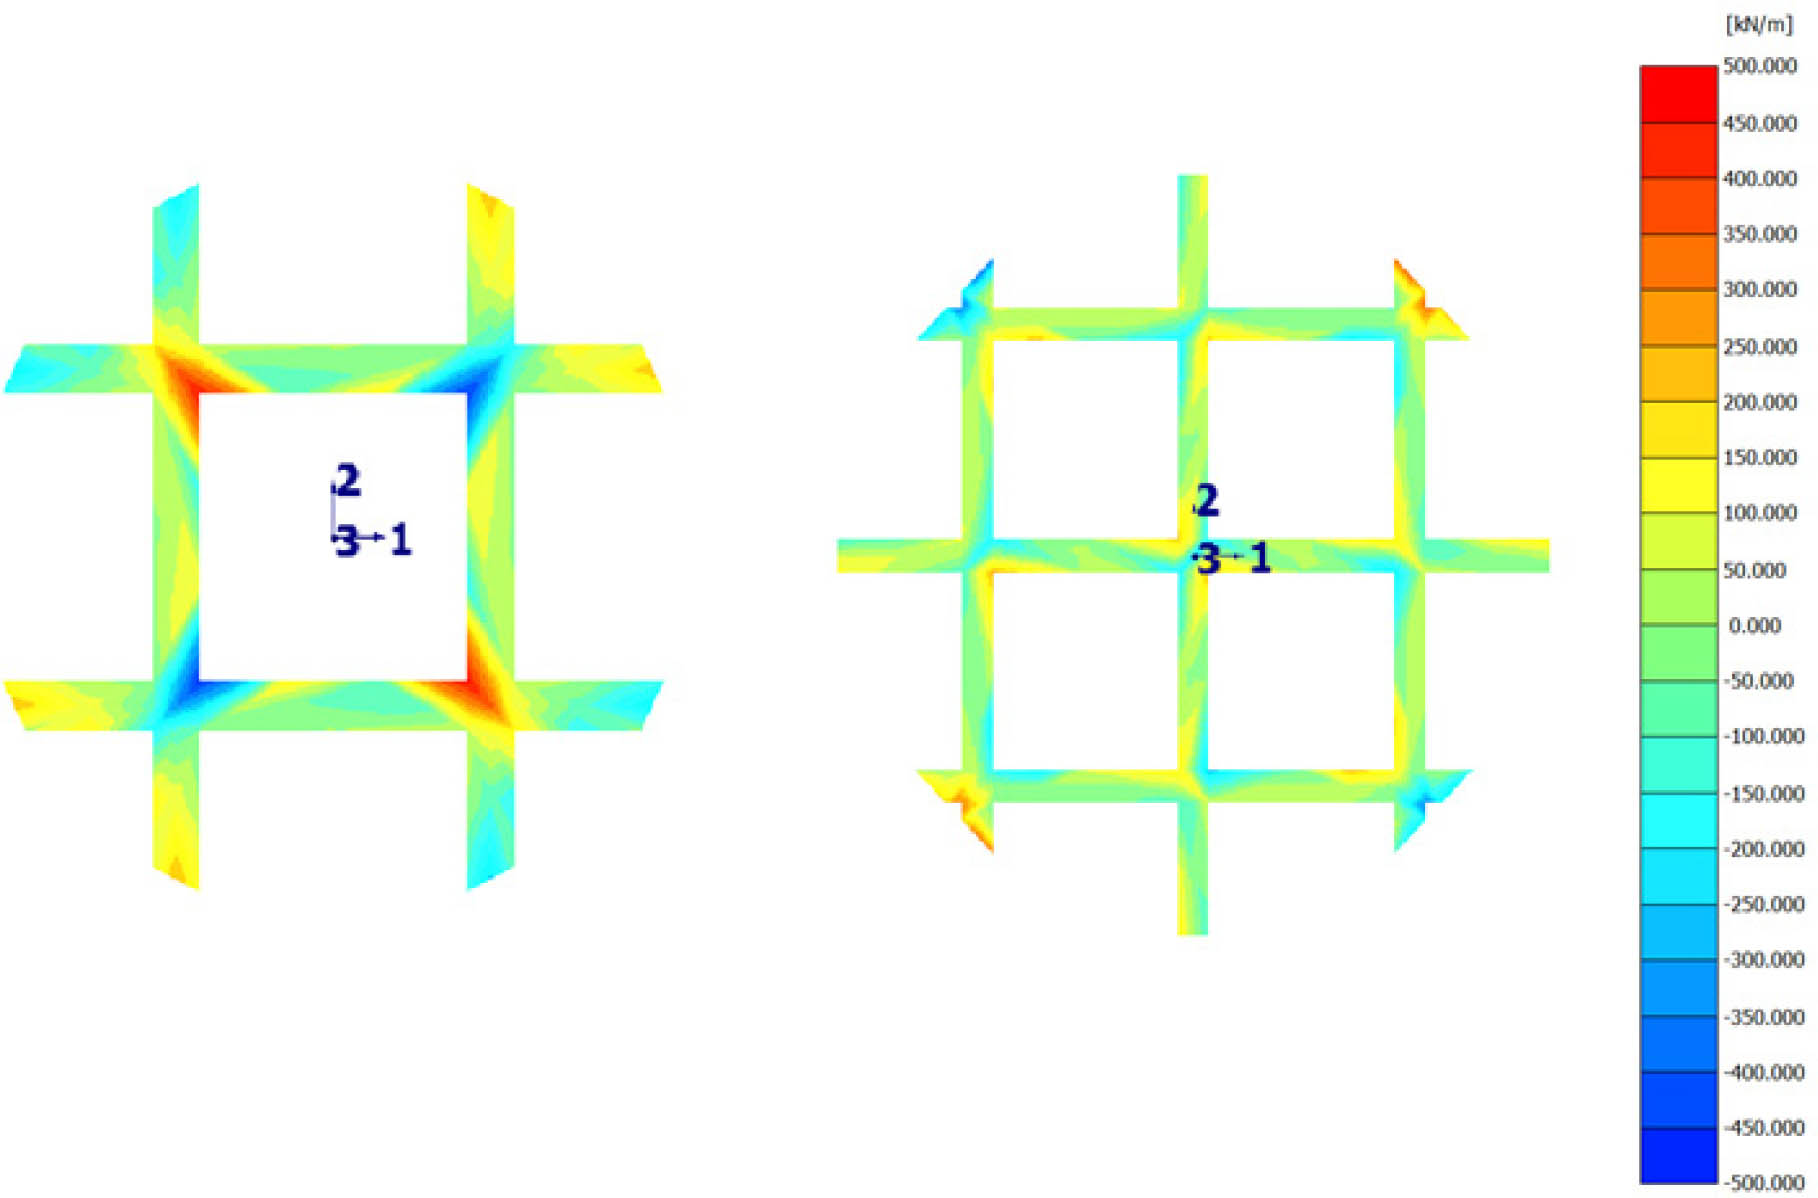
Figure 11
Distribution of shear forces in the geogrids when the cell pressure σ3 = 300 kPa: left – sample reinforced with Basetrac® Grid PP 40 geogrid; right – sample reinforced with Basetrac® Grid PET 40 geogrid.
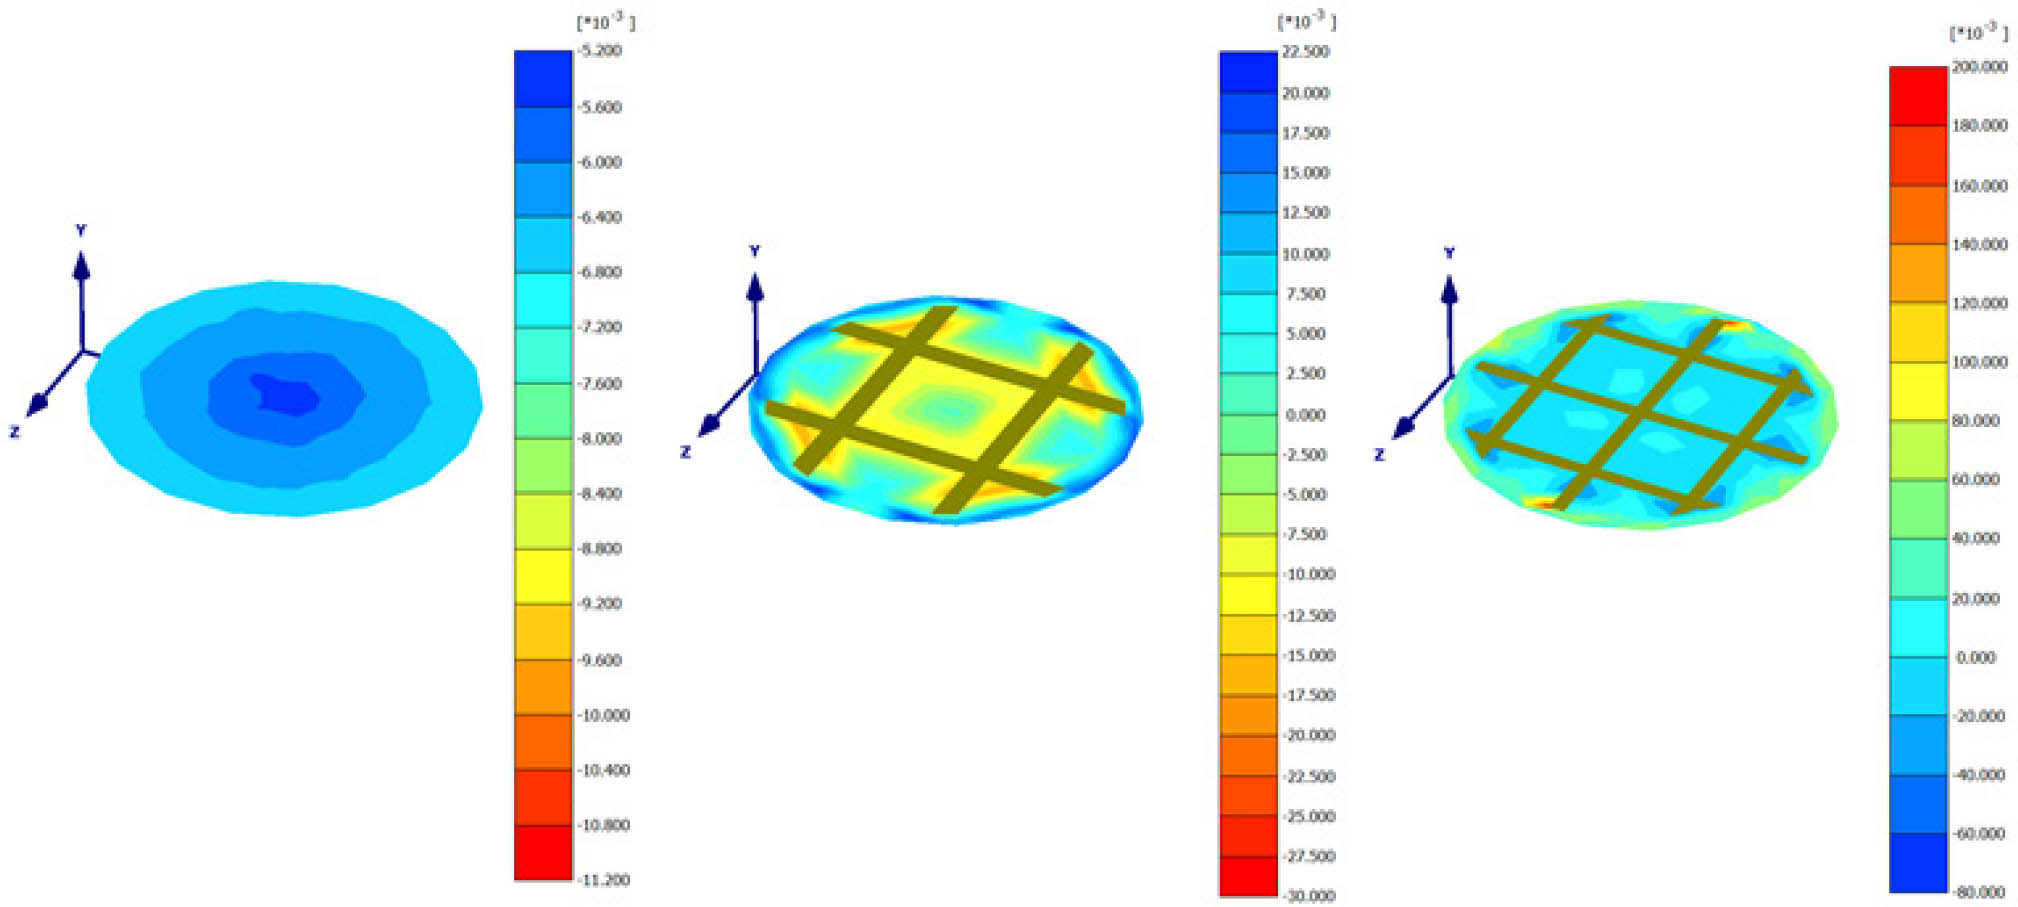
Figure 12
Distribution of total volumetric strains εv when the cell pressure σ3 = 100 kPa: left – unreinforced sample; middle – sample reinforced with Basetrac® Grid PP 40 geogrid; right – sample reinforced with Basetrac® Grid PET 40 geogrid.
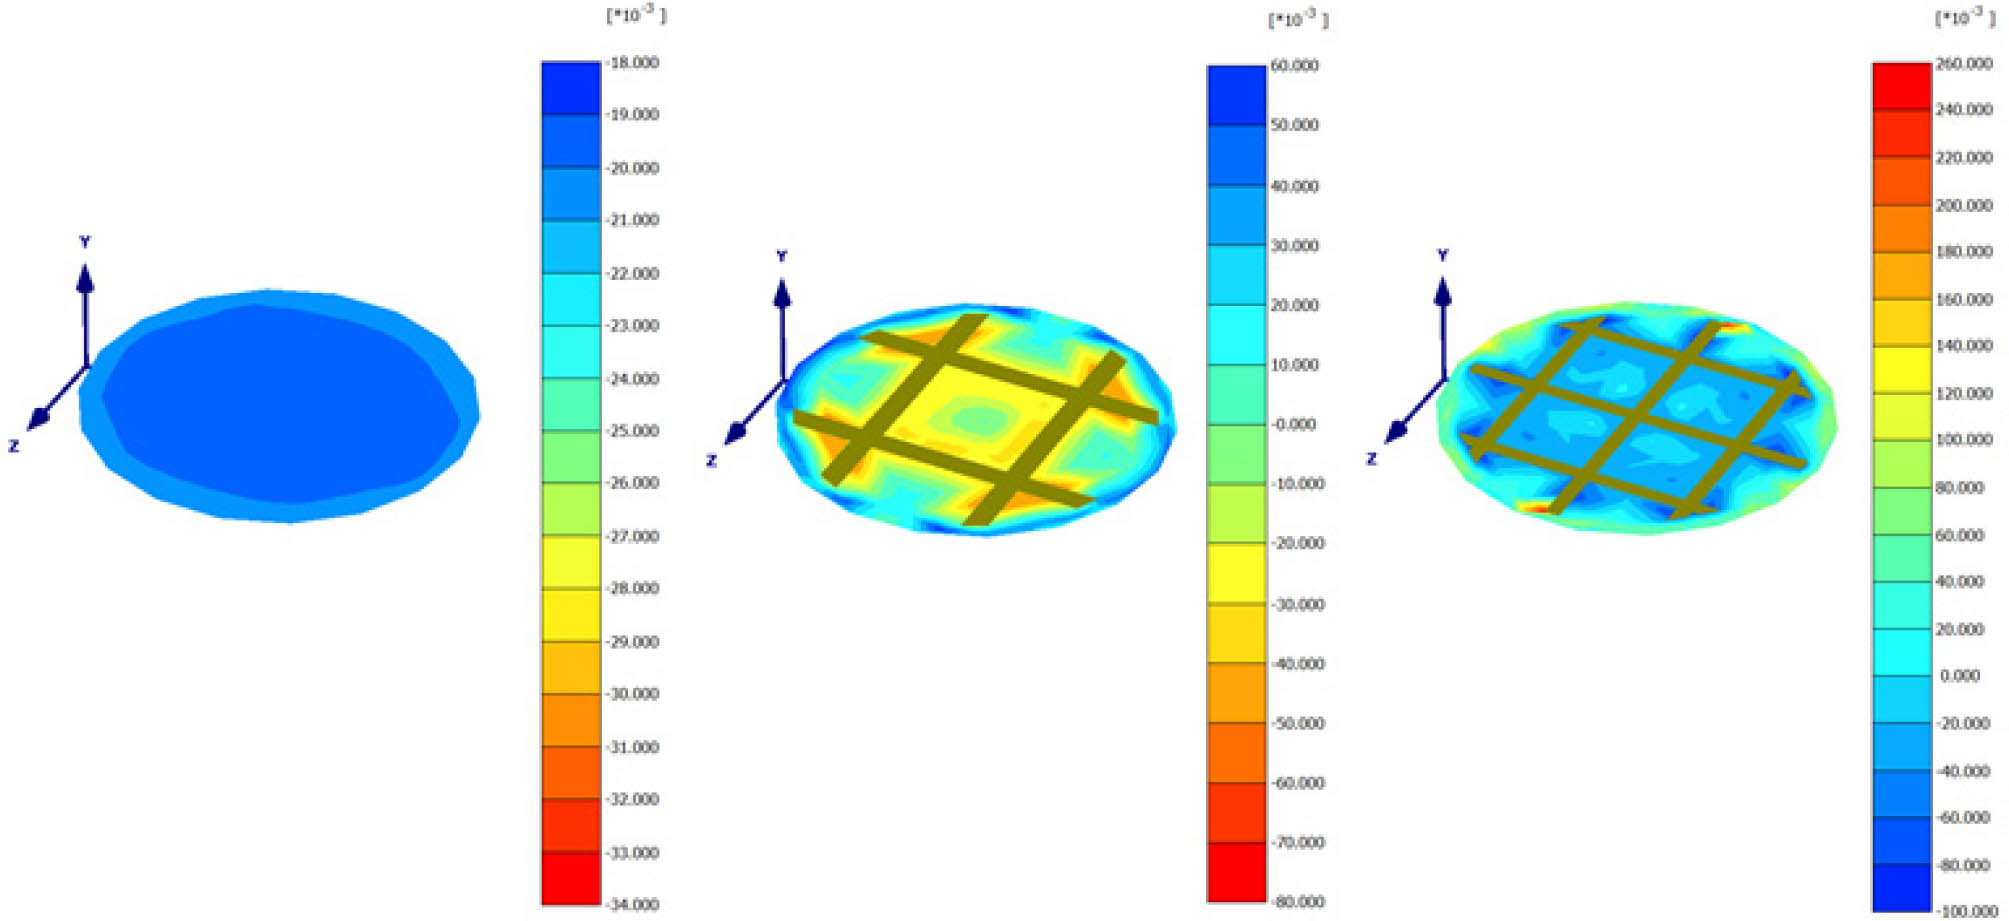
Figure 13
Distribution of total volumetric strains εv when the cell pressure σ3 = 300 kPa: left – unreinforced sample; middle – sample reinforced with Basetrac® Grid PP 40 geogrid; right – sample reinforced with Basetrac® Grid PET 40 geogrid.