
Figure 1
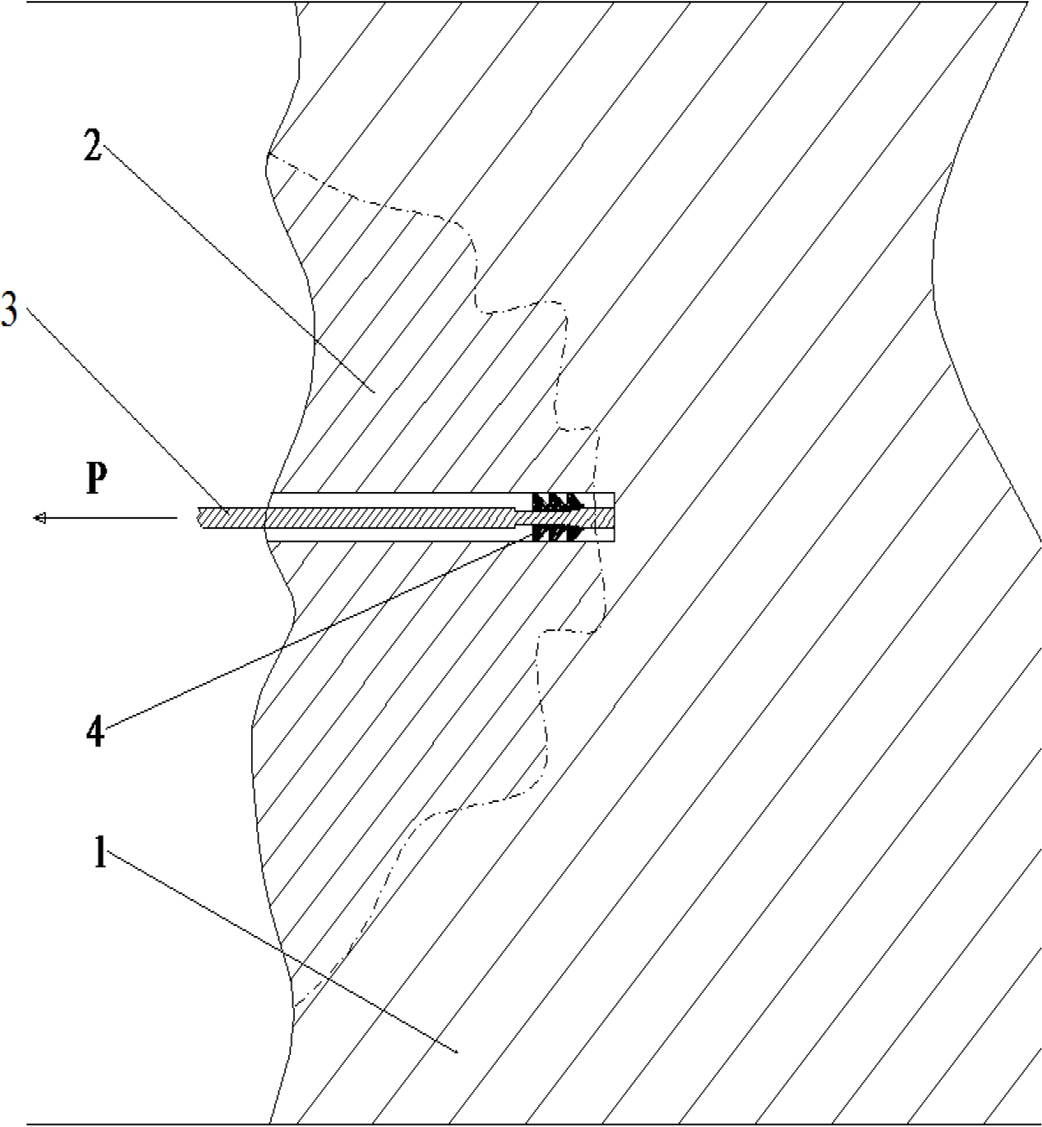
The concept of cutting the solid rock through destruction of its integrity: 1. solid rock, 2. loosened rock, 3. pulling rod, 4. expansion sleeve [4, 16, 20].
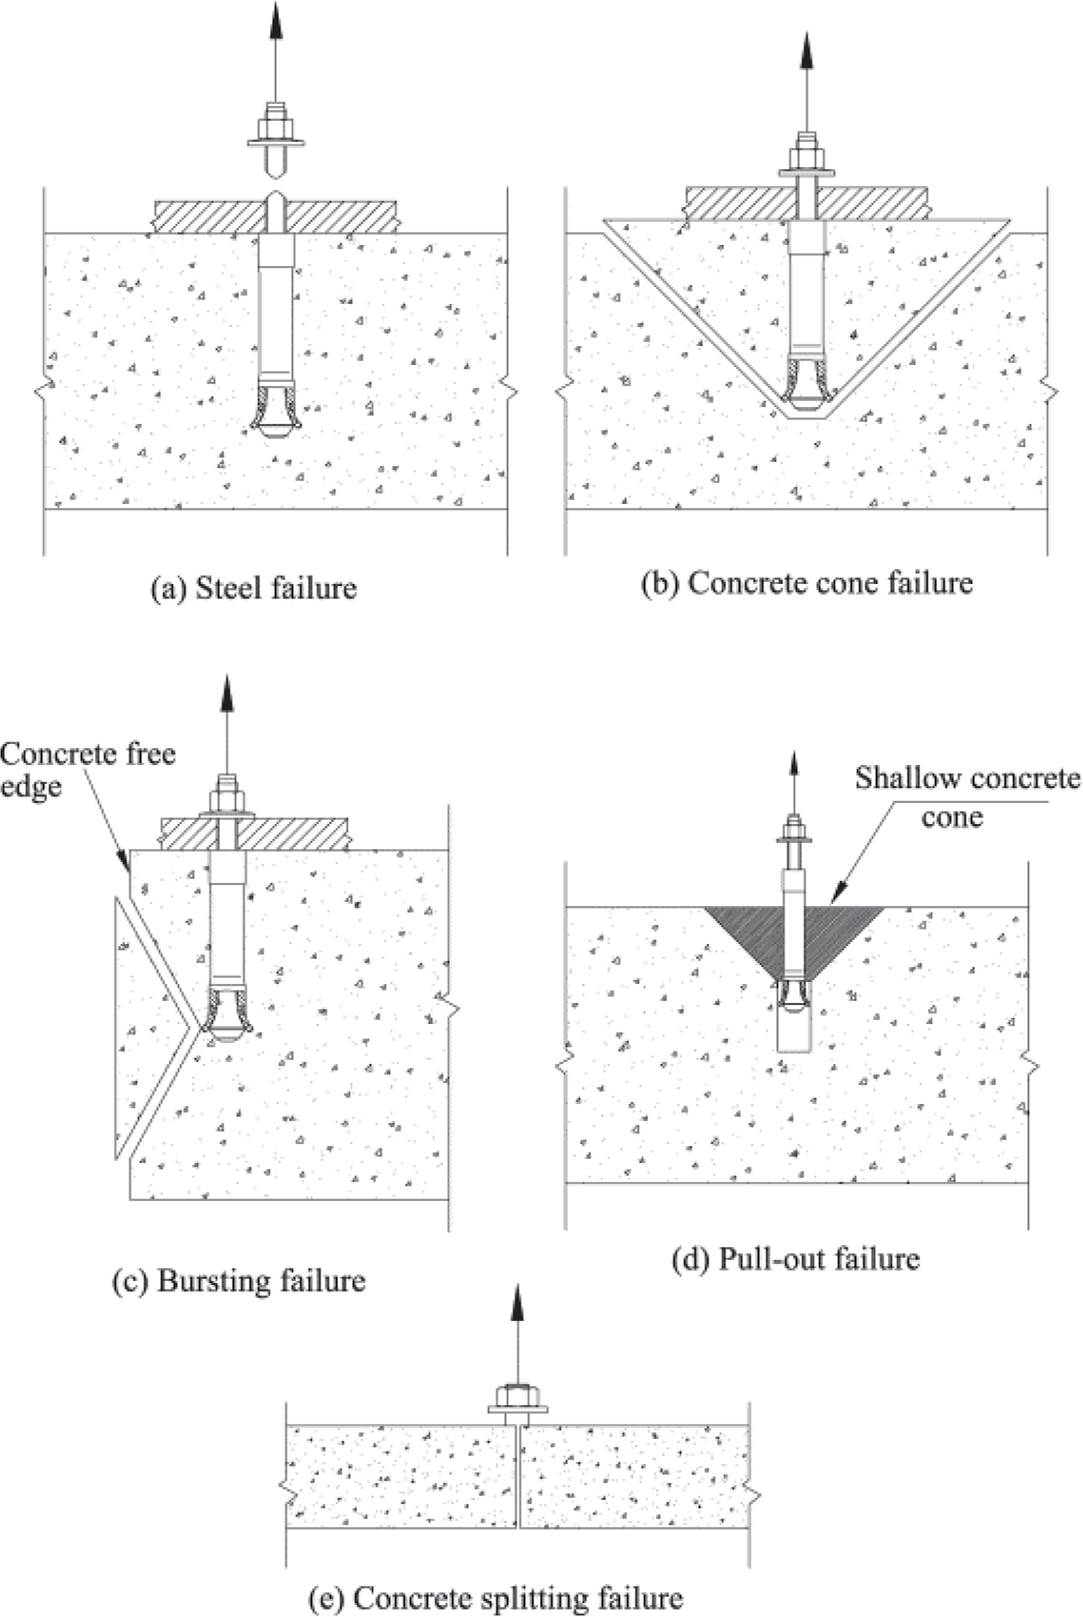
Figure 2
Different failure mechanisms of cast-in and post-installed mechanical anchors [2].
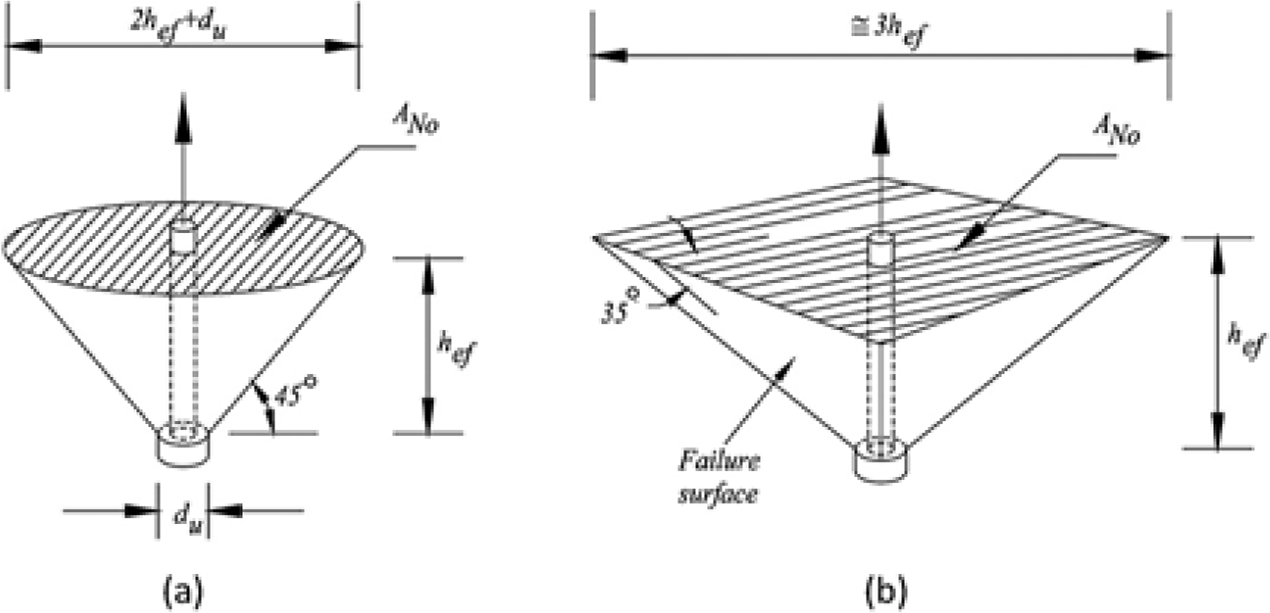
Figure 3
Base material failure models according to: a) ACI 349-85 (conical failure) and b) CCD (four-sided pyramid failure) [2, 9, 22, 23] CCD, concrete capacity design.
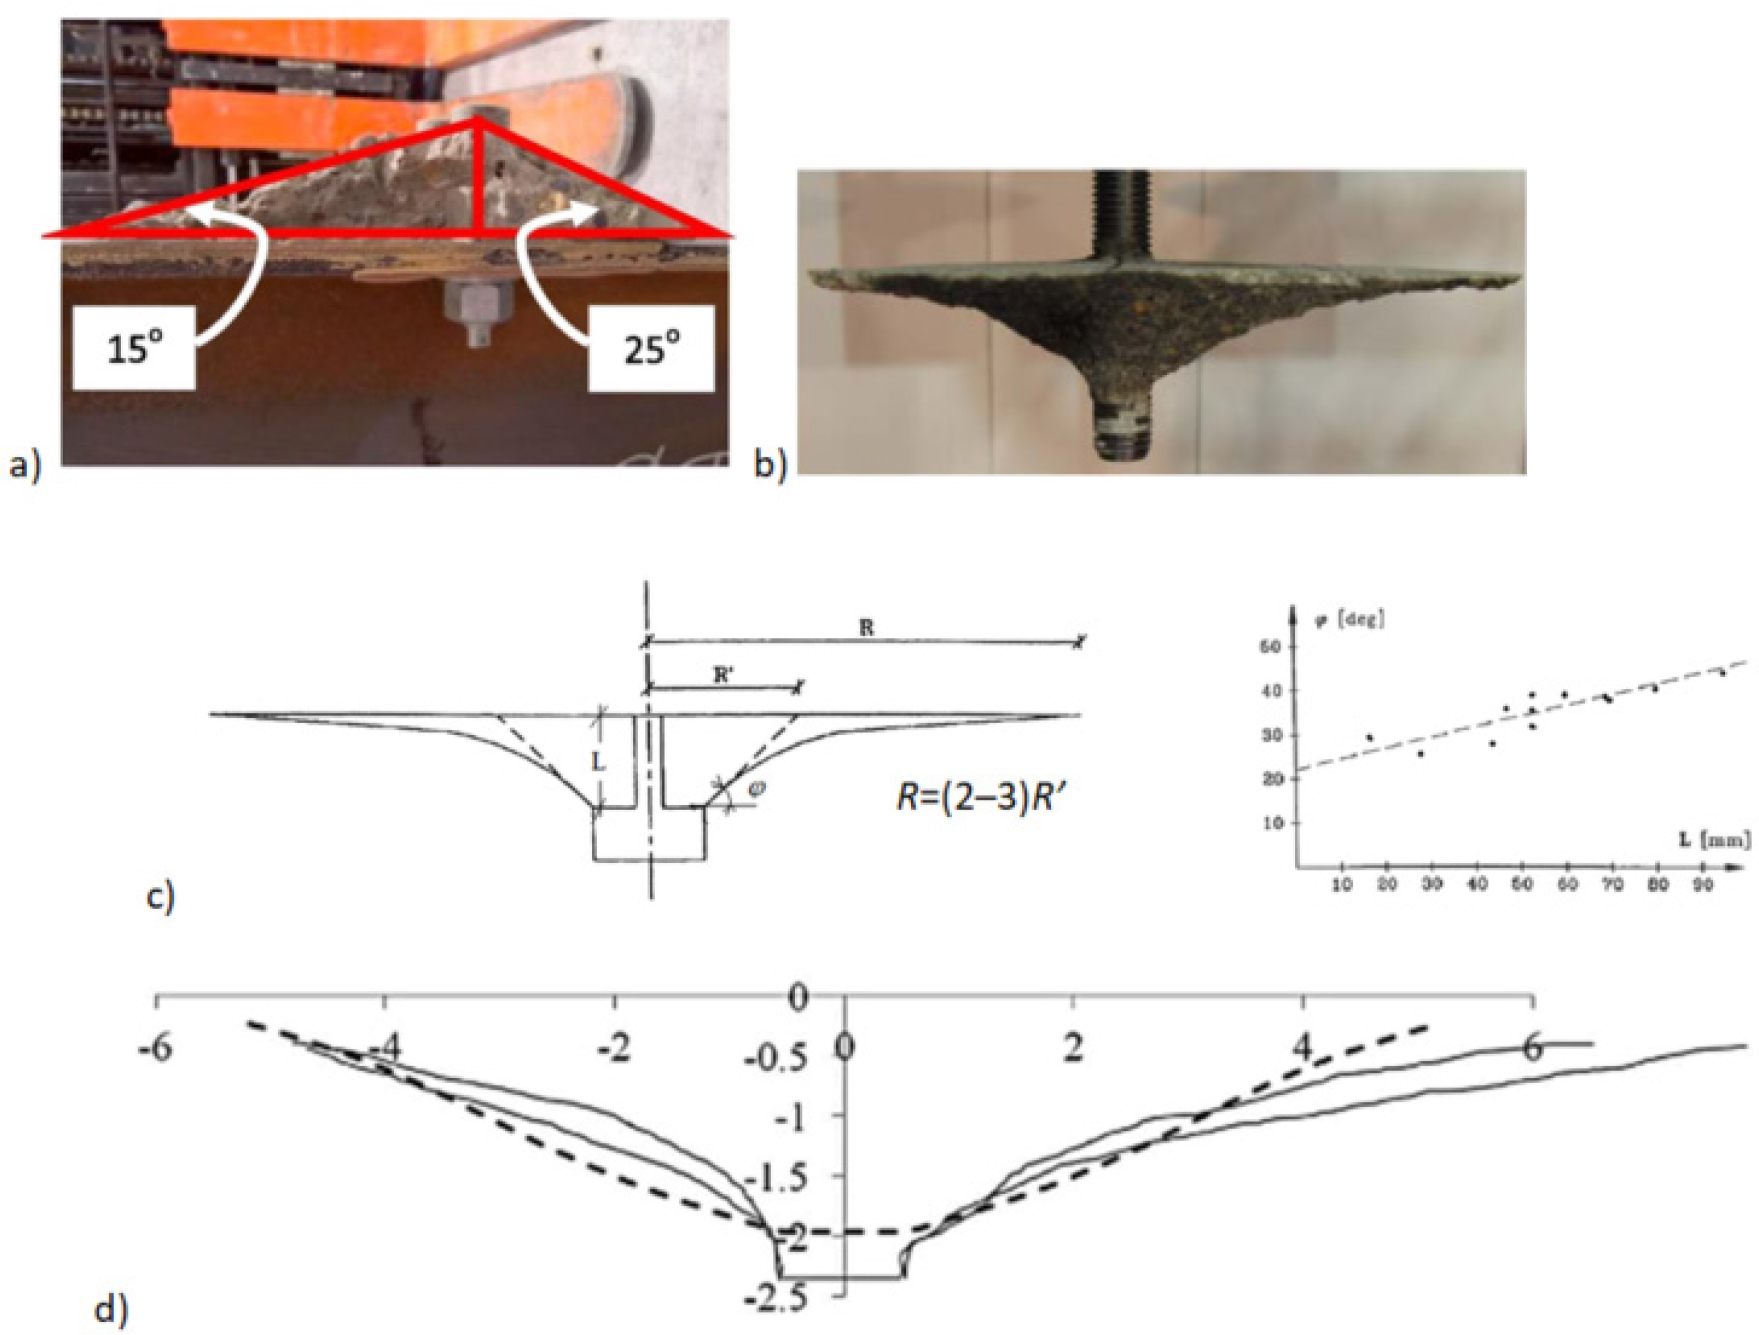
Figure 4
Real extent of the loosening process based on literature data: a, b) concrete cone [12, 23]; c) radius R observed by test and effective radius R’ used in model [3]; d) comparison between LEFM predictions (dashed lines) and experimental crack propagation patterns [19]. LEFM, linear elastic fracture mechanics.
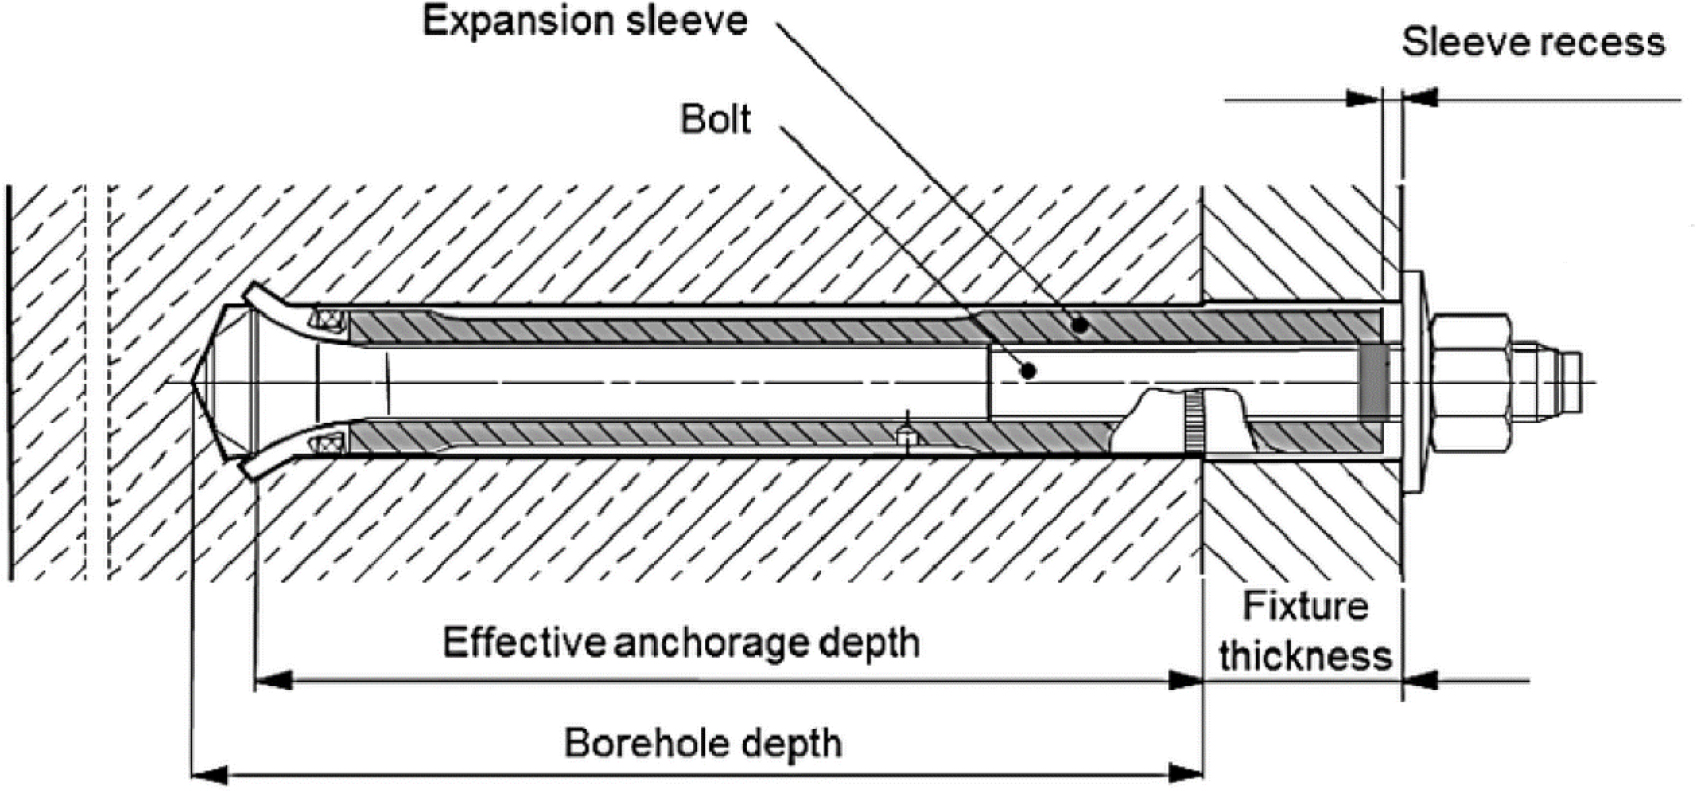
Figure 5
An example of the undercutting anchor [13].
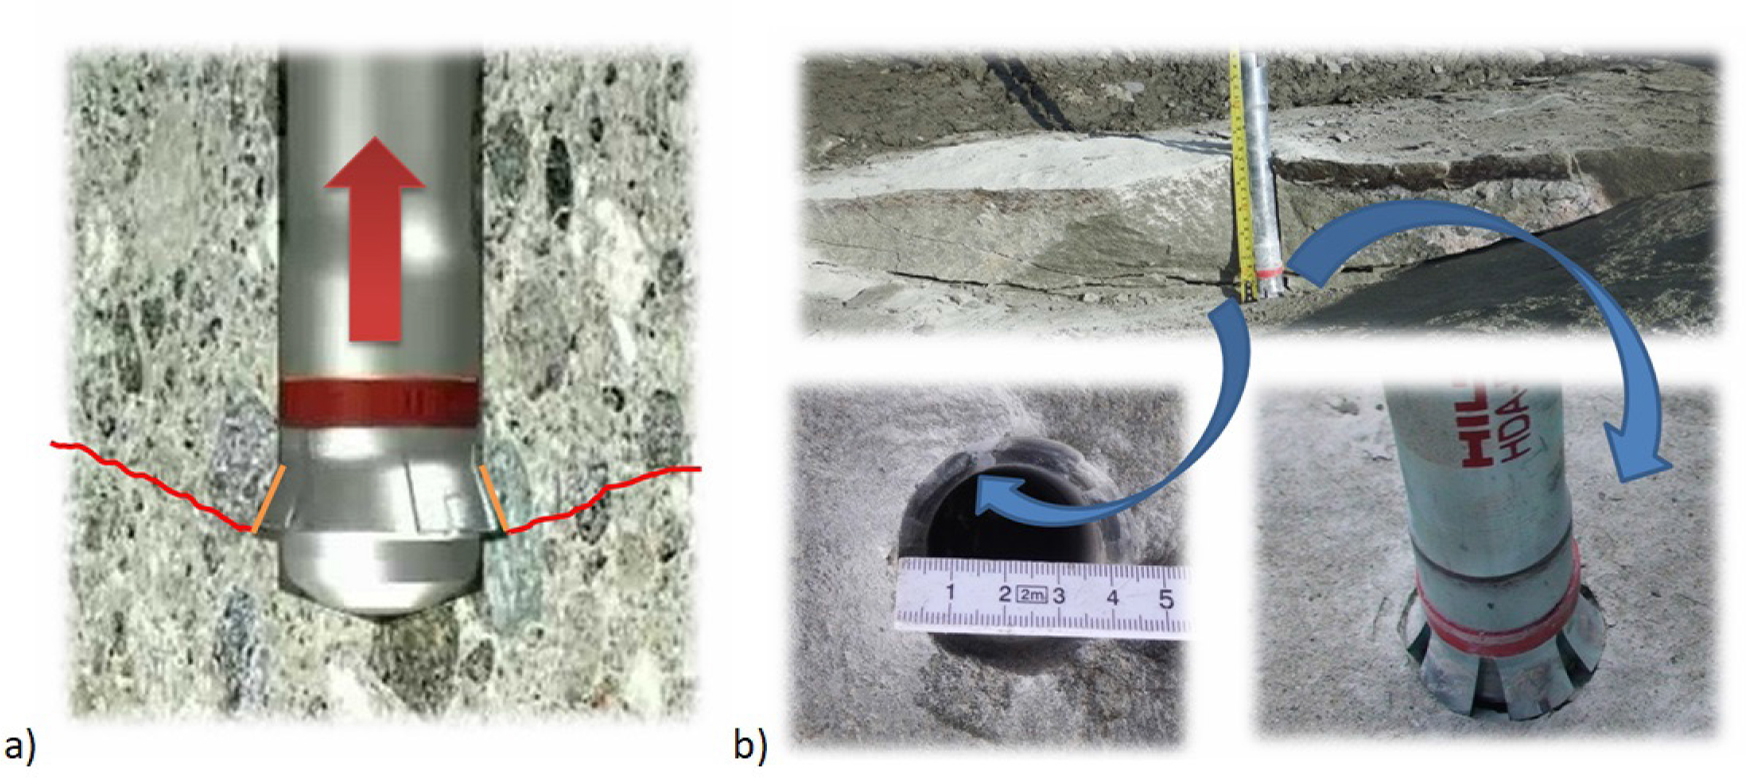
Figure 6
Loosening process with use of an undercutting anchor: a) line of crack propagation, b) fixation method.
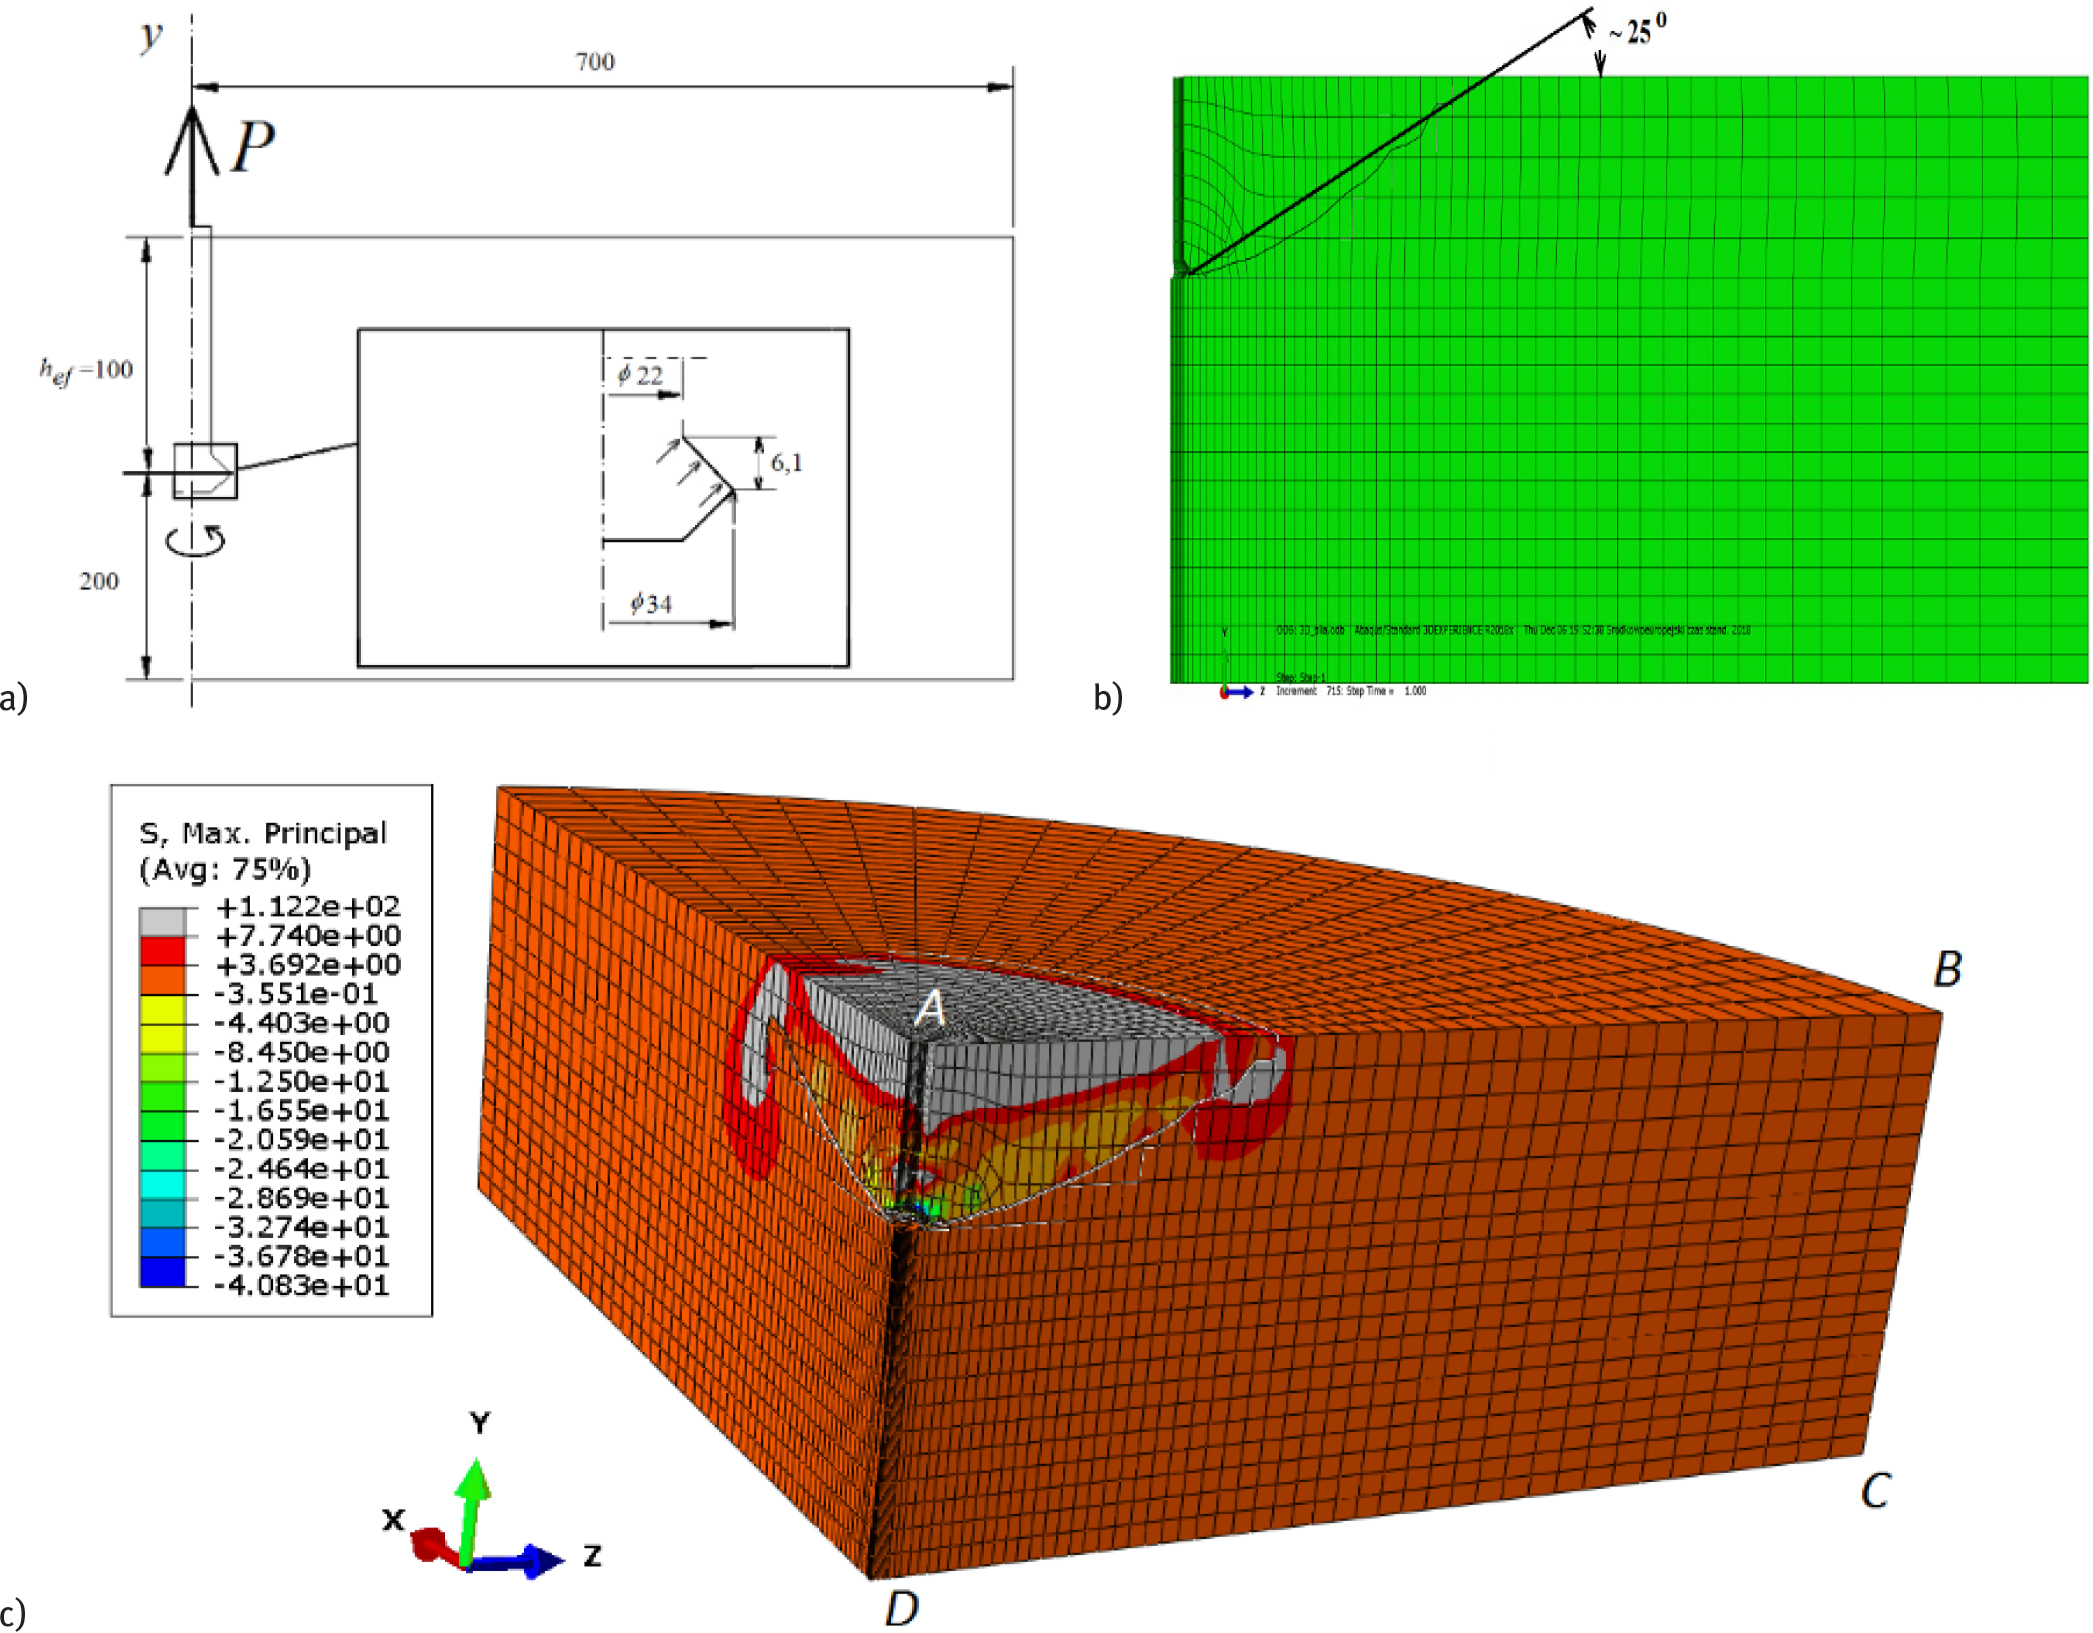
Figure 7
Computer simulations [14]: a) scheme of the task, b) the average value of the angle of the concrete cone failure (section plane ABCD in Figure 7c), c) maximal principal stress distribution and crack propagation path in the FEM model (a quarter of the model). FEM, finite element method.
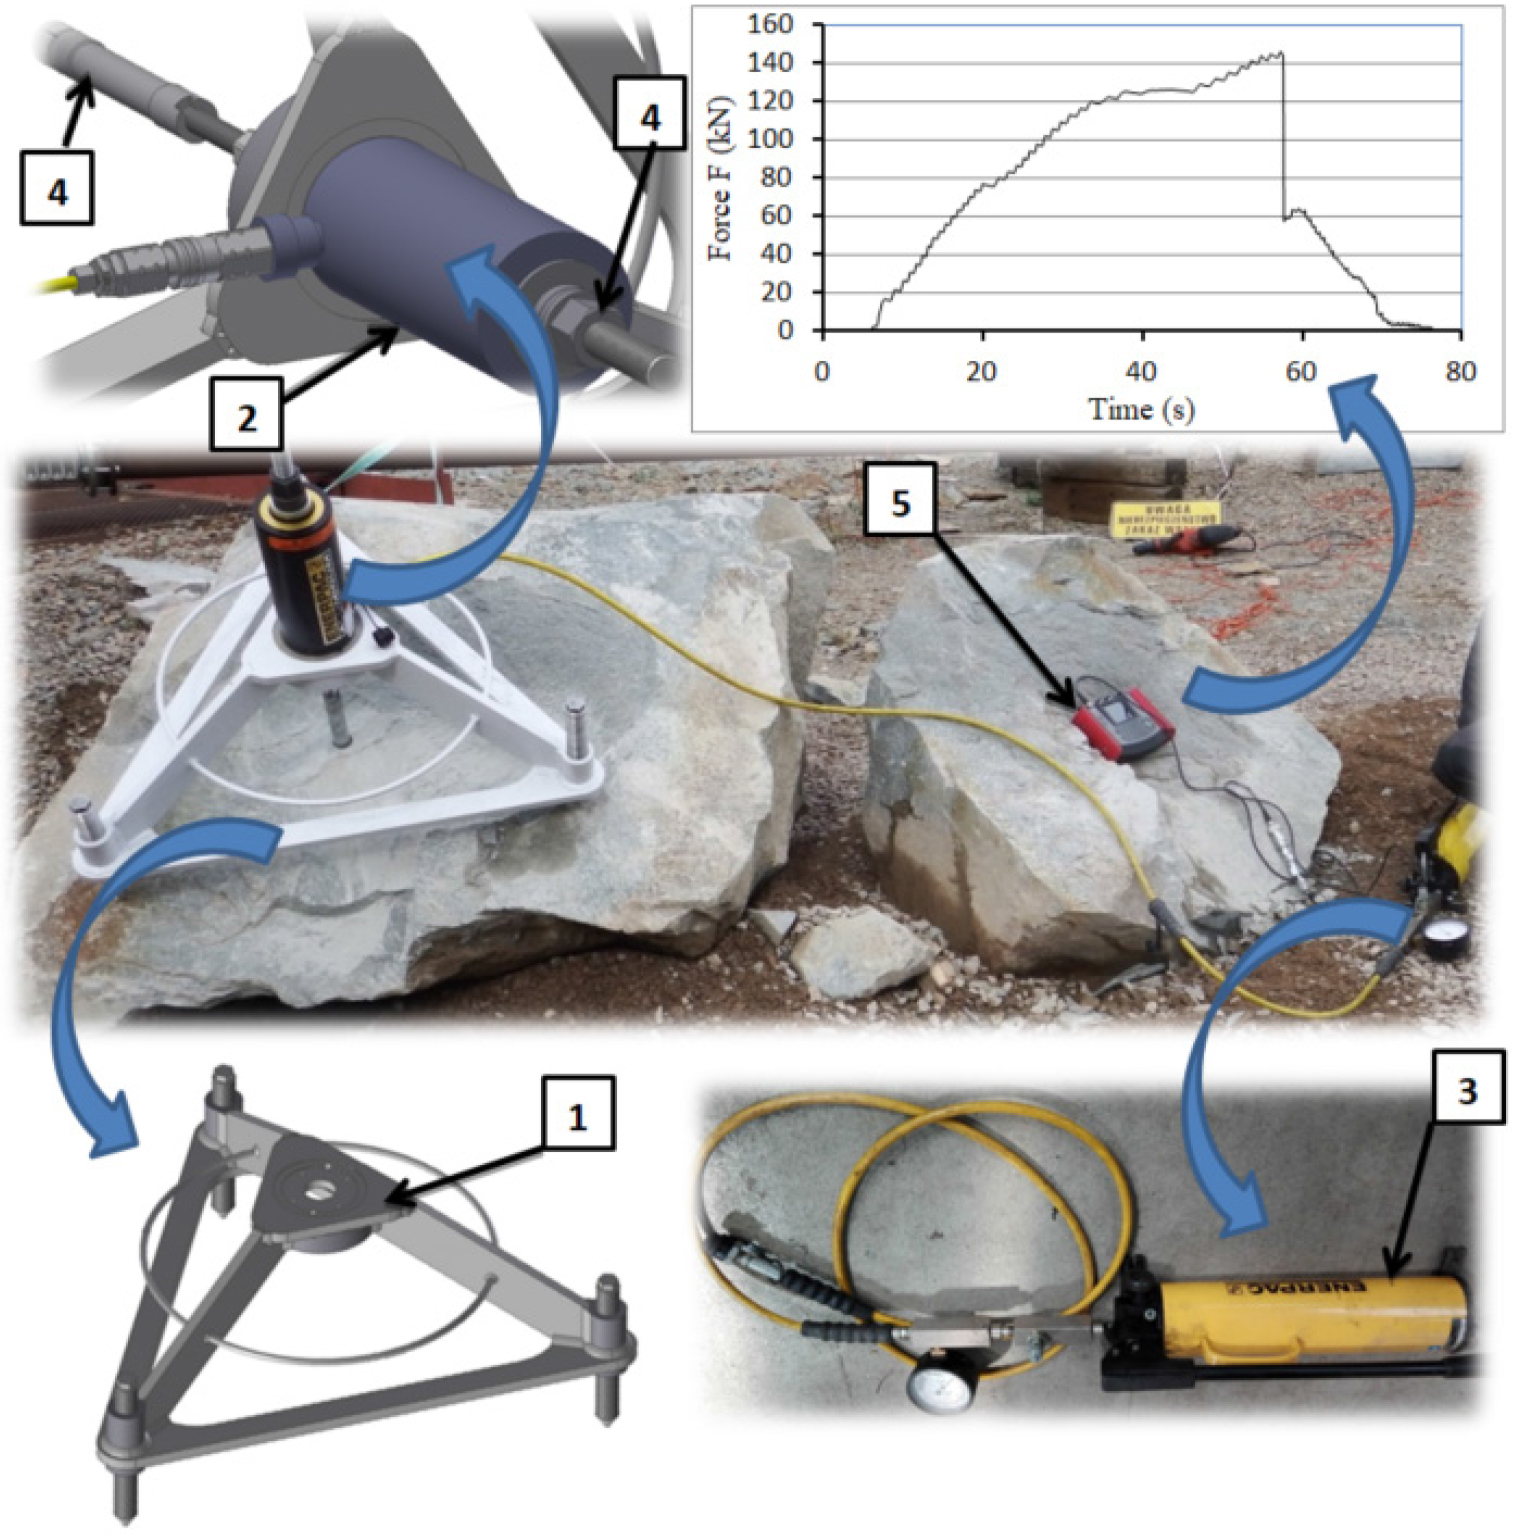
Figure 8
The RODEST test stand equipment As a standard, the testing device is equipped with the following components (Figure 8):
cylinder support,
hydraulic cylinder with a cylindrical through hole,
supply unit (hand pump + hoses, pressure gauge, connectors),
undercut anchor with fastening equipment, and
supply pressure recorder.
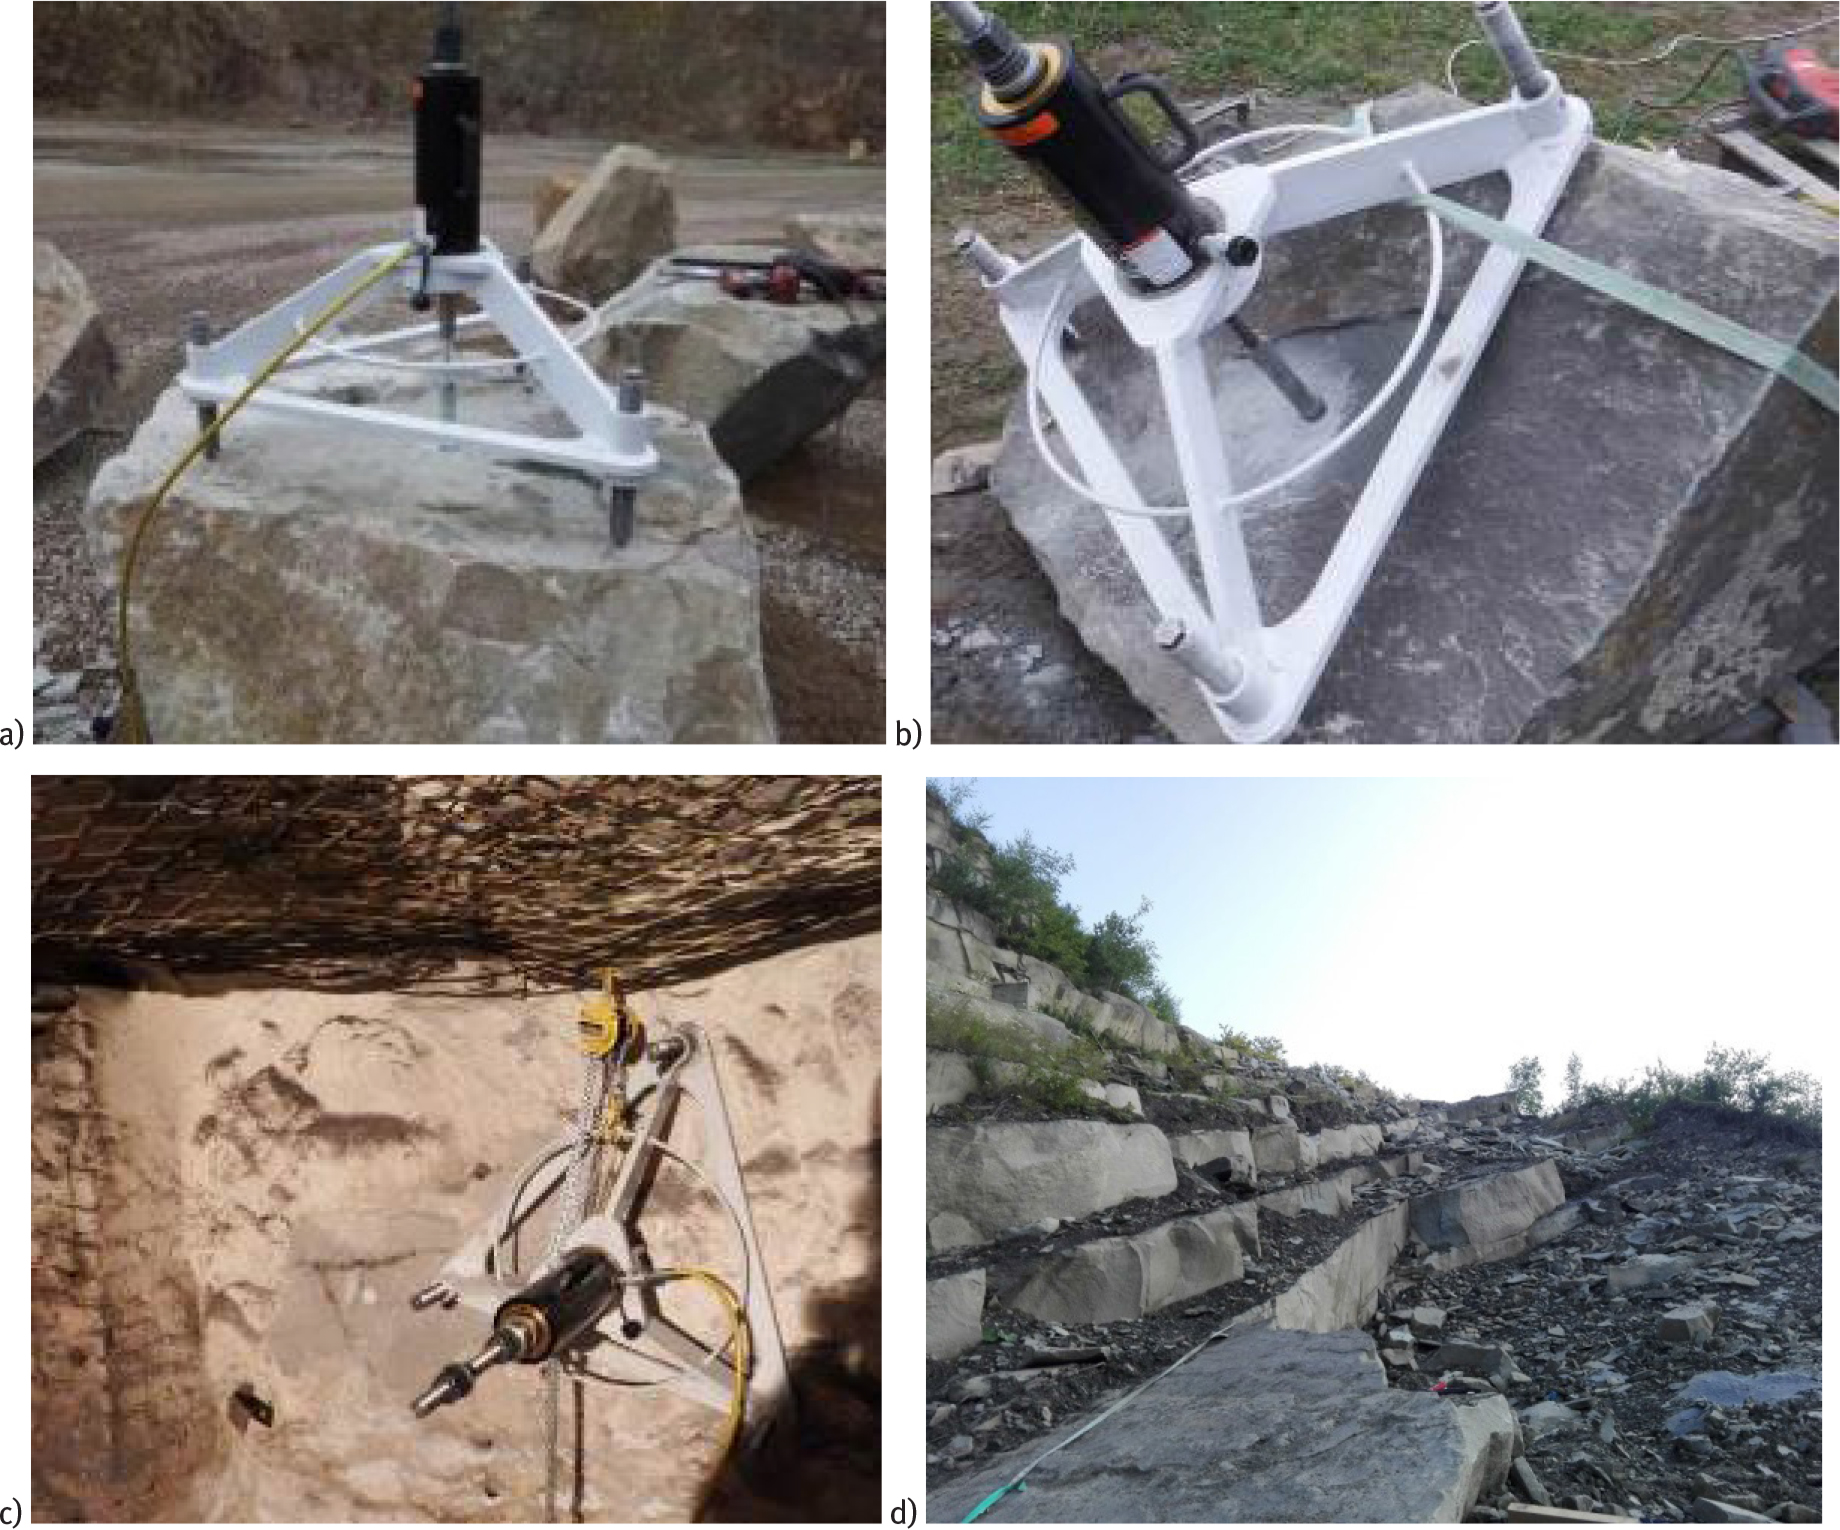
Figure 9
Place of tests: a) ZALAS, b) BRACISZÓW, c) GUIDO, d) BRENNA.
Table 1
Results of laboratory tests of the material samples [24].
| Mean values of laboratory test results | Uniaxial compression strength, Rc, | Tensile strength, Rrb, | Cohesion, c | Angle of internal friction, φ |
|---|---|---|---|---|
| Material/mine | (MPa) | (MPa) | (MPa) | (°) |
| Porphyry ZALAS | 106.5 | 5.9 | 8.6 | 54.0 |
| Sandstone BRACISZÓW | 155.3 | 8.0 | 14.5 | 49.5 |
| Sandstone GUIDO | 97.4 | 6.2 | 11.9 | 49.6 |
| Sandstone BRENNA | 58.8 | 3.9 | 6.0 | 53.0 |
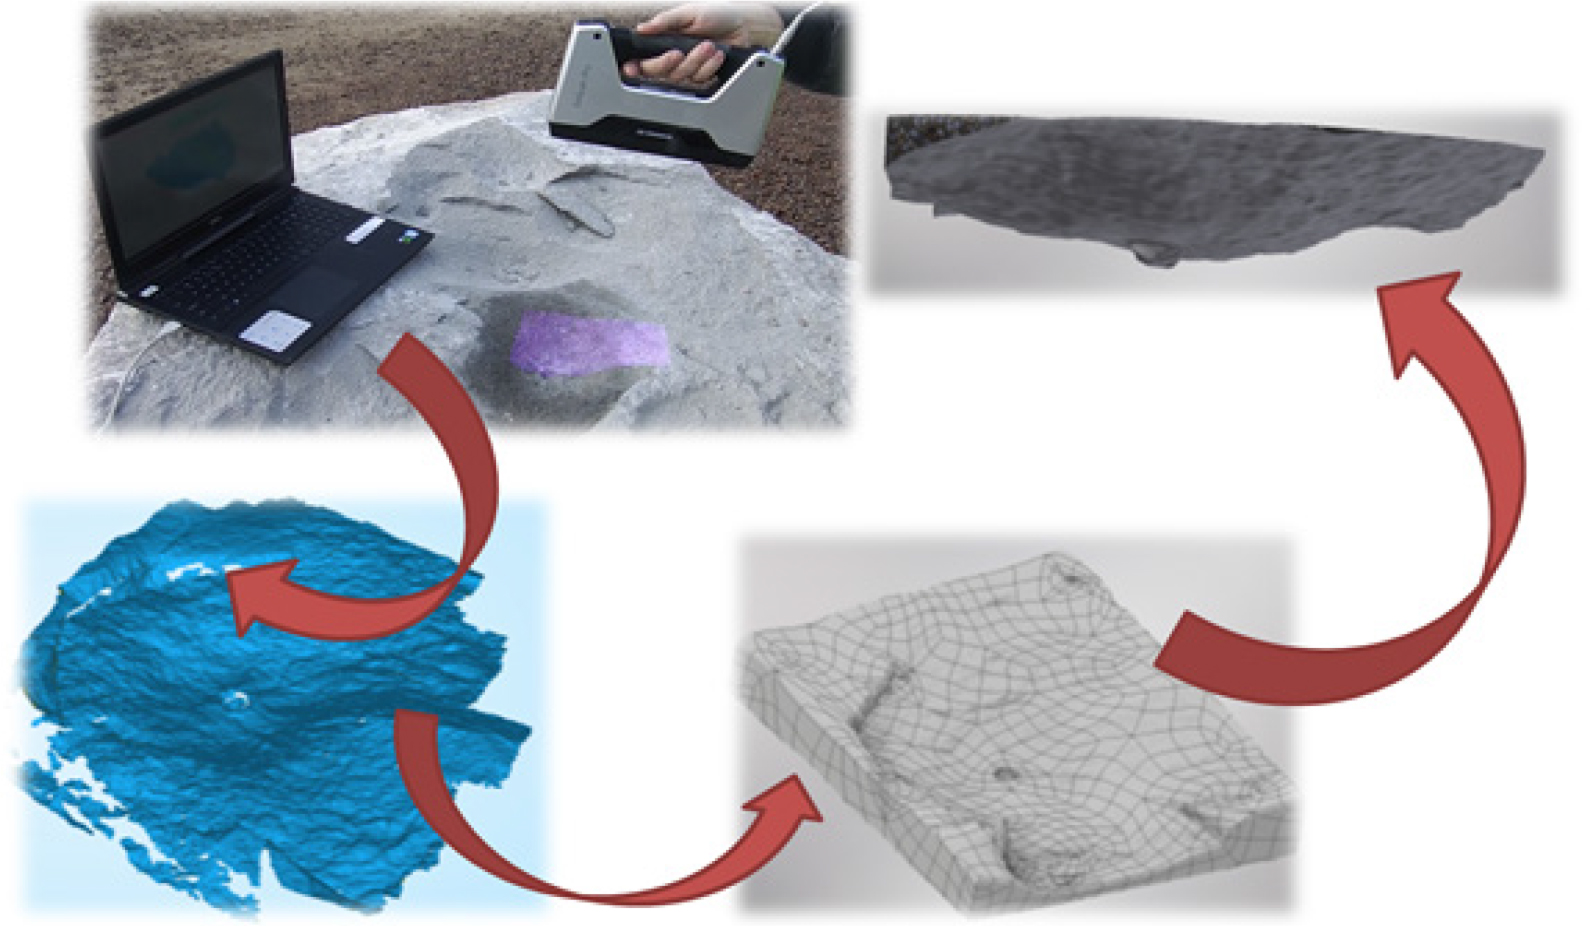
Figure 10
Scheme of processing the scans of rocks surfaces after their loosening.
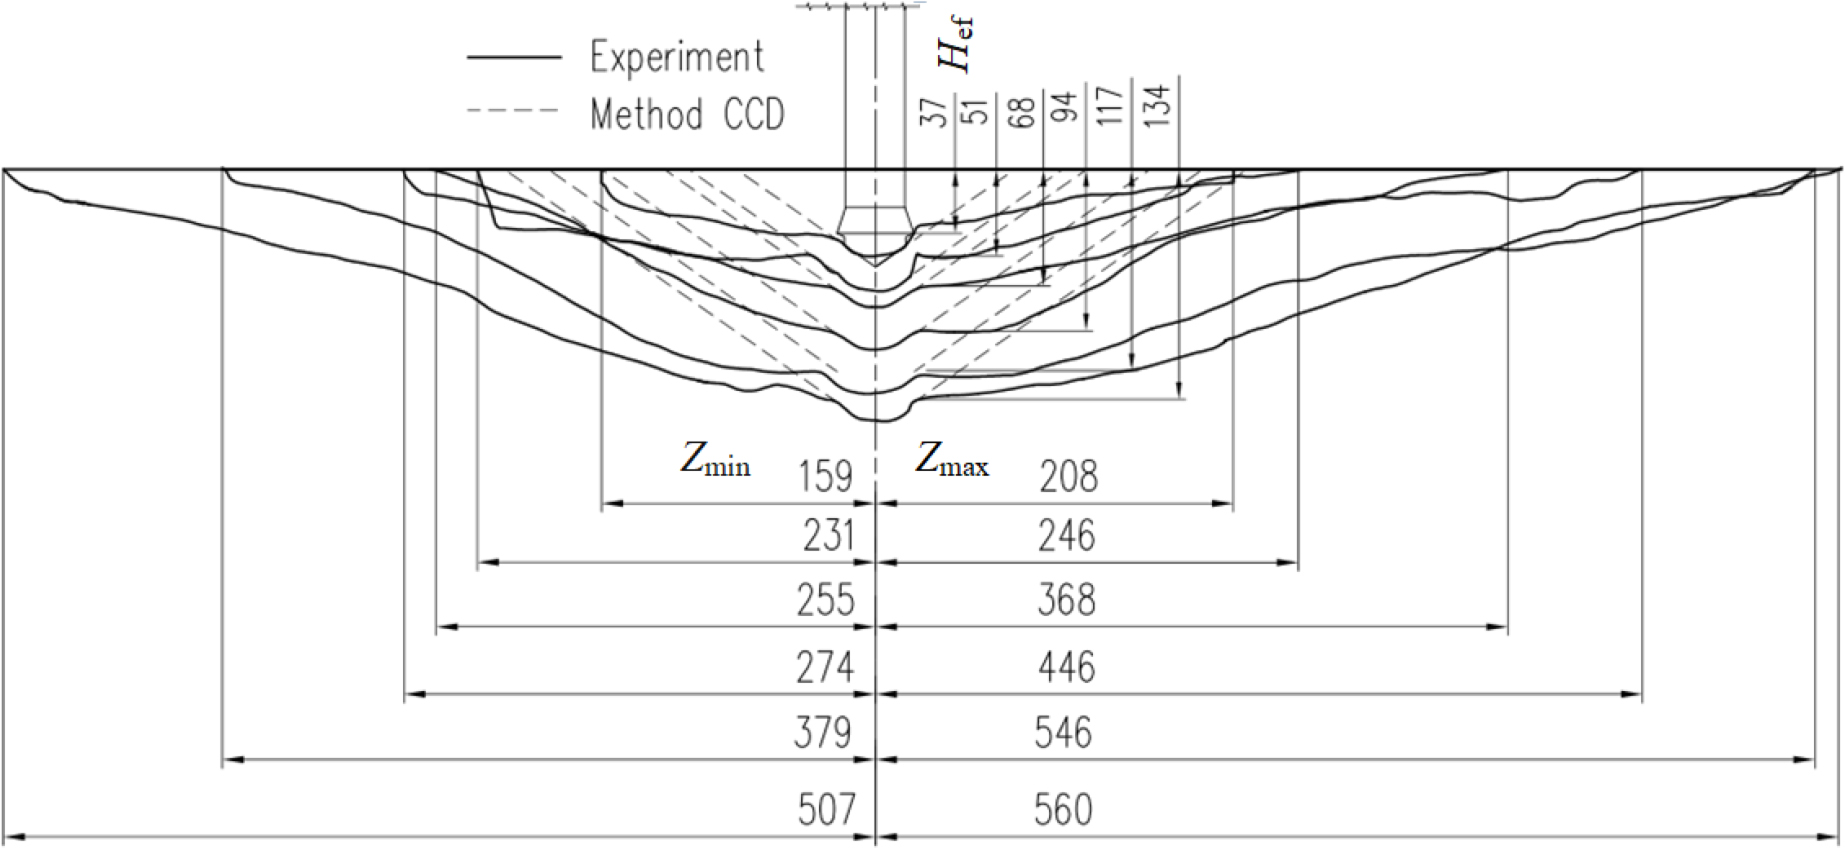
Figure 11
Examples of a cross-sections through a loosened rock, specifying the effective anchoring depth Hef, maximum Zmax, and minimum Zmin loosening range (on the example of BRENNA mine). CCD, concrete capacity design.
Table 2
Number of successful rock loosening attempts.
| Material/mine | Number of successful loosening attempts |
|---|---|
| Porphyry ZALAS | 30 |
| Sandstone BRACISZÓW | 27 |
| Sandstone GUIDO | 36 |
| Sandstone BRENNA | 22 |
| Σ115 |
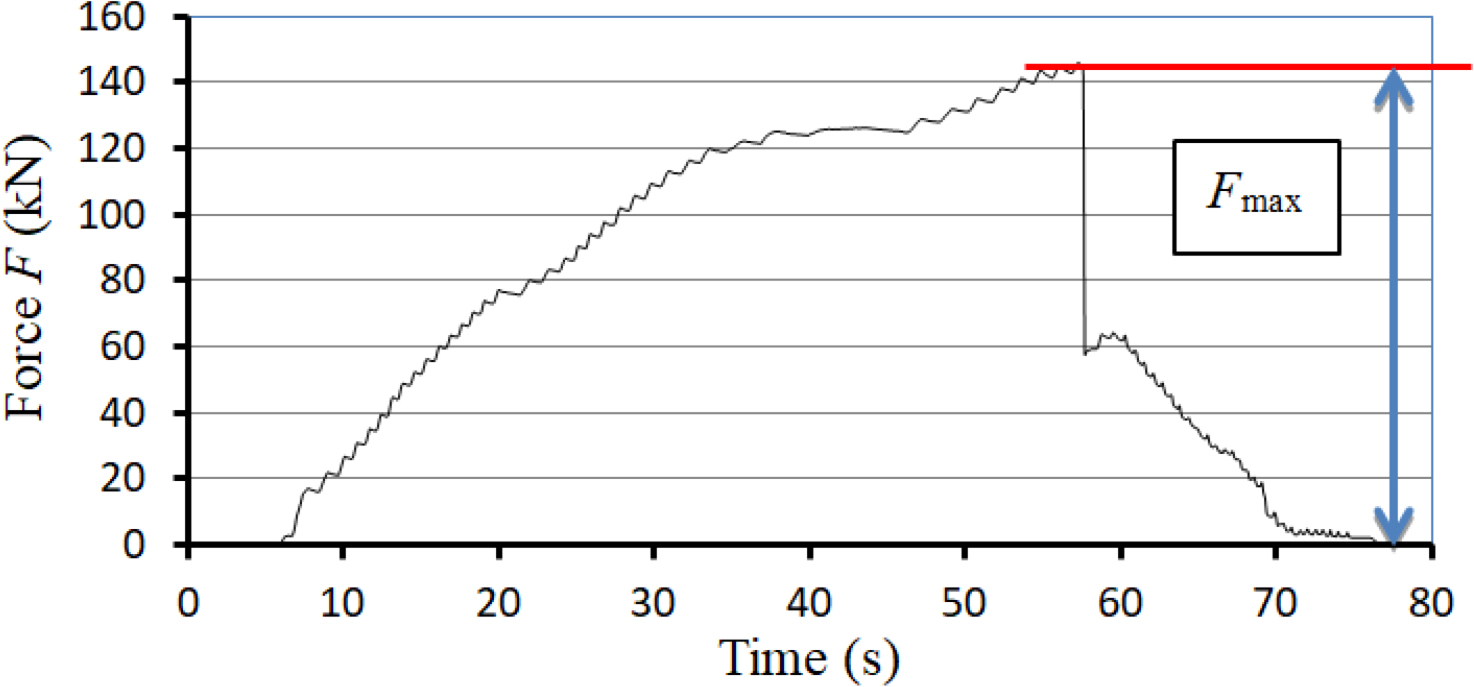
Figure 12
Determination of maximum force Fmax, recorded during the loosening test.
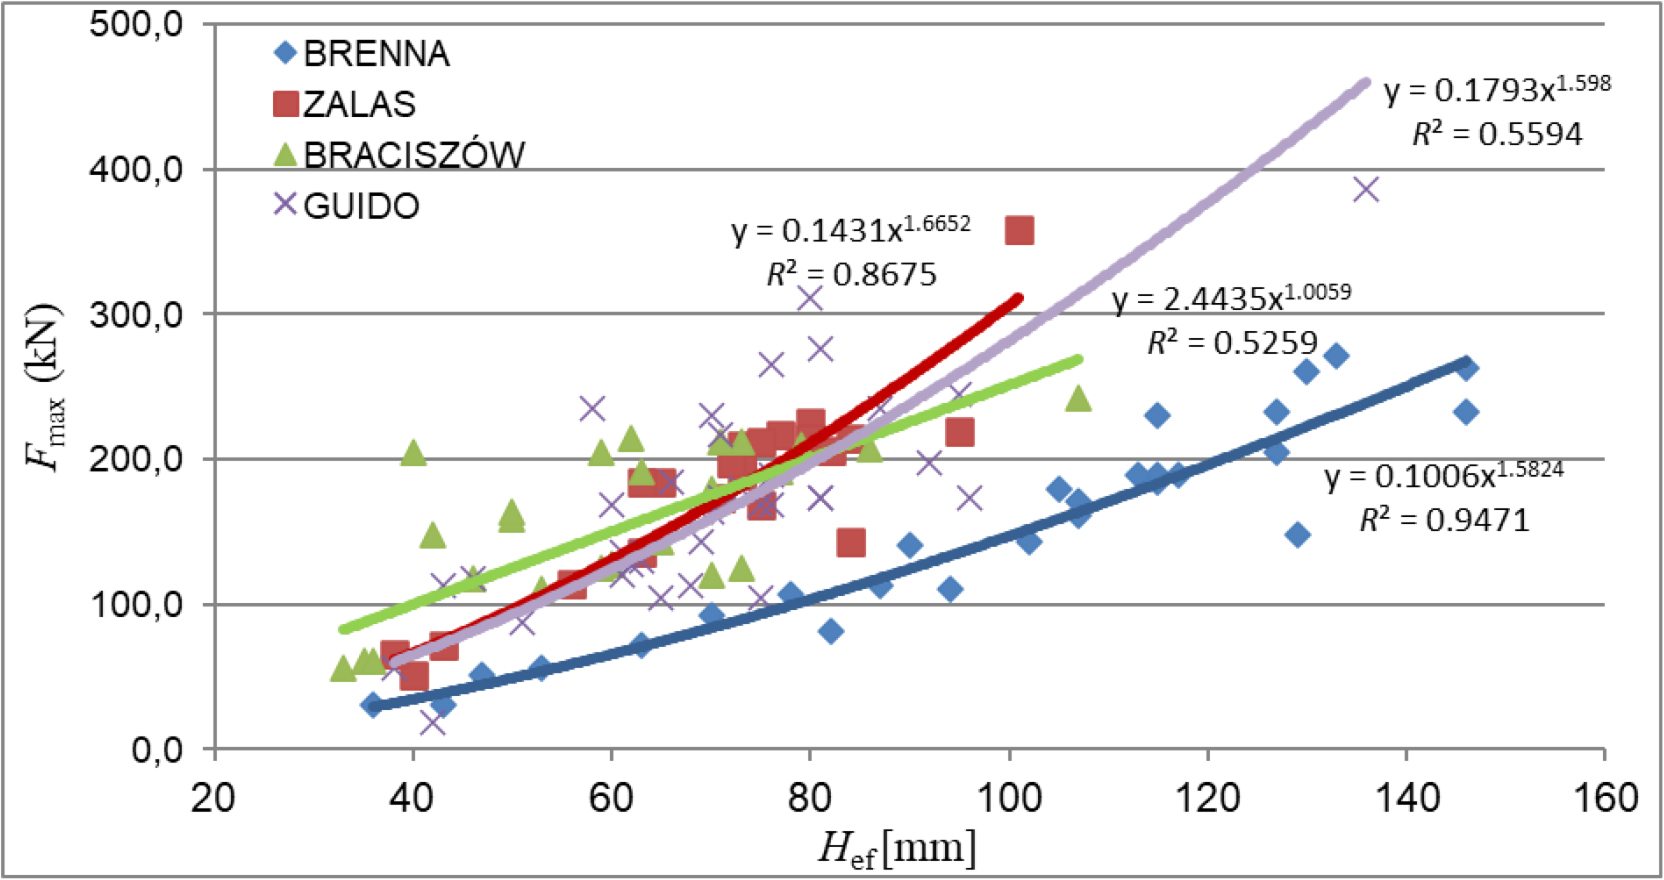
Figure 13
Curves of maximum loosening force Fmax in relation to the effective anchoring depth Hef for different rock types.
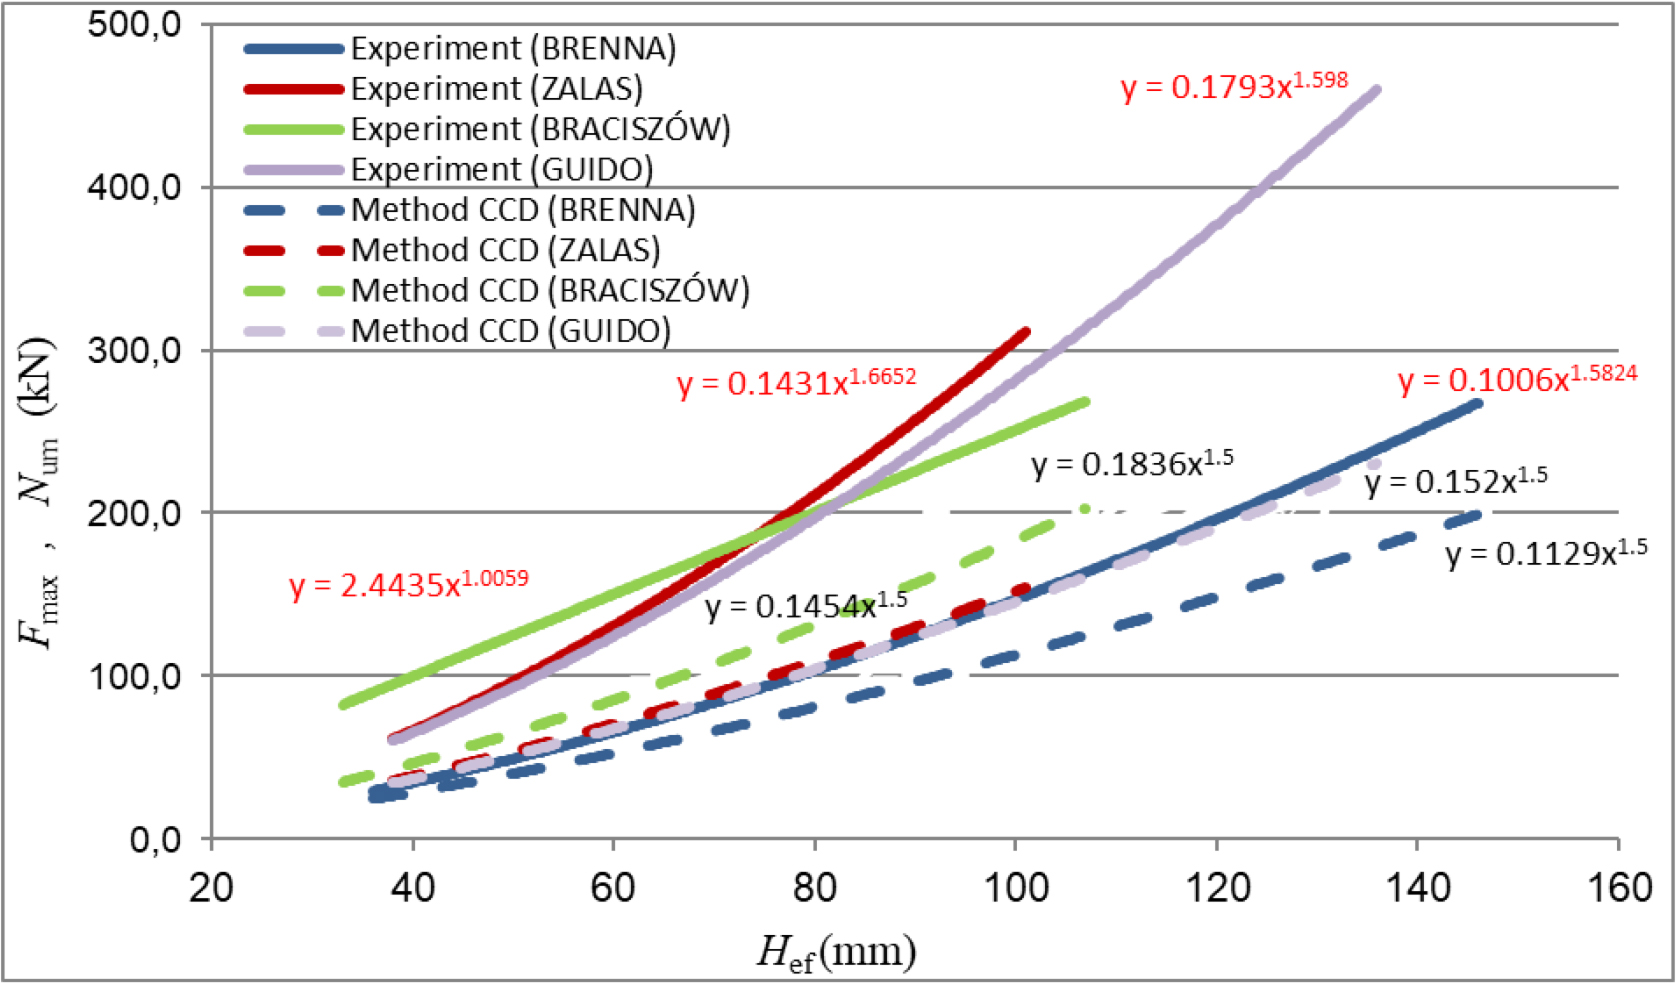
Figure 14
Curves drawn using the maximum loosening forces Fmax determined experimentally (Figure 13) with the anchoring load capacity Nu,m calculated from equation (2).
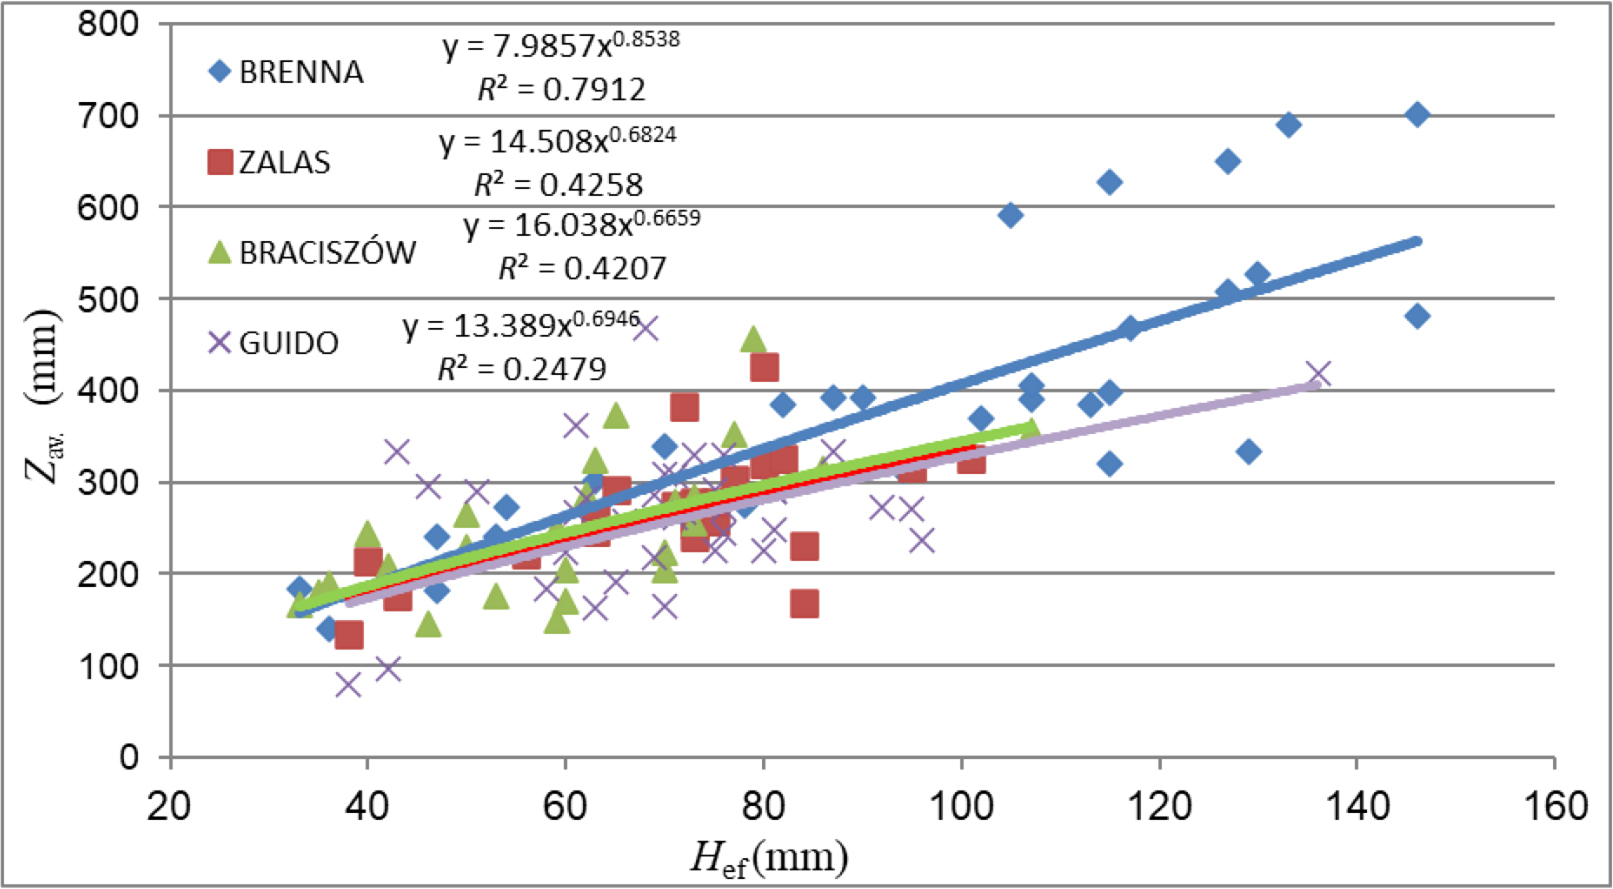
Figure 15
Curves of mean range values Zav. in relation to the effective anchoring depth Hef for different rock types.
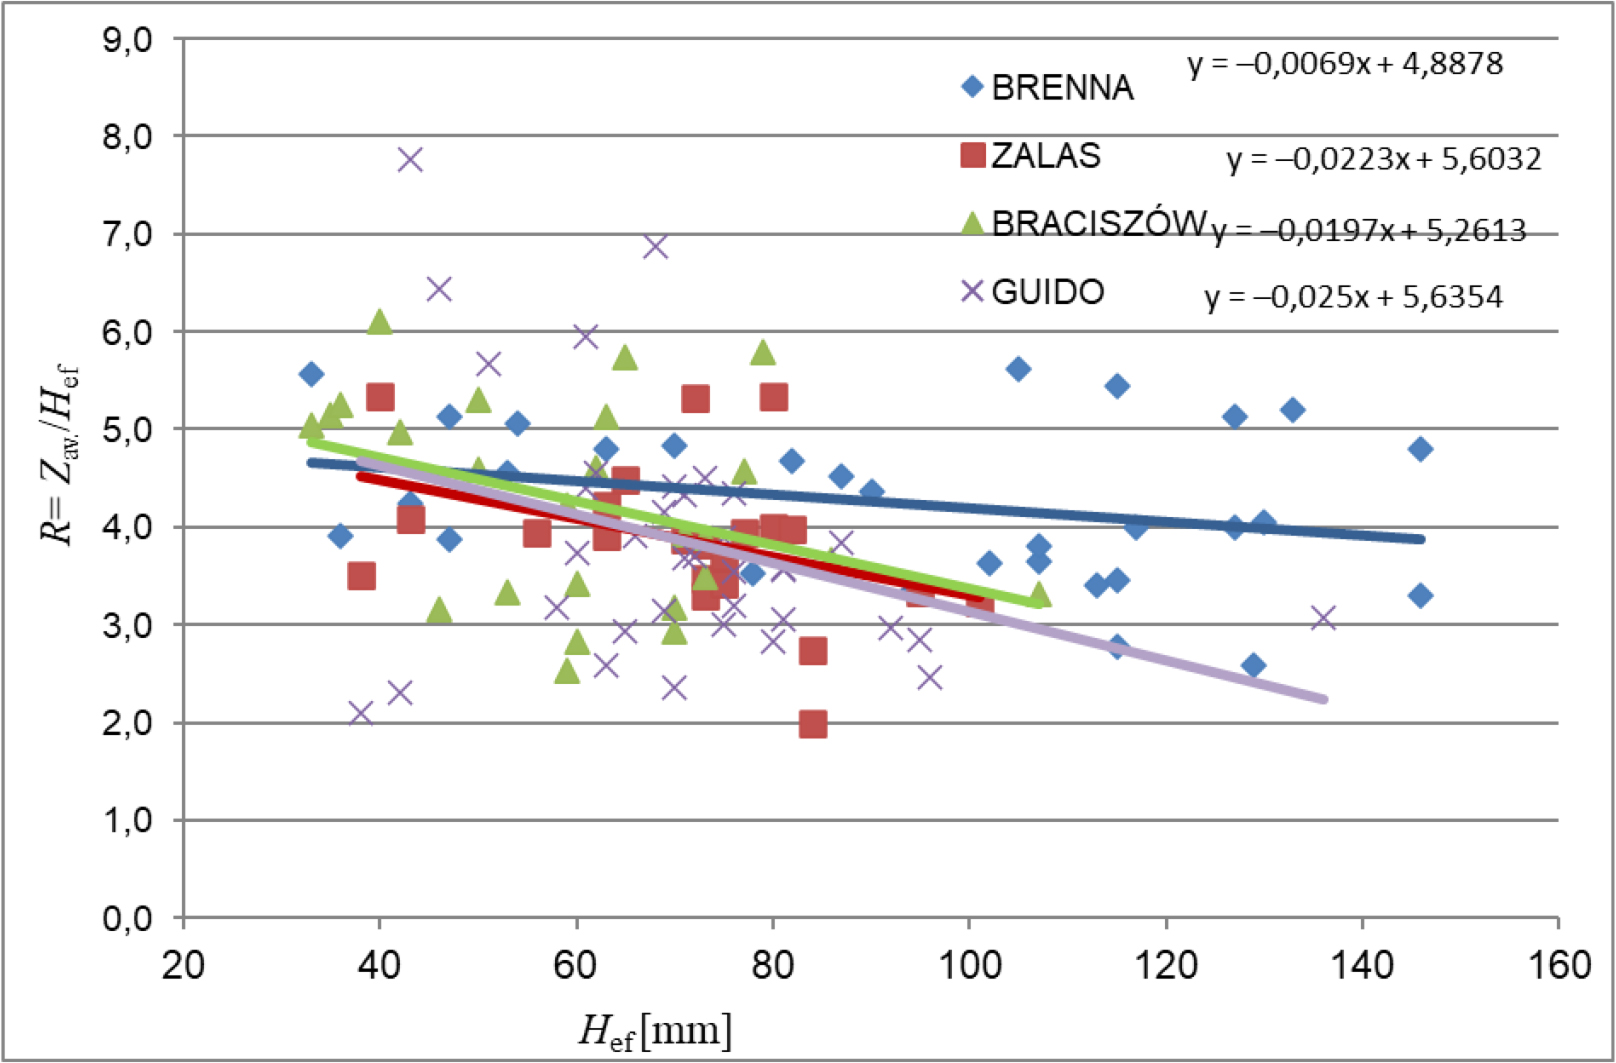
Figure 16
Changes in the coefficient R in relation to the effective anchoring depth Hef for different types of rocks.
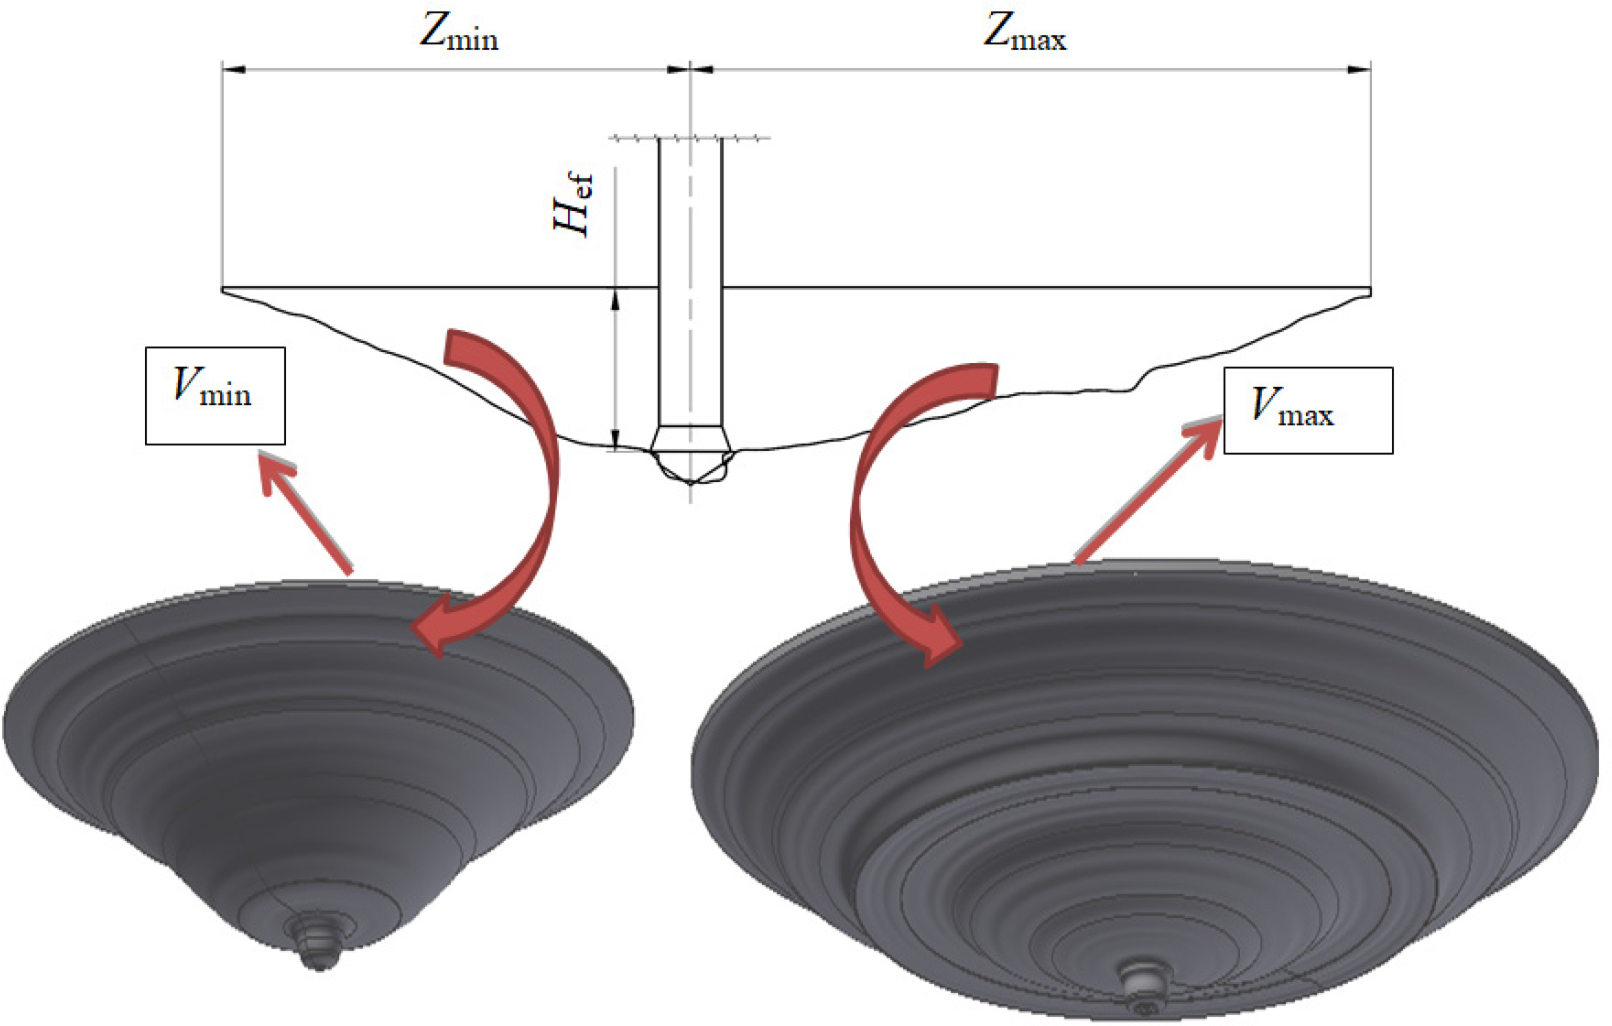
Figure 17
Schematic presentation of the procedure for determination of loosened rocks’ surface area and volume.
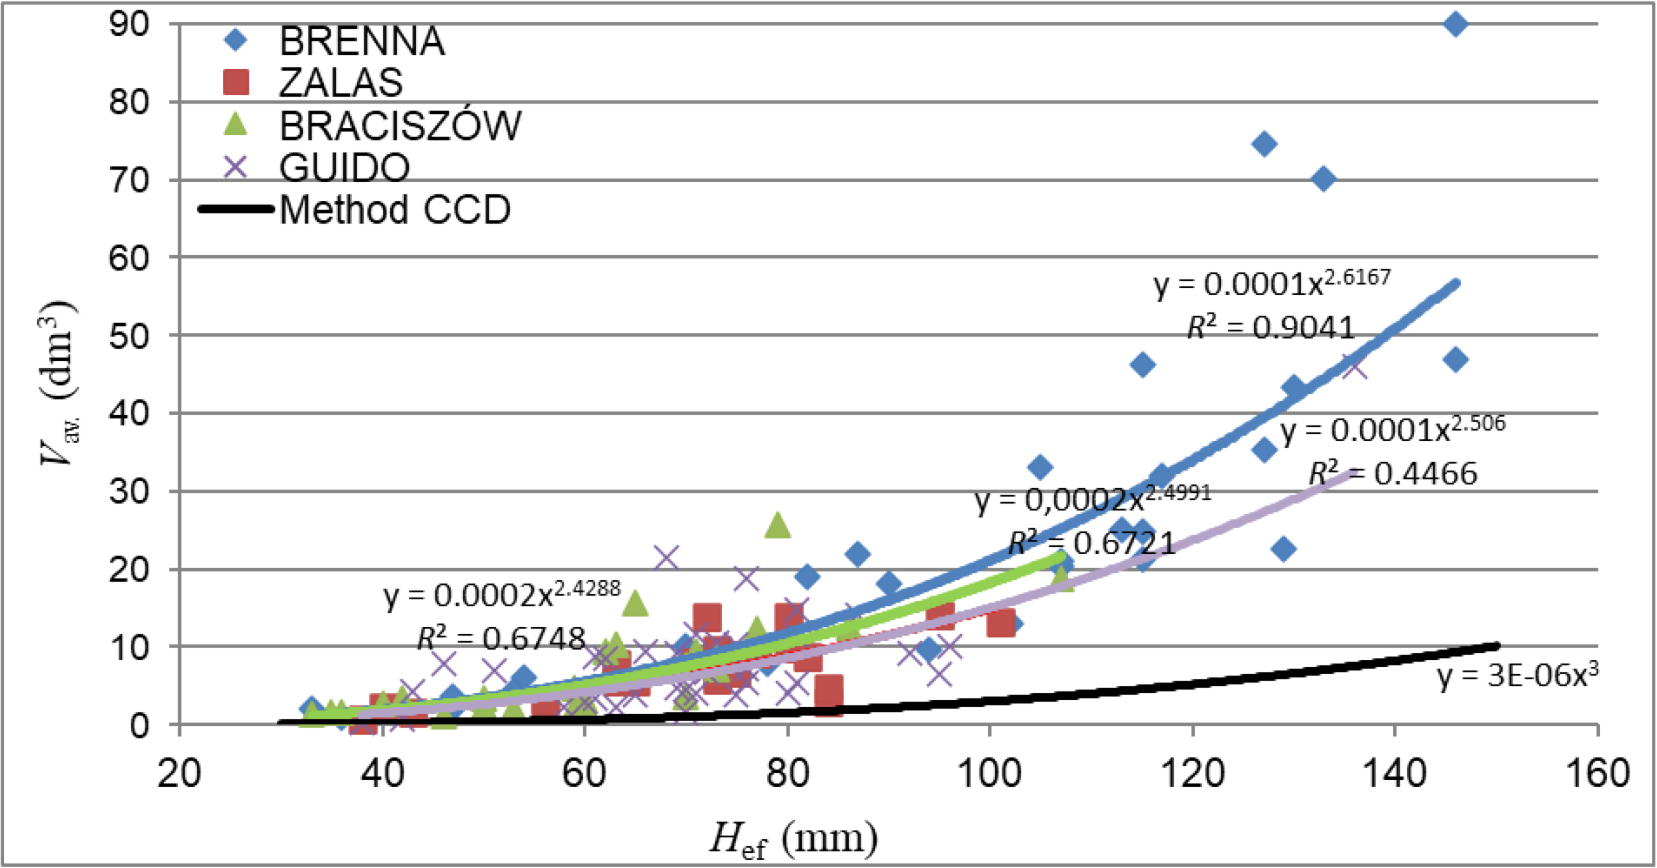
Figure 18
Curves of mean volumes Vav. versus the effective anchoring depth Hef for different rock types with the volume function based on CCD method. CCD, concrete capacity design.