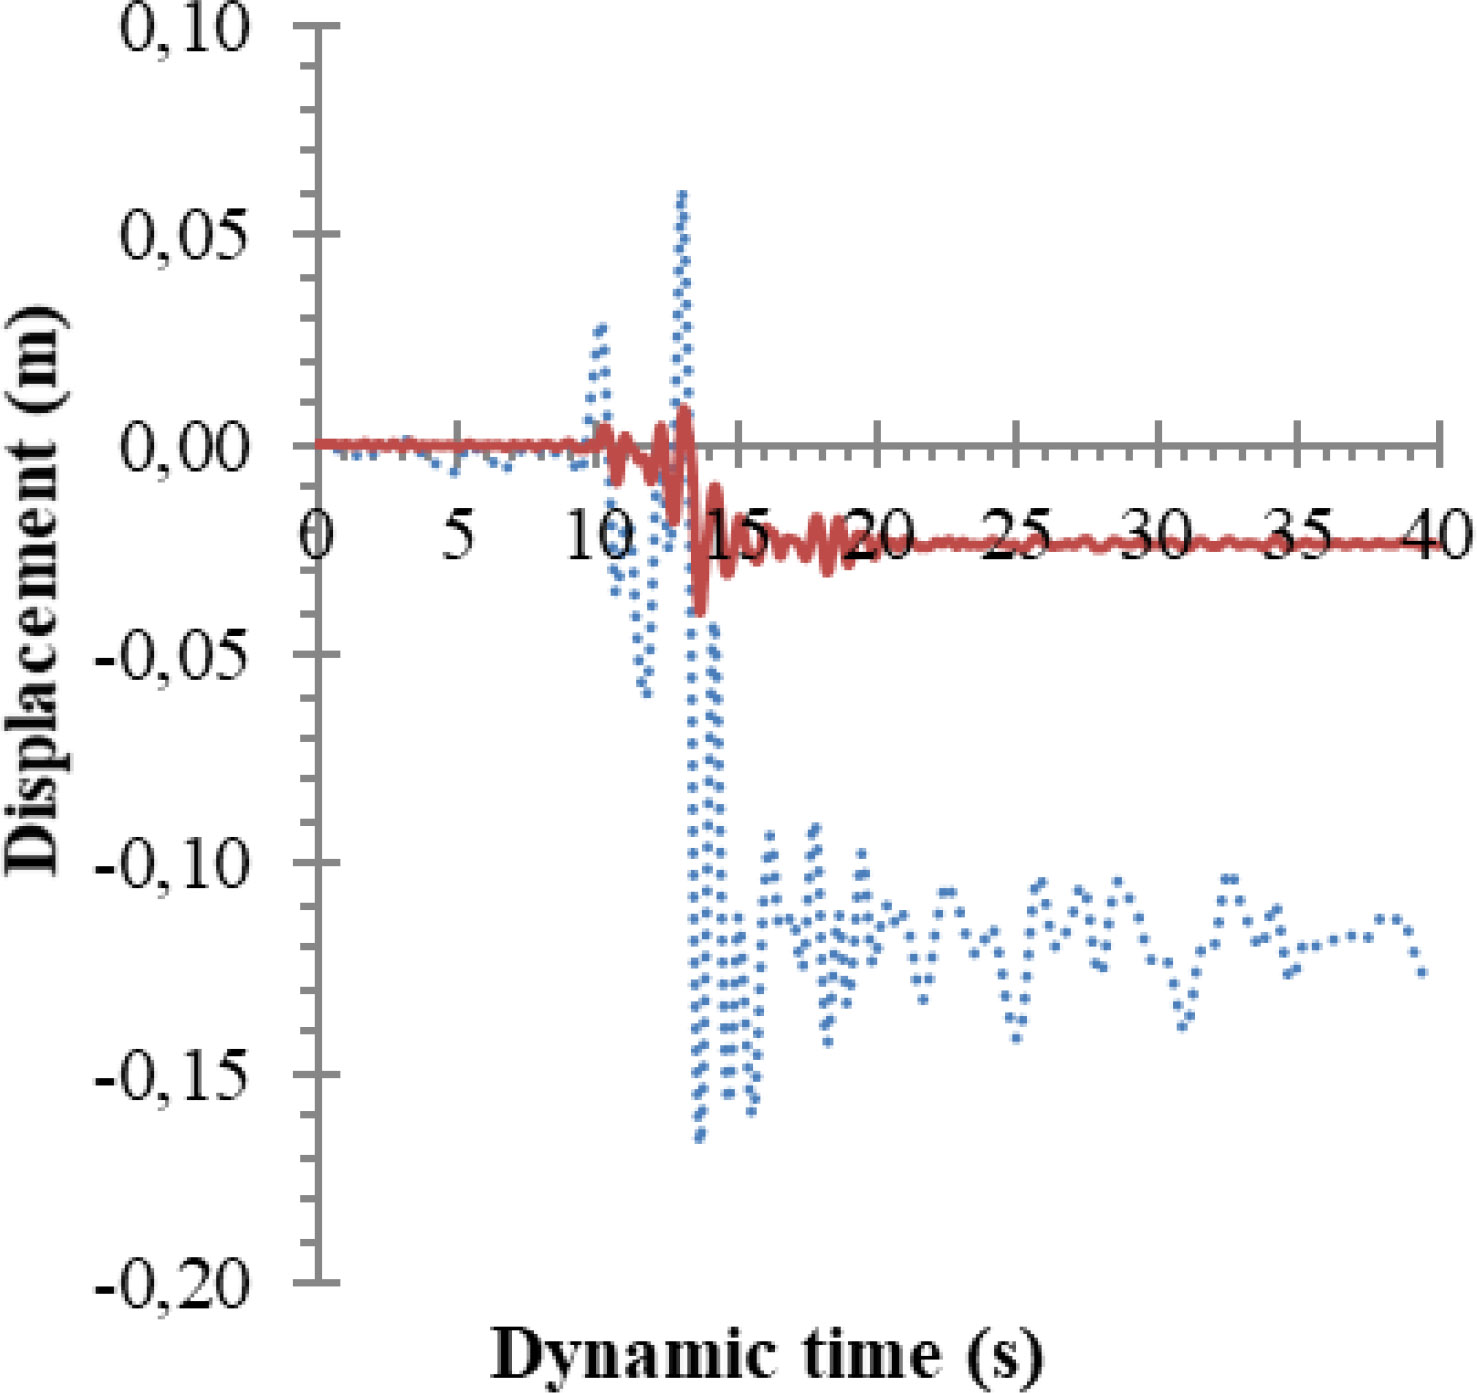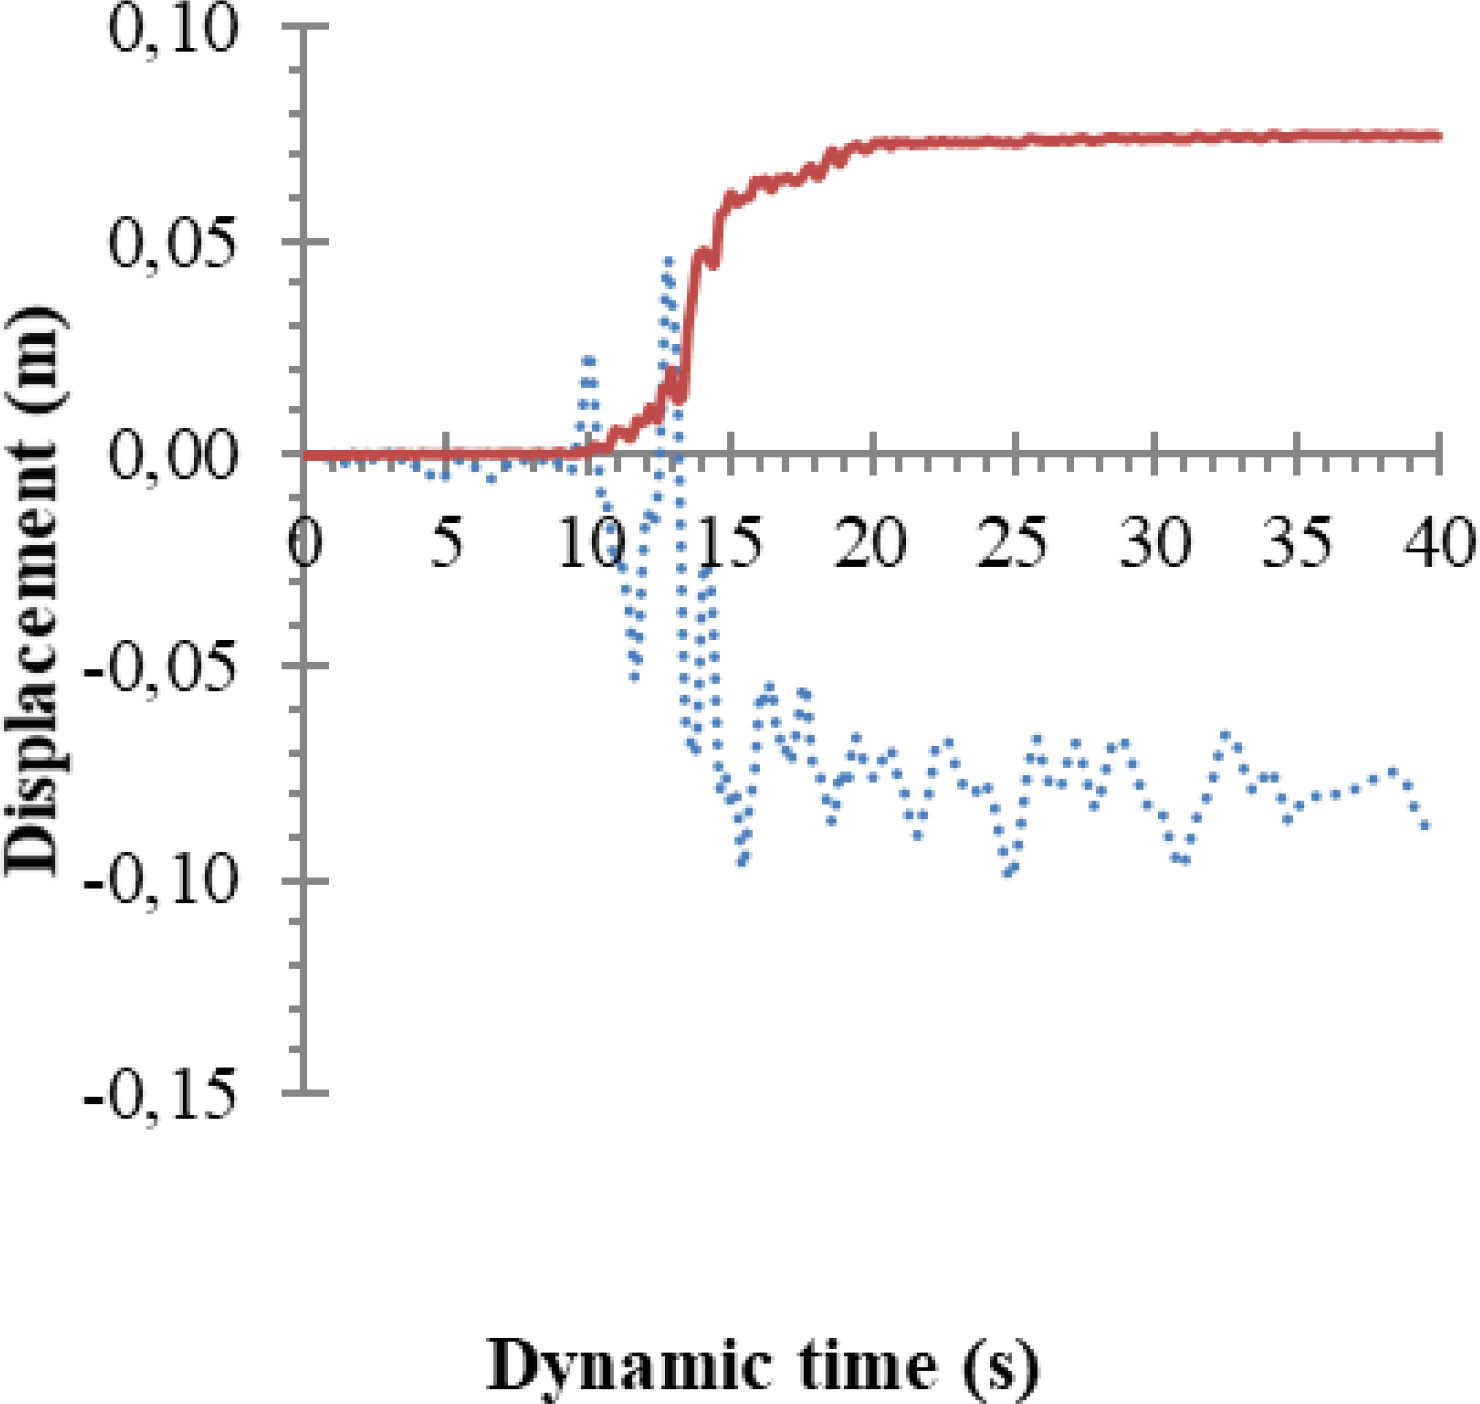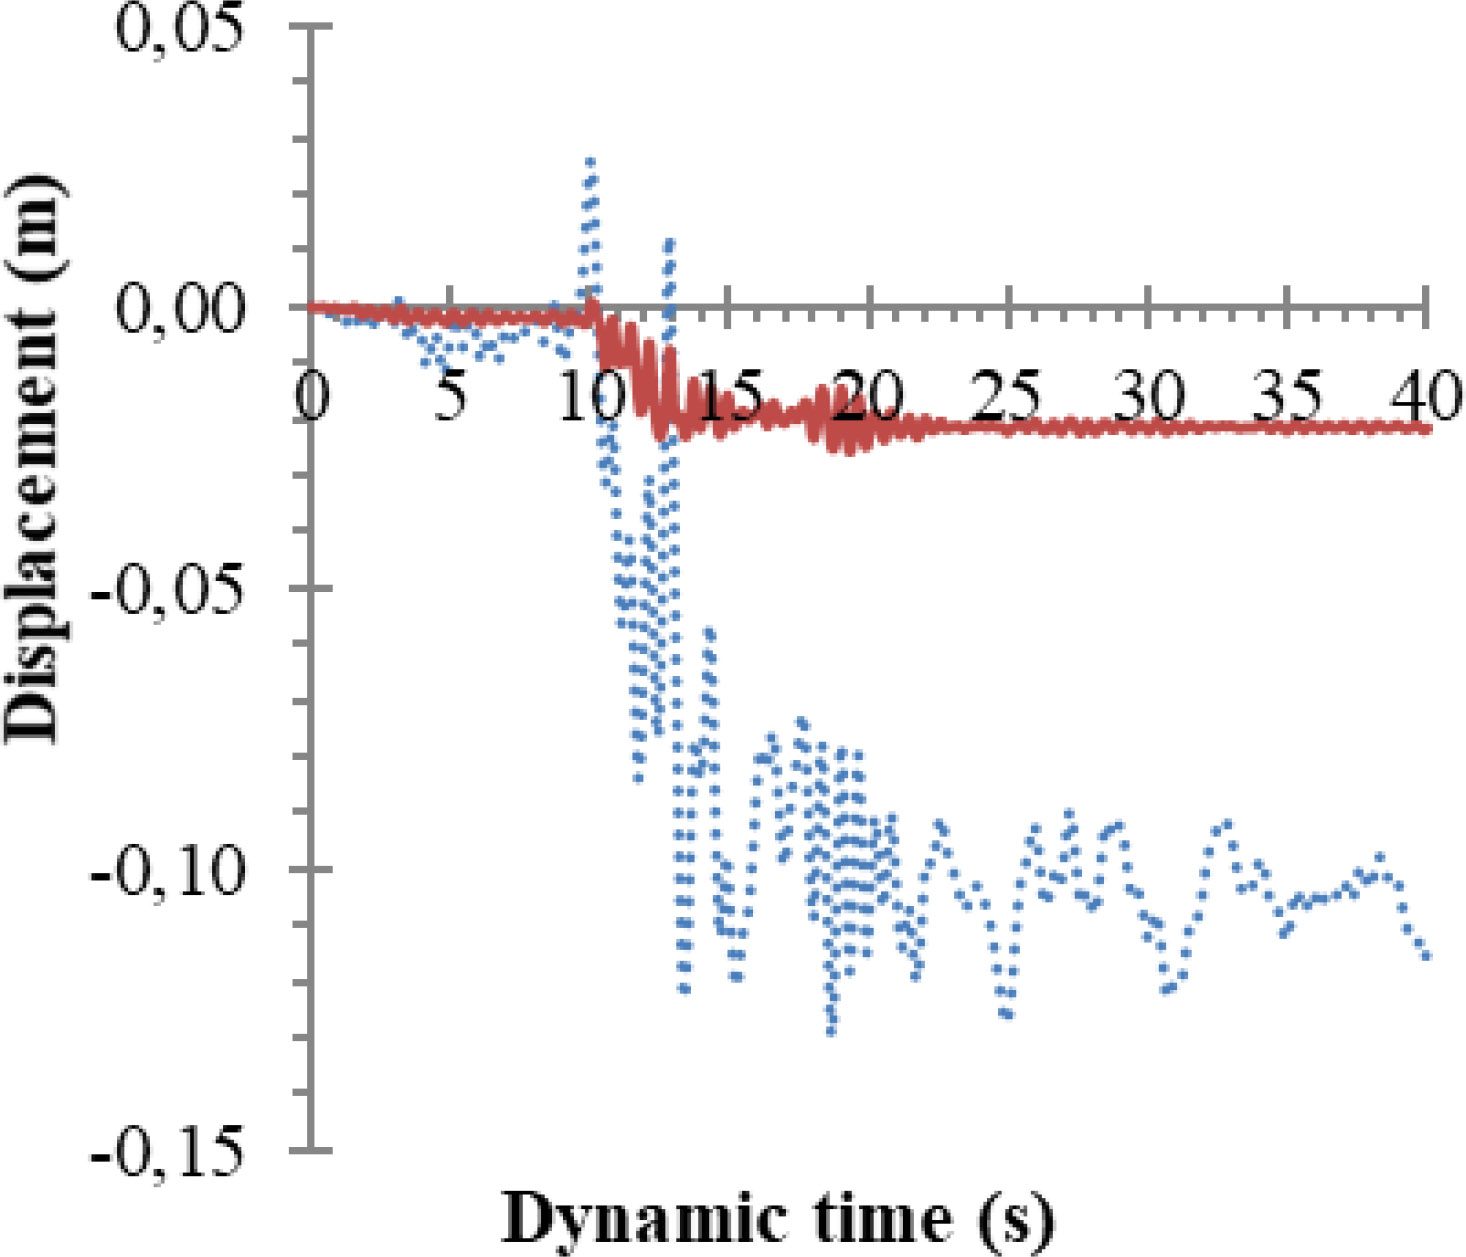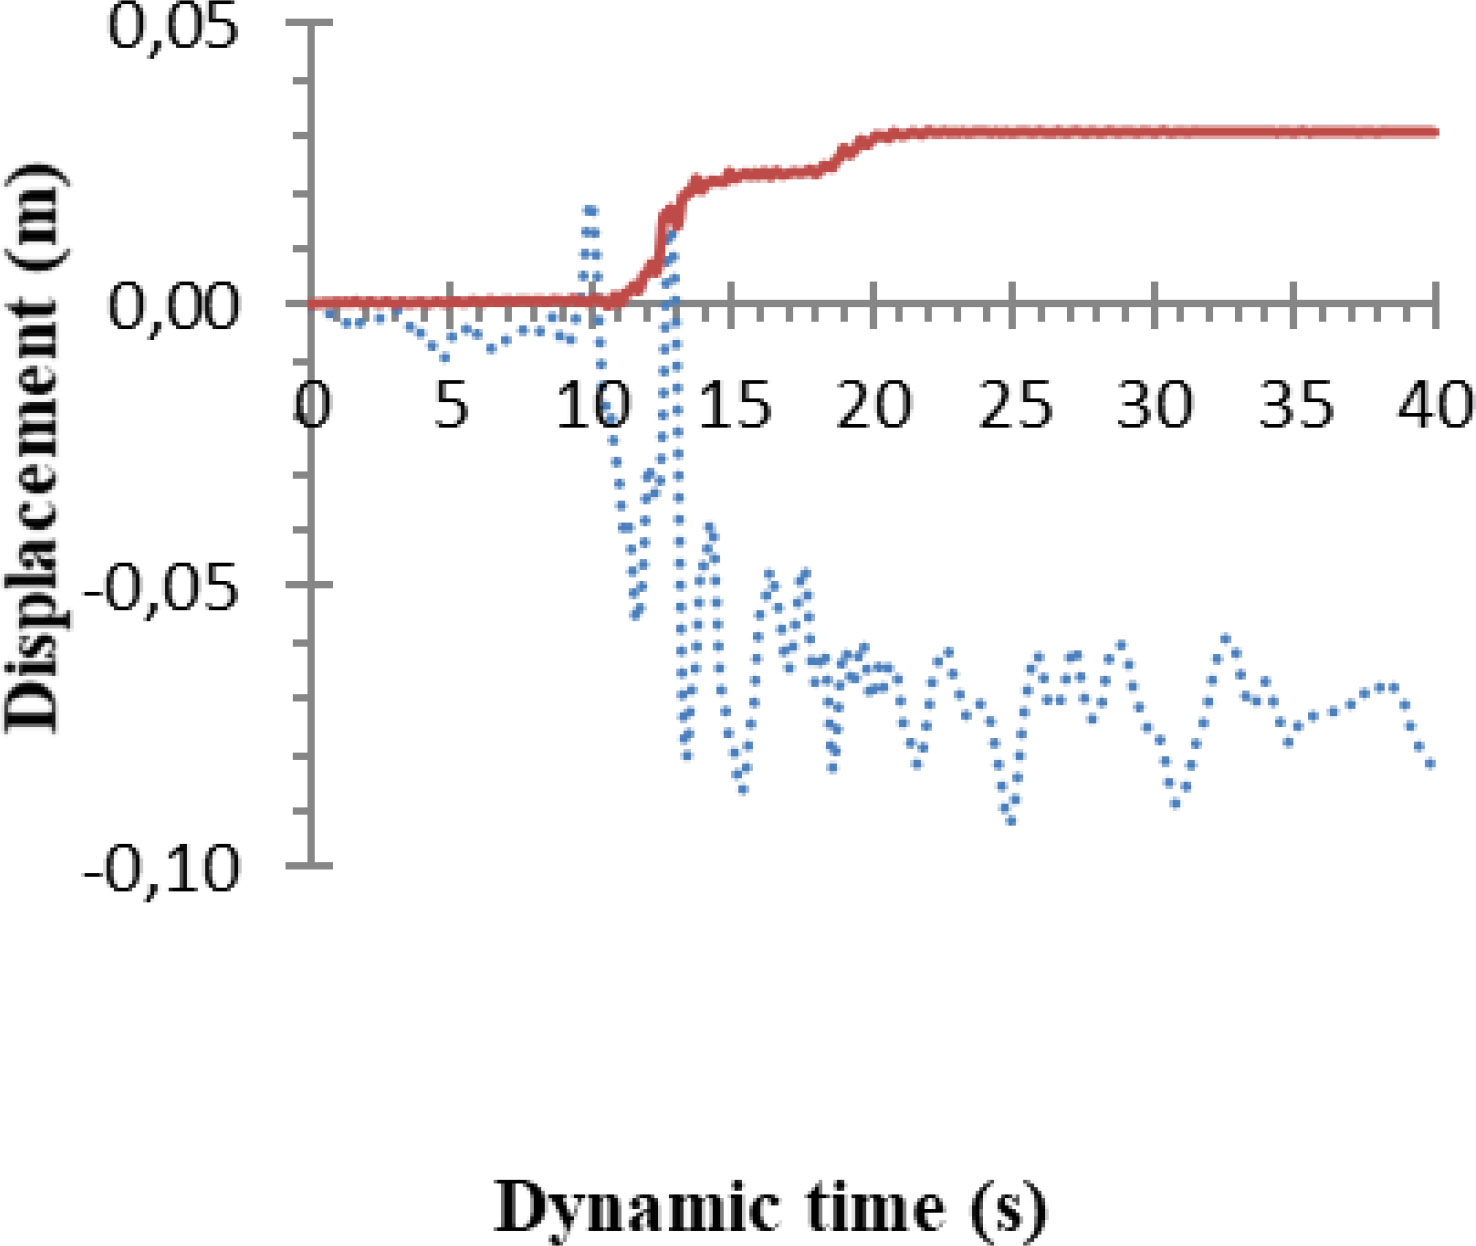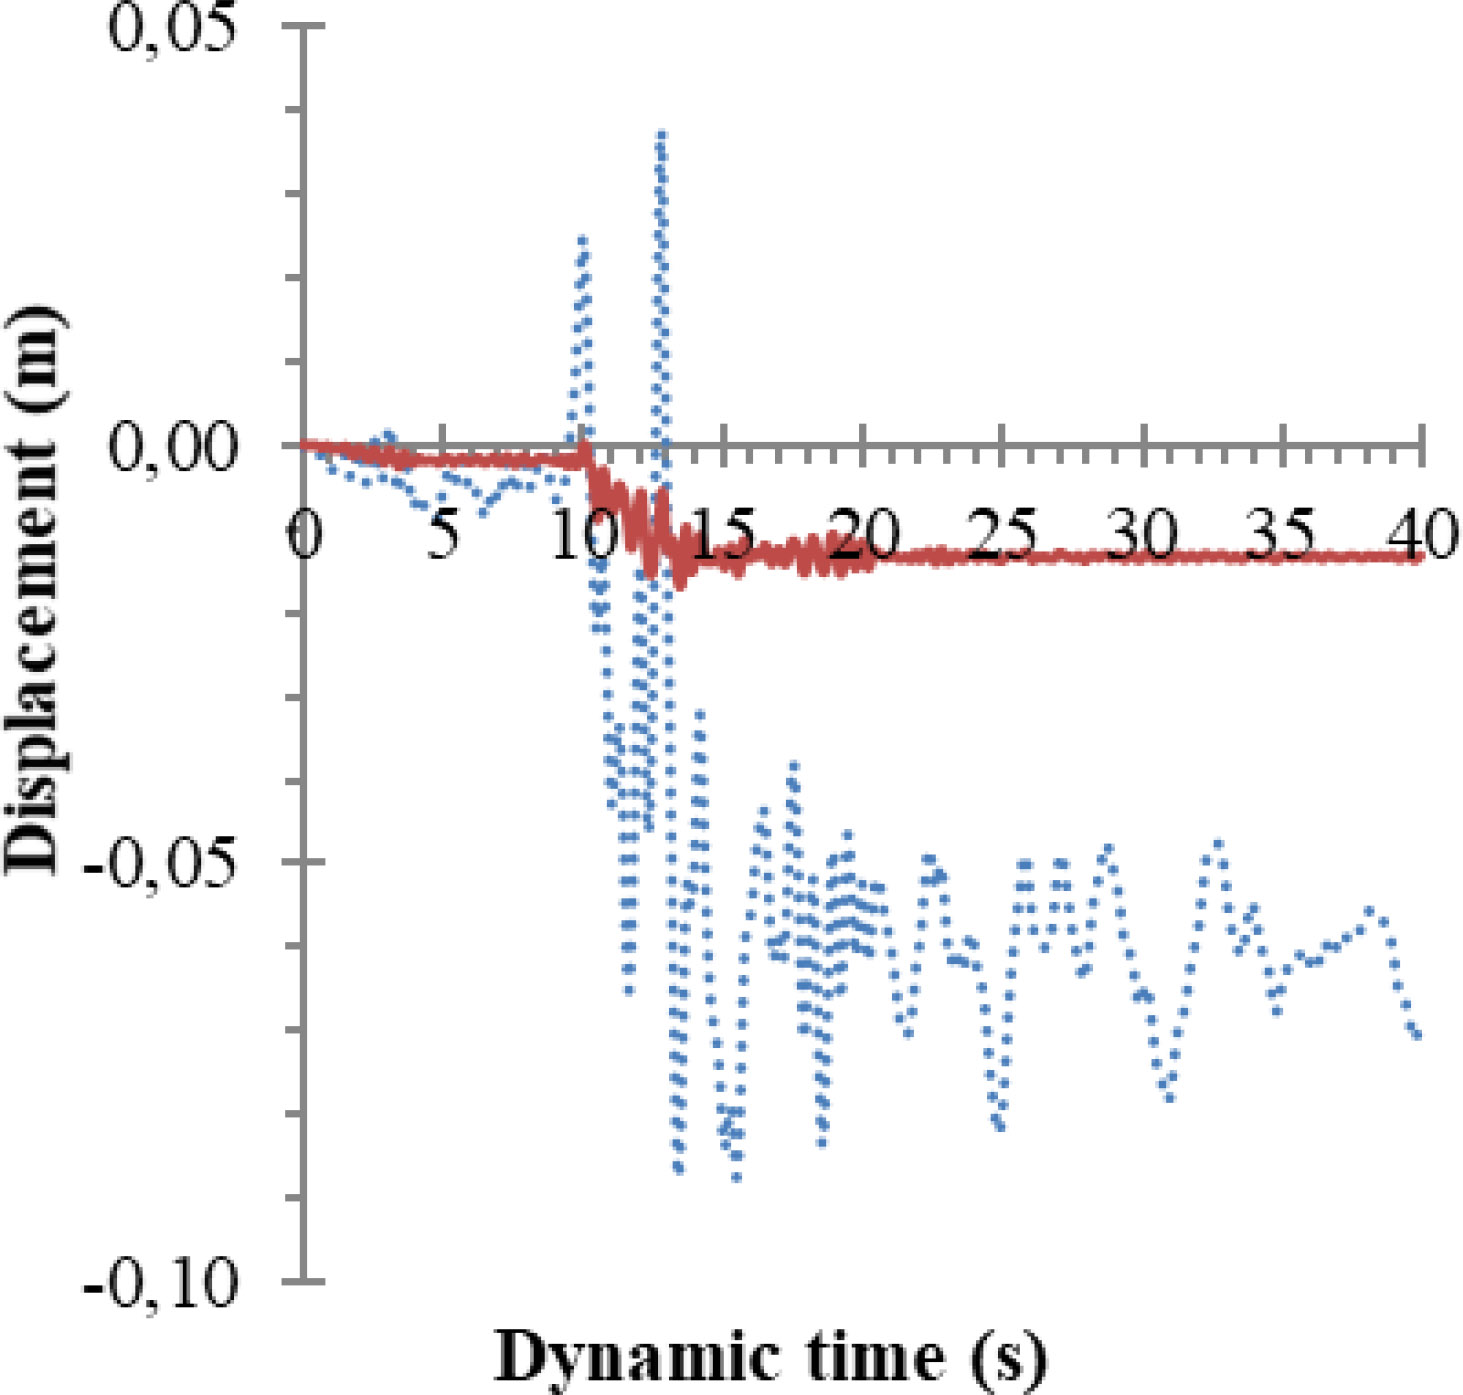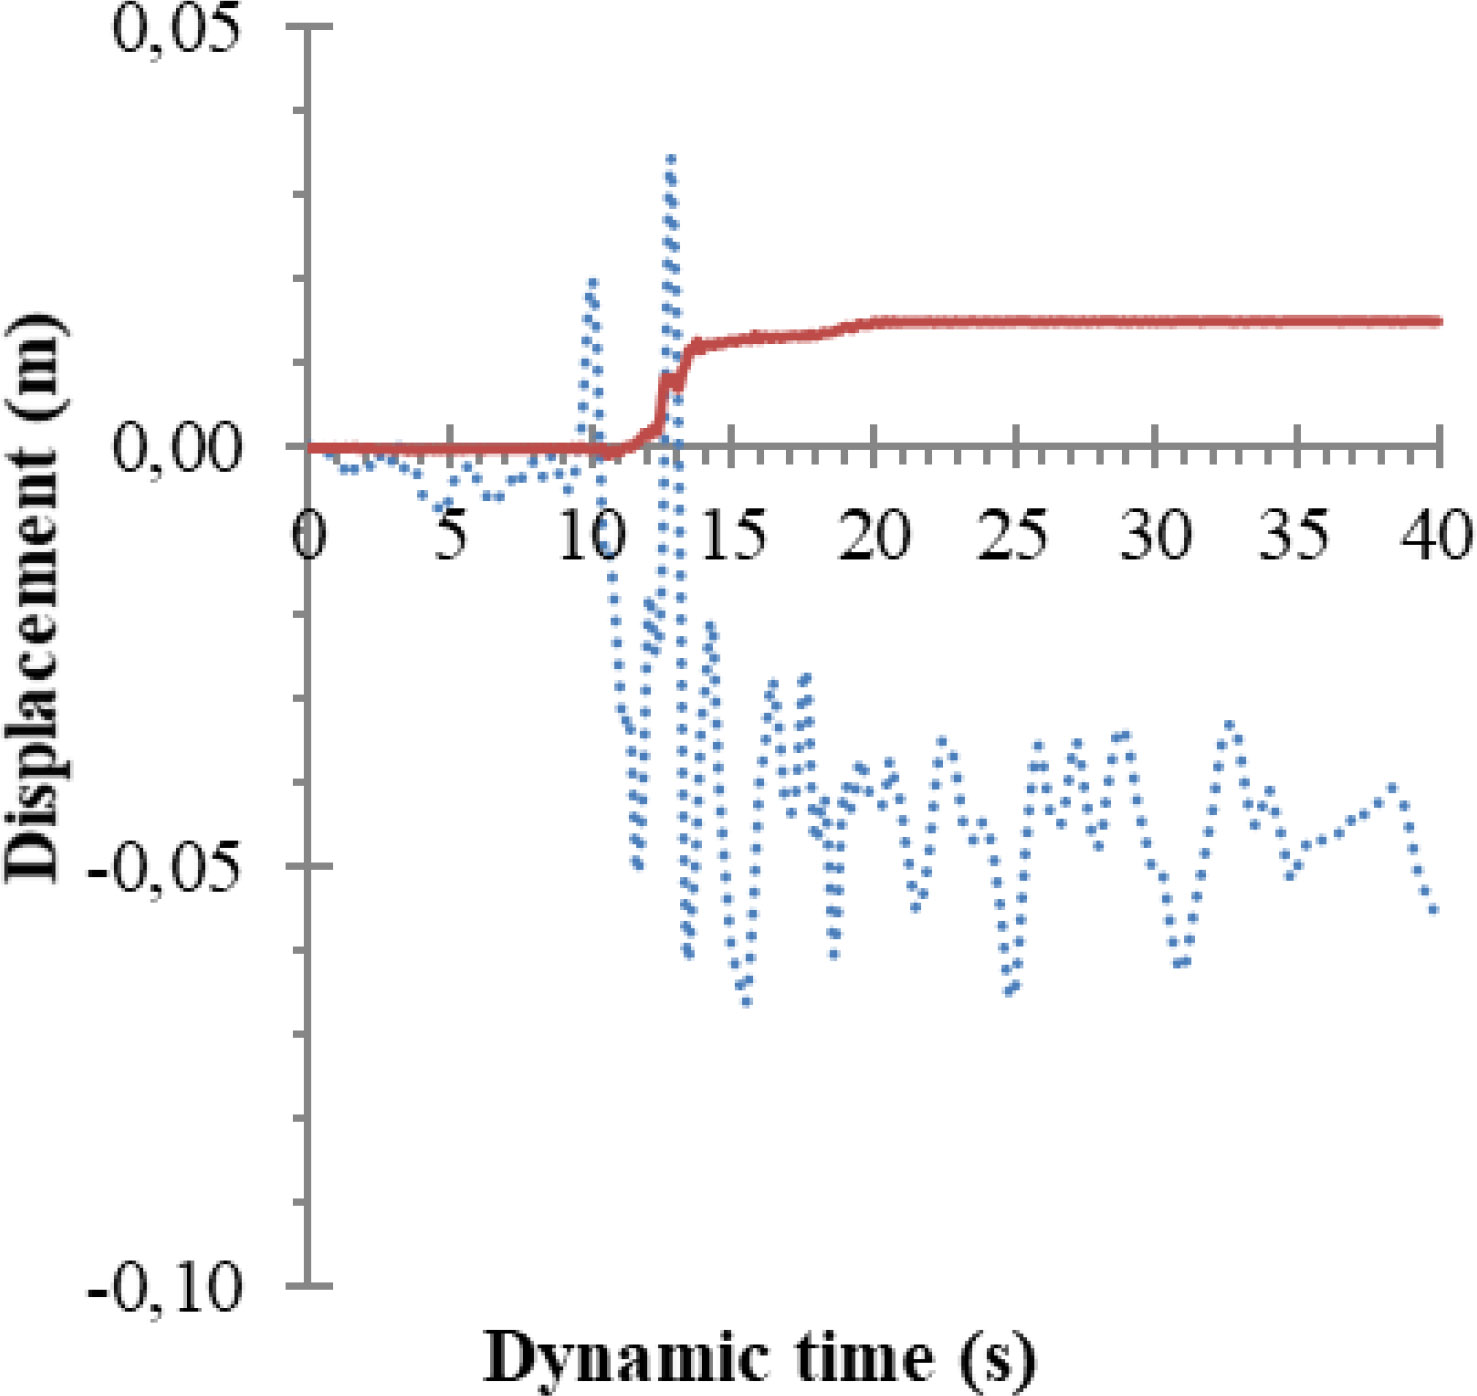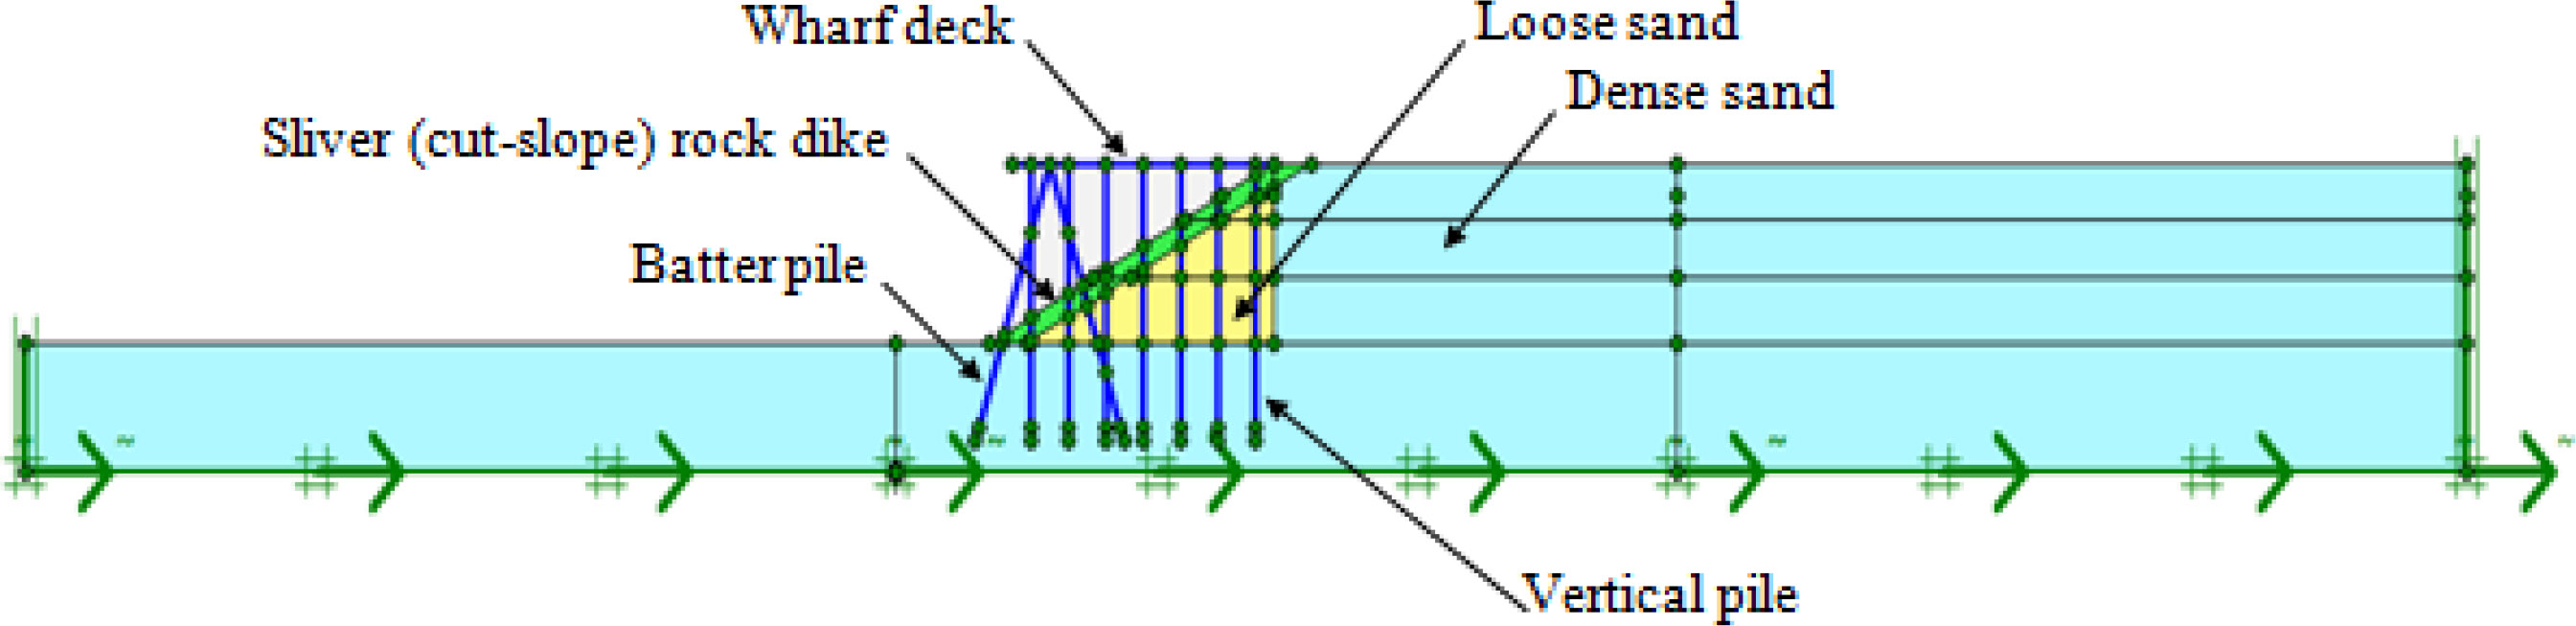
Figure 1
Finite element model of the wharf.
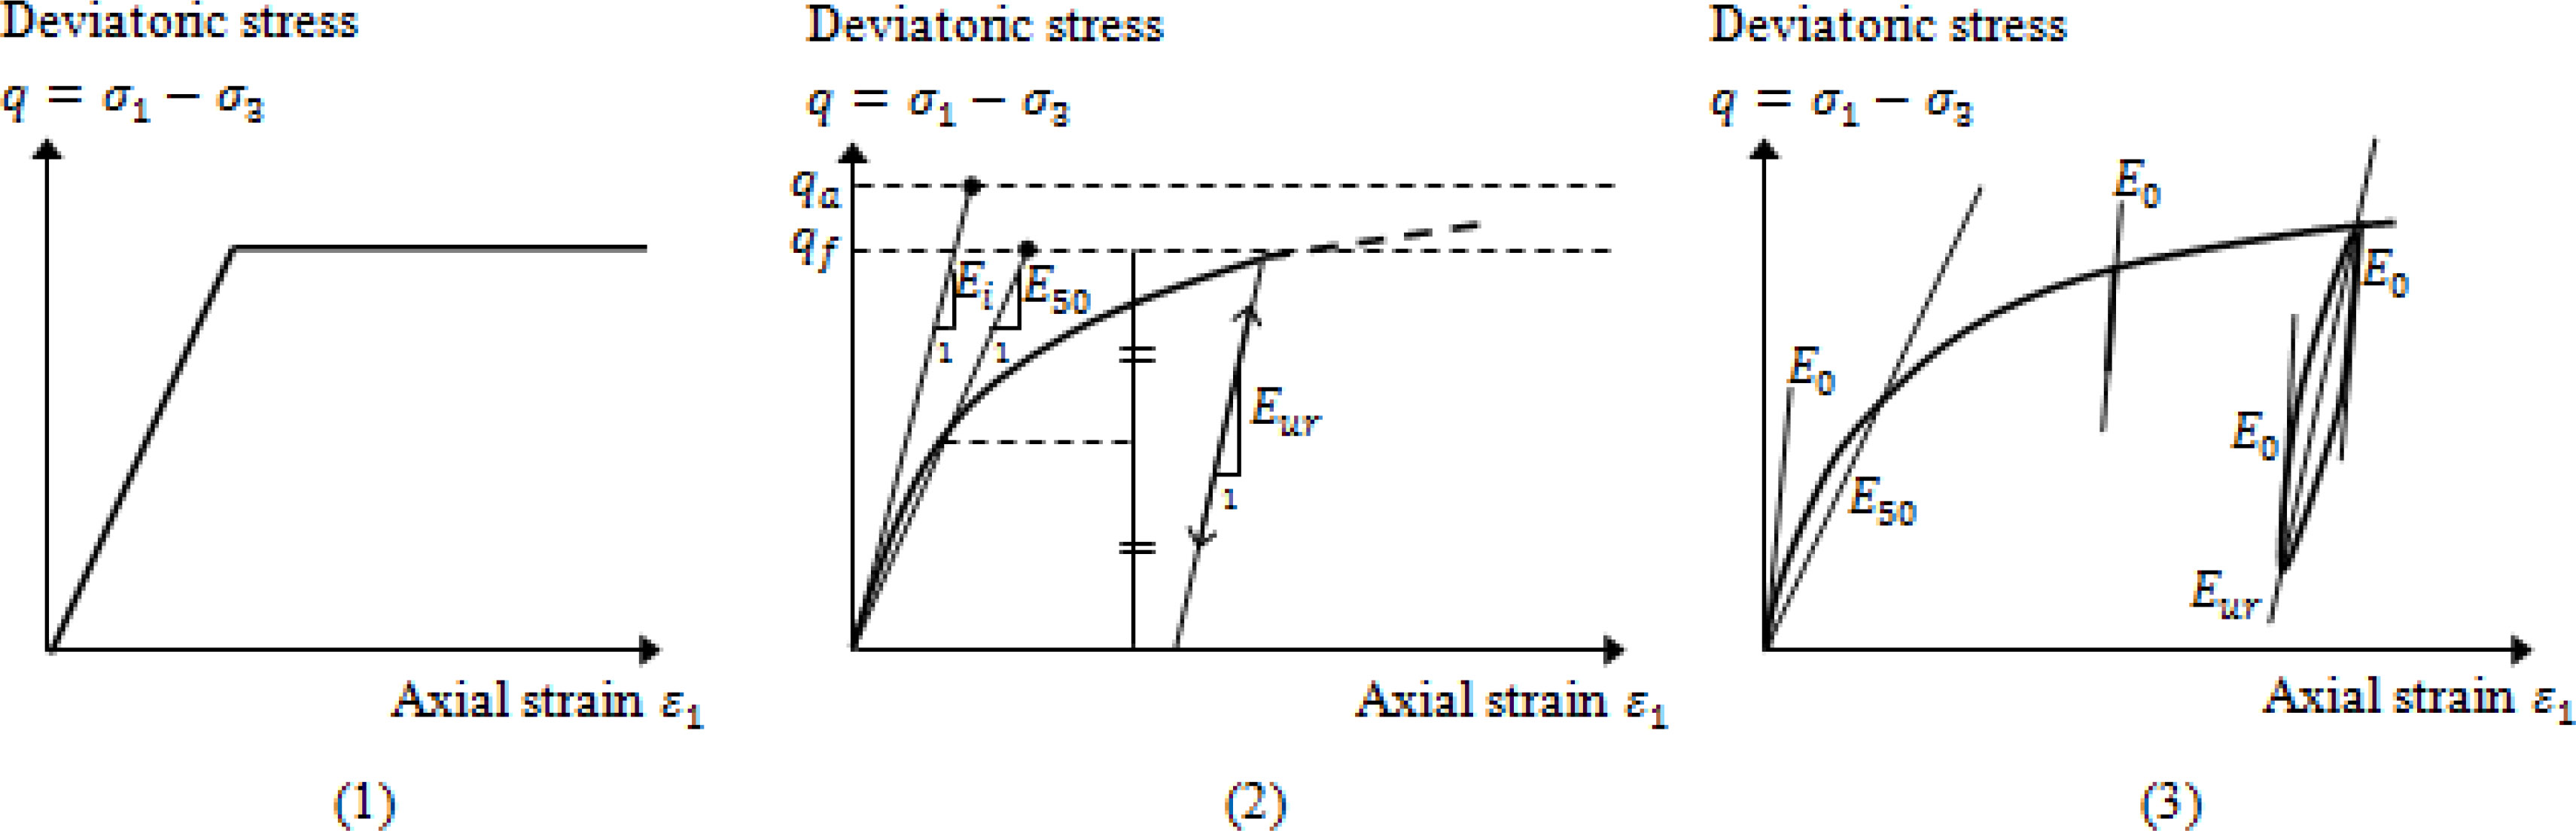
Figure 2
Stiffness parameters of standard drained triaxial test results: (1) for the MC model, (2) for the HS model, (3) for the HSS model [66]
Table 1
Soil parameters used for the MC model.
| Parameters | Unit | Dense sand | Loose sand | Rockfill |
|---|---|---|---|---|
| φ | ° | 37 | 33.2 | 45 |
| ψ | ° | 21 | 7 | 0 |
| C | kN/m2 | 0.5 | 0.5 | 15 |
| ν | - | 0.3 | 0.3 | 0.2 |
| E | kN/m2 | 6.032 × 10⁴ | 1.638 × 10⁴ | 2.232 × 10⁴ |
Table 2
Soil parameters used for HS model
| Parameters | Unit | Dense sand | Loose sand | Rockfill |
|---|---|---|---|---|
| kN/m2 | 6.032 × 10⁴ | 1.638 × 10⁴ | 2.232 × 10⁴ | |
| kN/m2 | 4.826 × 10⁴ | 1.310 × 10⁴ | 1.786 × 10⁴ | |
| kN/m2 | 1.810 × 10⁴ | 4.914 × 10⁴ | 6.696 × 10⁴ | |
| Pref | kN/m2 | 100 | 100 | 100 |
| M | - | 0.5 | 0.5 | 0.5 |
| - | 0.3982 | 0.4524 | 0.2929 | |
| Rf | - | 0.9 | 0.9 | 0.9 |
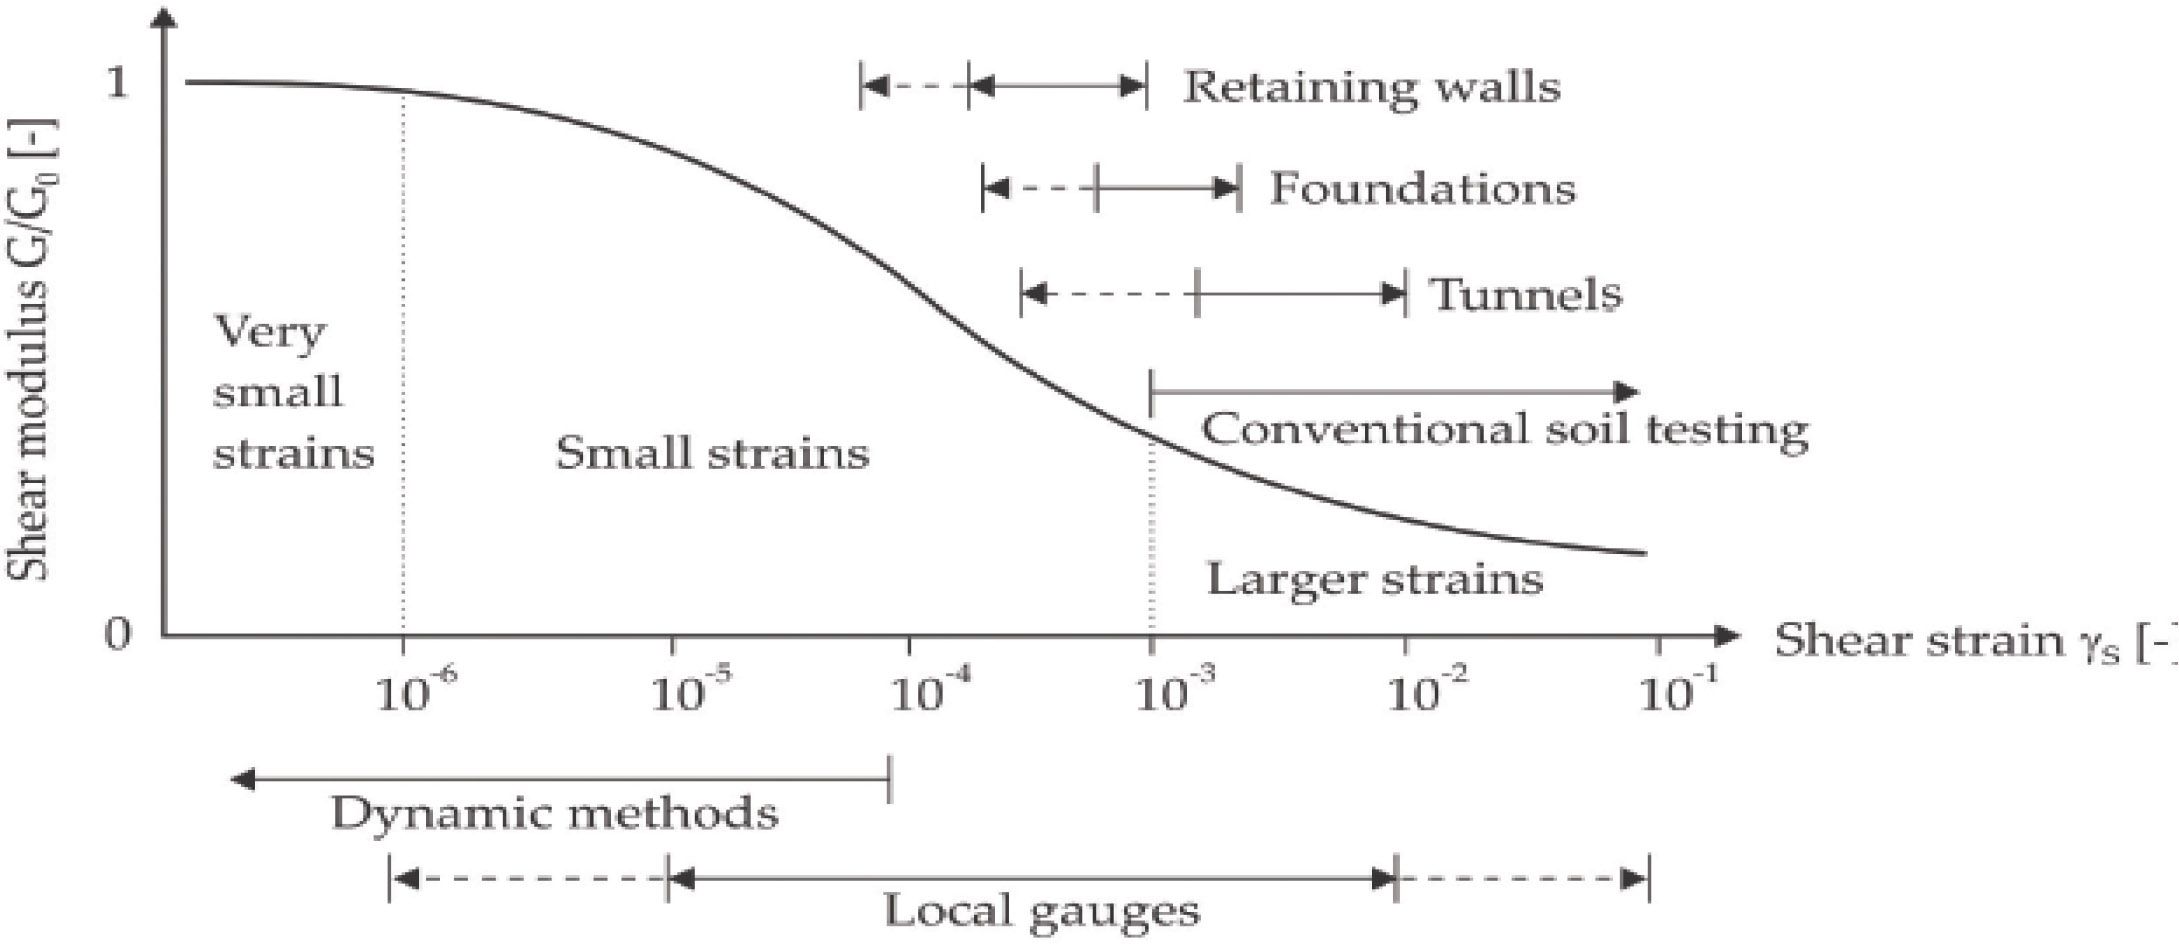
Figure 3
Characteristic stiffness-strain behavior in logarithmic scale (after Atkinson and Sallfors [36] and Mair[76]) (Atkinson, 2000)[77].
Table 3
Additional input parameters of HSS model.
| Parameters | Unit | Dense sand | Loose sand | Rockӿll |
|---|---|---|---|---|
| γ0.7 | - | 4.918 × 10⁻⁴ | 3.629 × 10⁻⁴ | 4.246 × 10⁻⁴ |
| kN/m2 | 1.051 × 10⁵ | 9.108 × 10⁴ | 1.038 × 10⁵ |
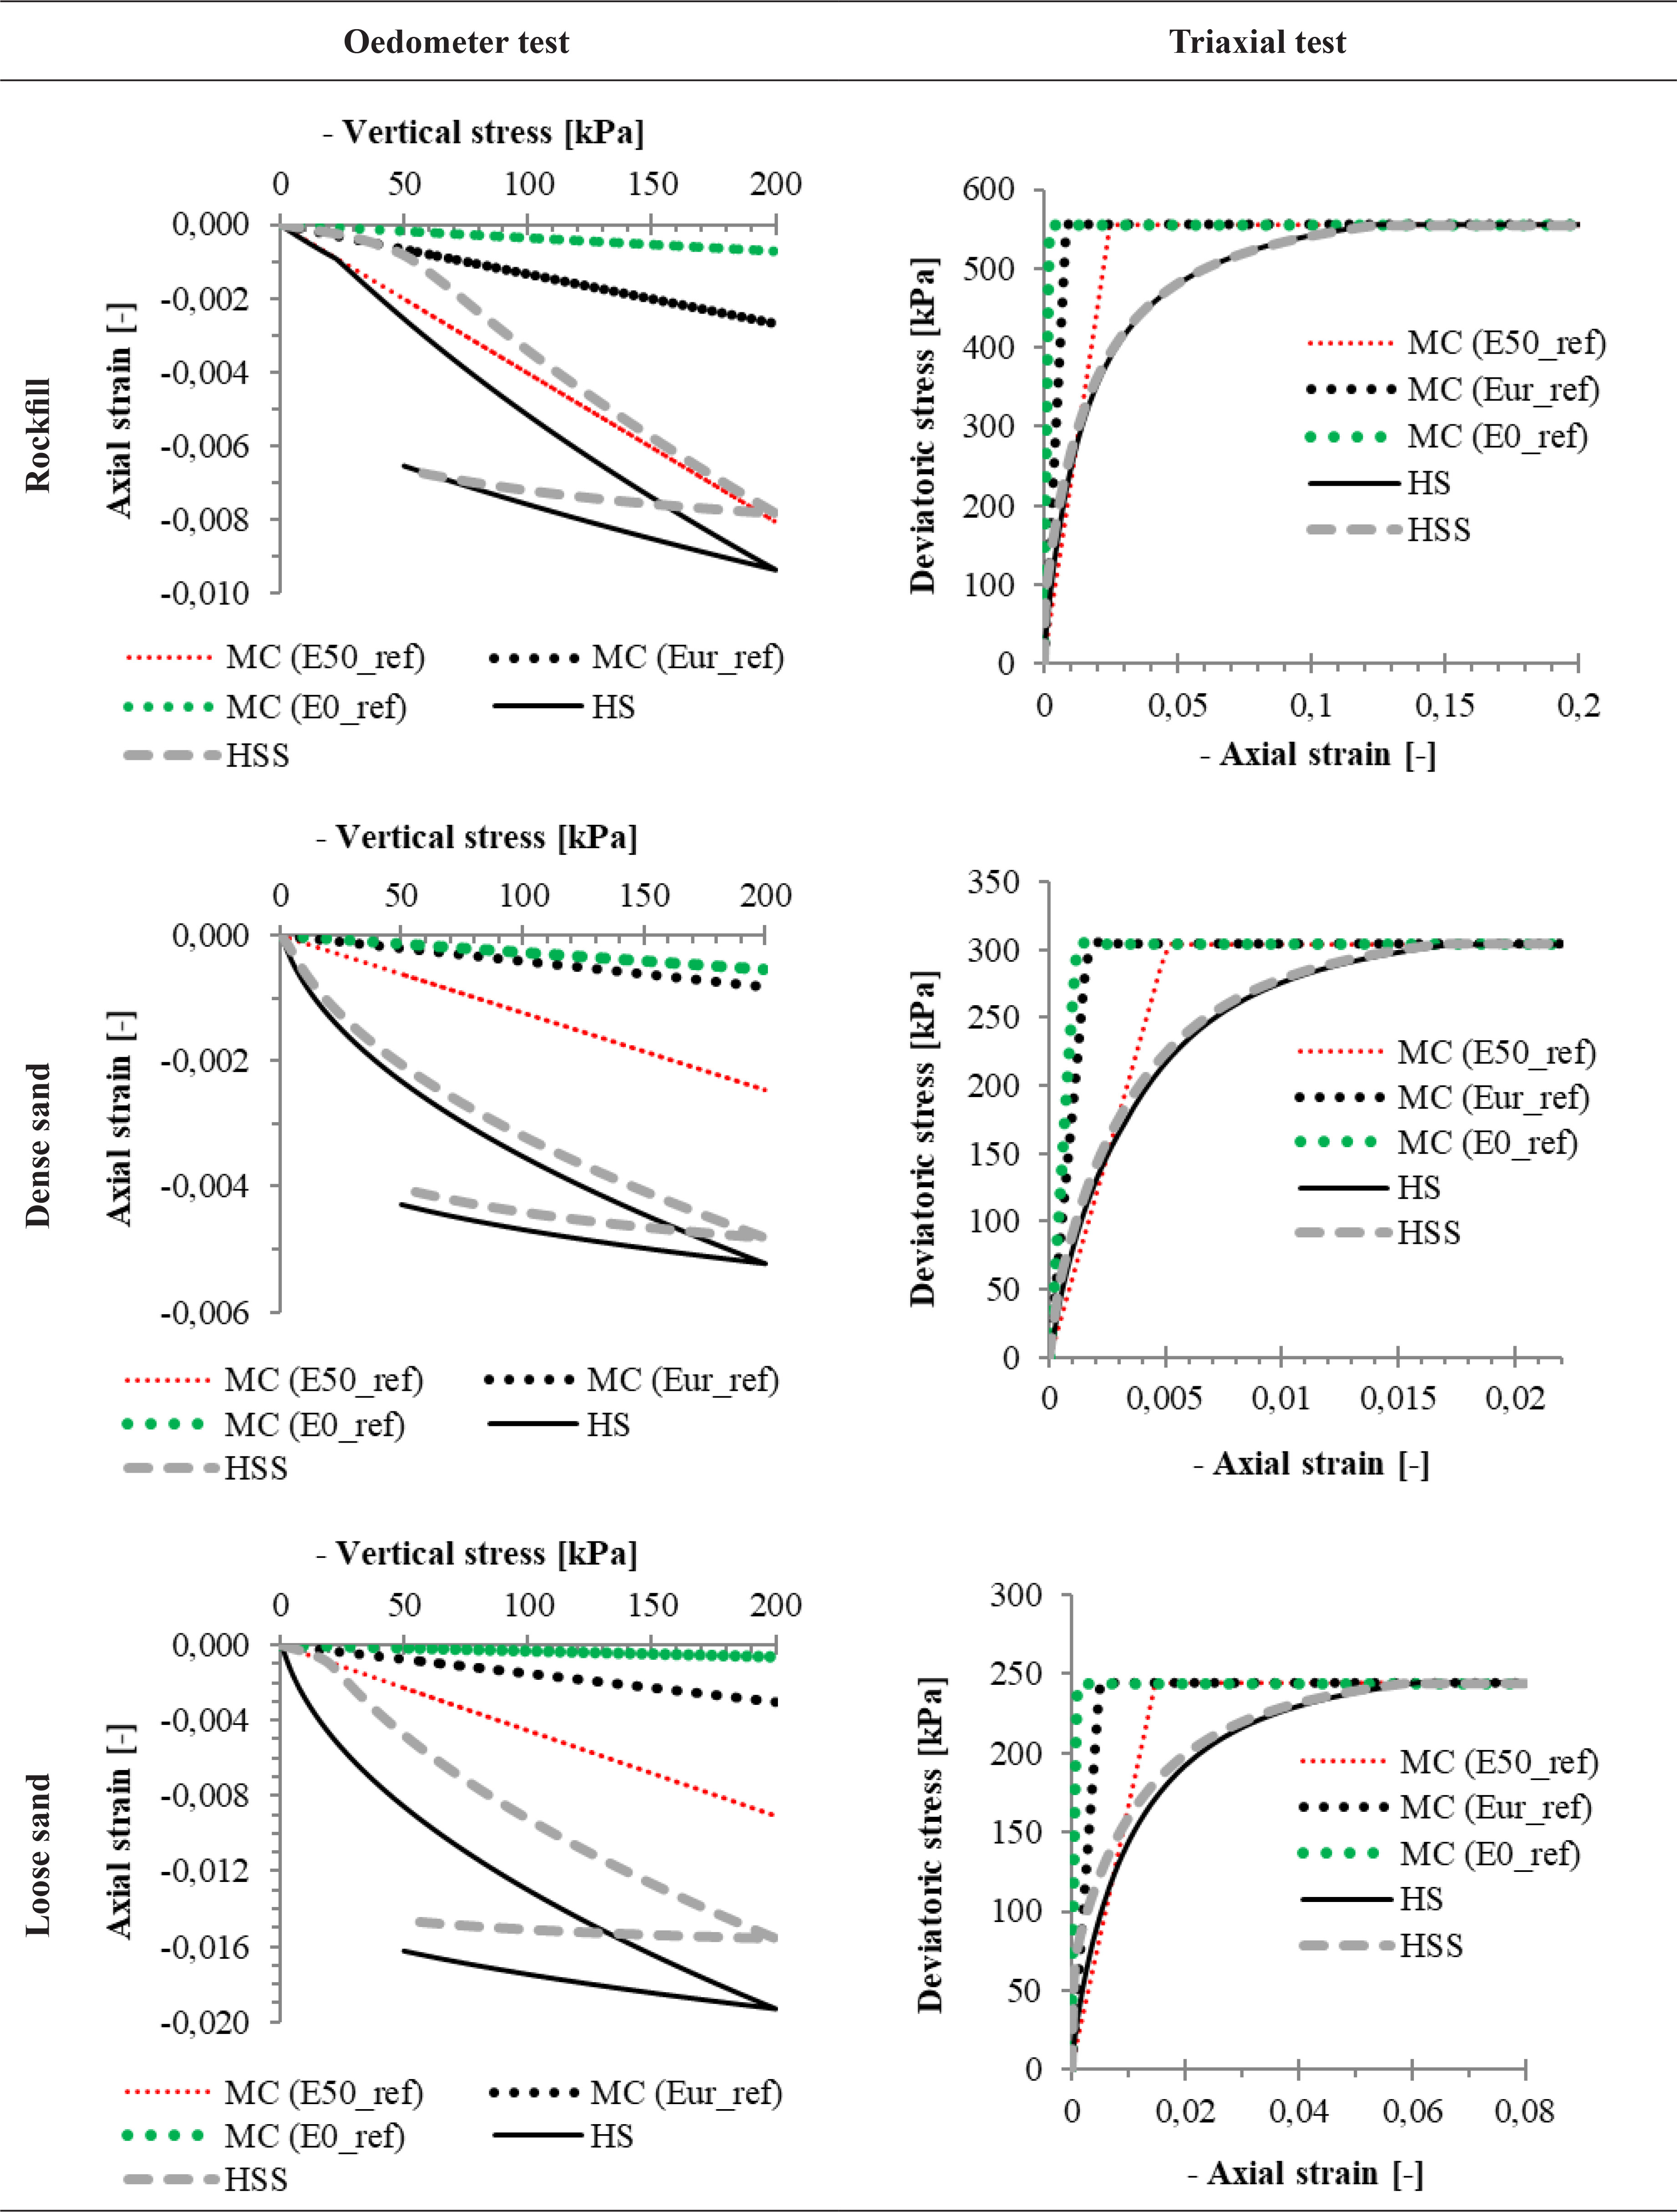
Figure 4
Calibration of soil parameters of MC model in numerical soil element tests for rockfill, dense sand and loose sand.
Table 4
Pile and deck properties.
| Parameters | Unit | Pile | Deck |
|---|---|---|---|
| EA | kN/m | 162.75 × 10⁴ | 17.85 × 10⁶ |
| EI | kN.m2/m | 70.49 × 10³ | 96.724 × 10³ |
| w | kN/m/m | 0.633 | 6.9436 |
| ν | - | 0.2 | 0.2 |
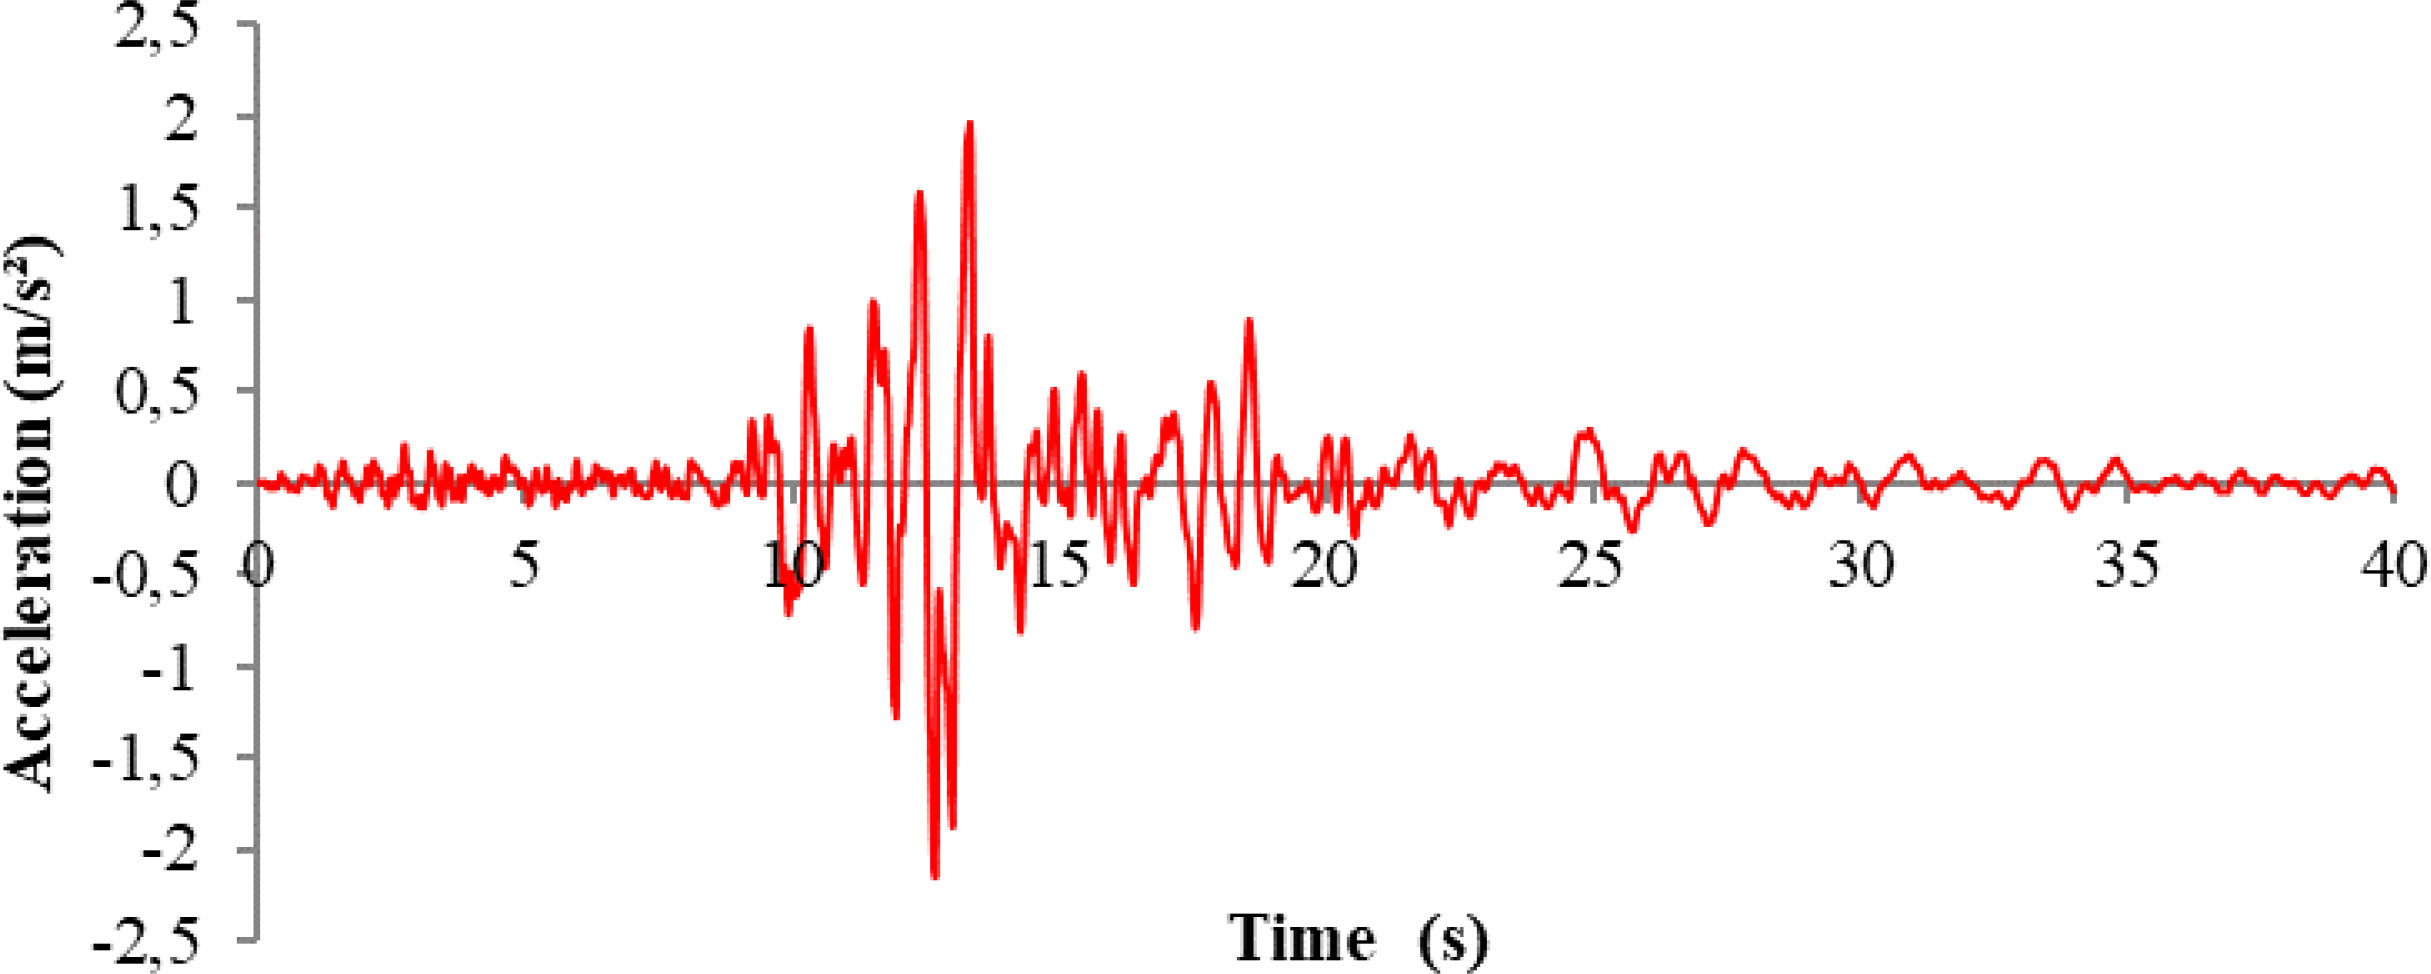
Figure 5
Unscaled input accelerogram from 1989 Loma Prieta earthquake.
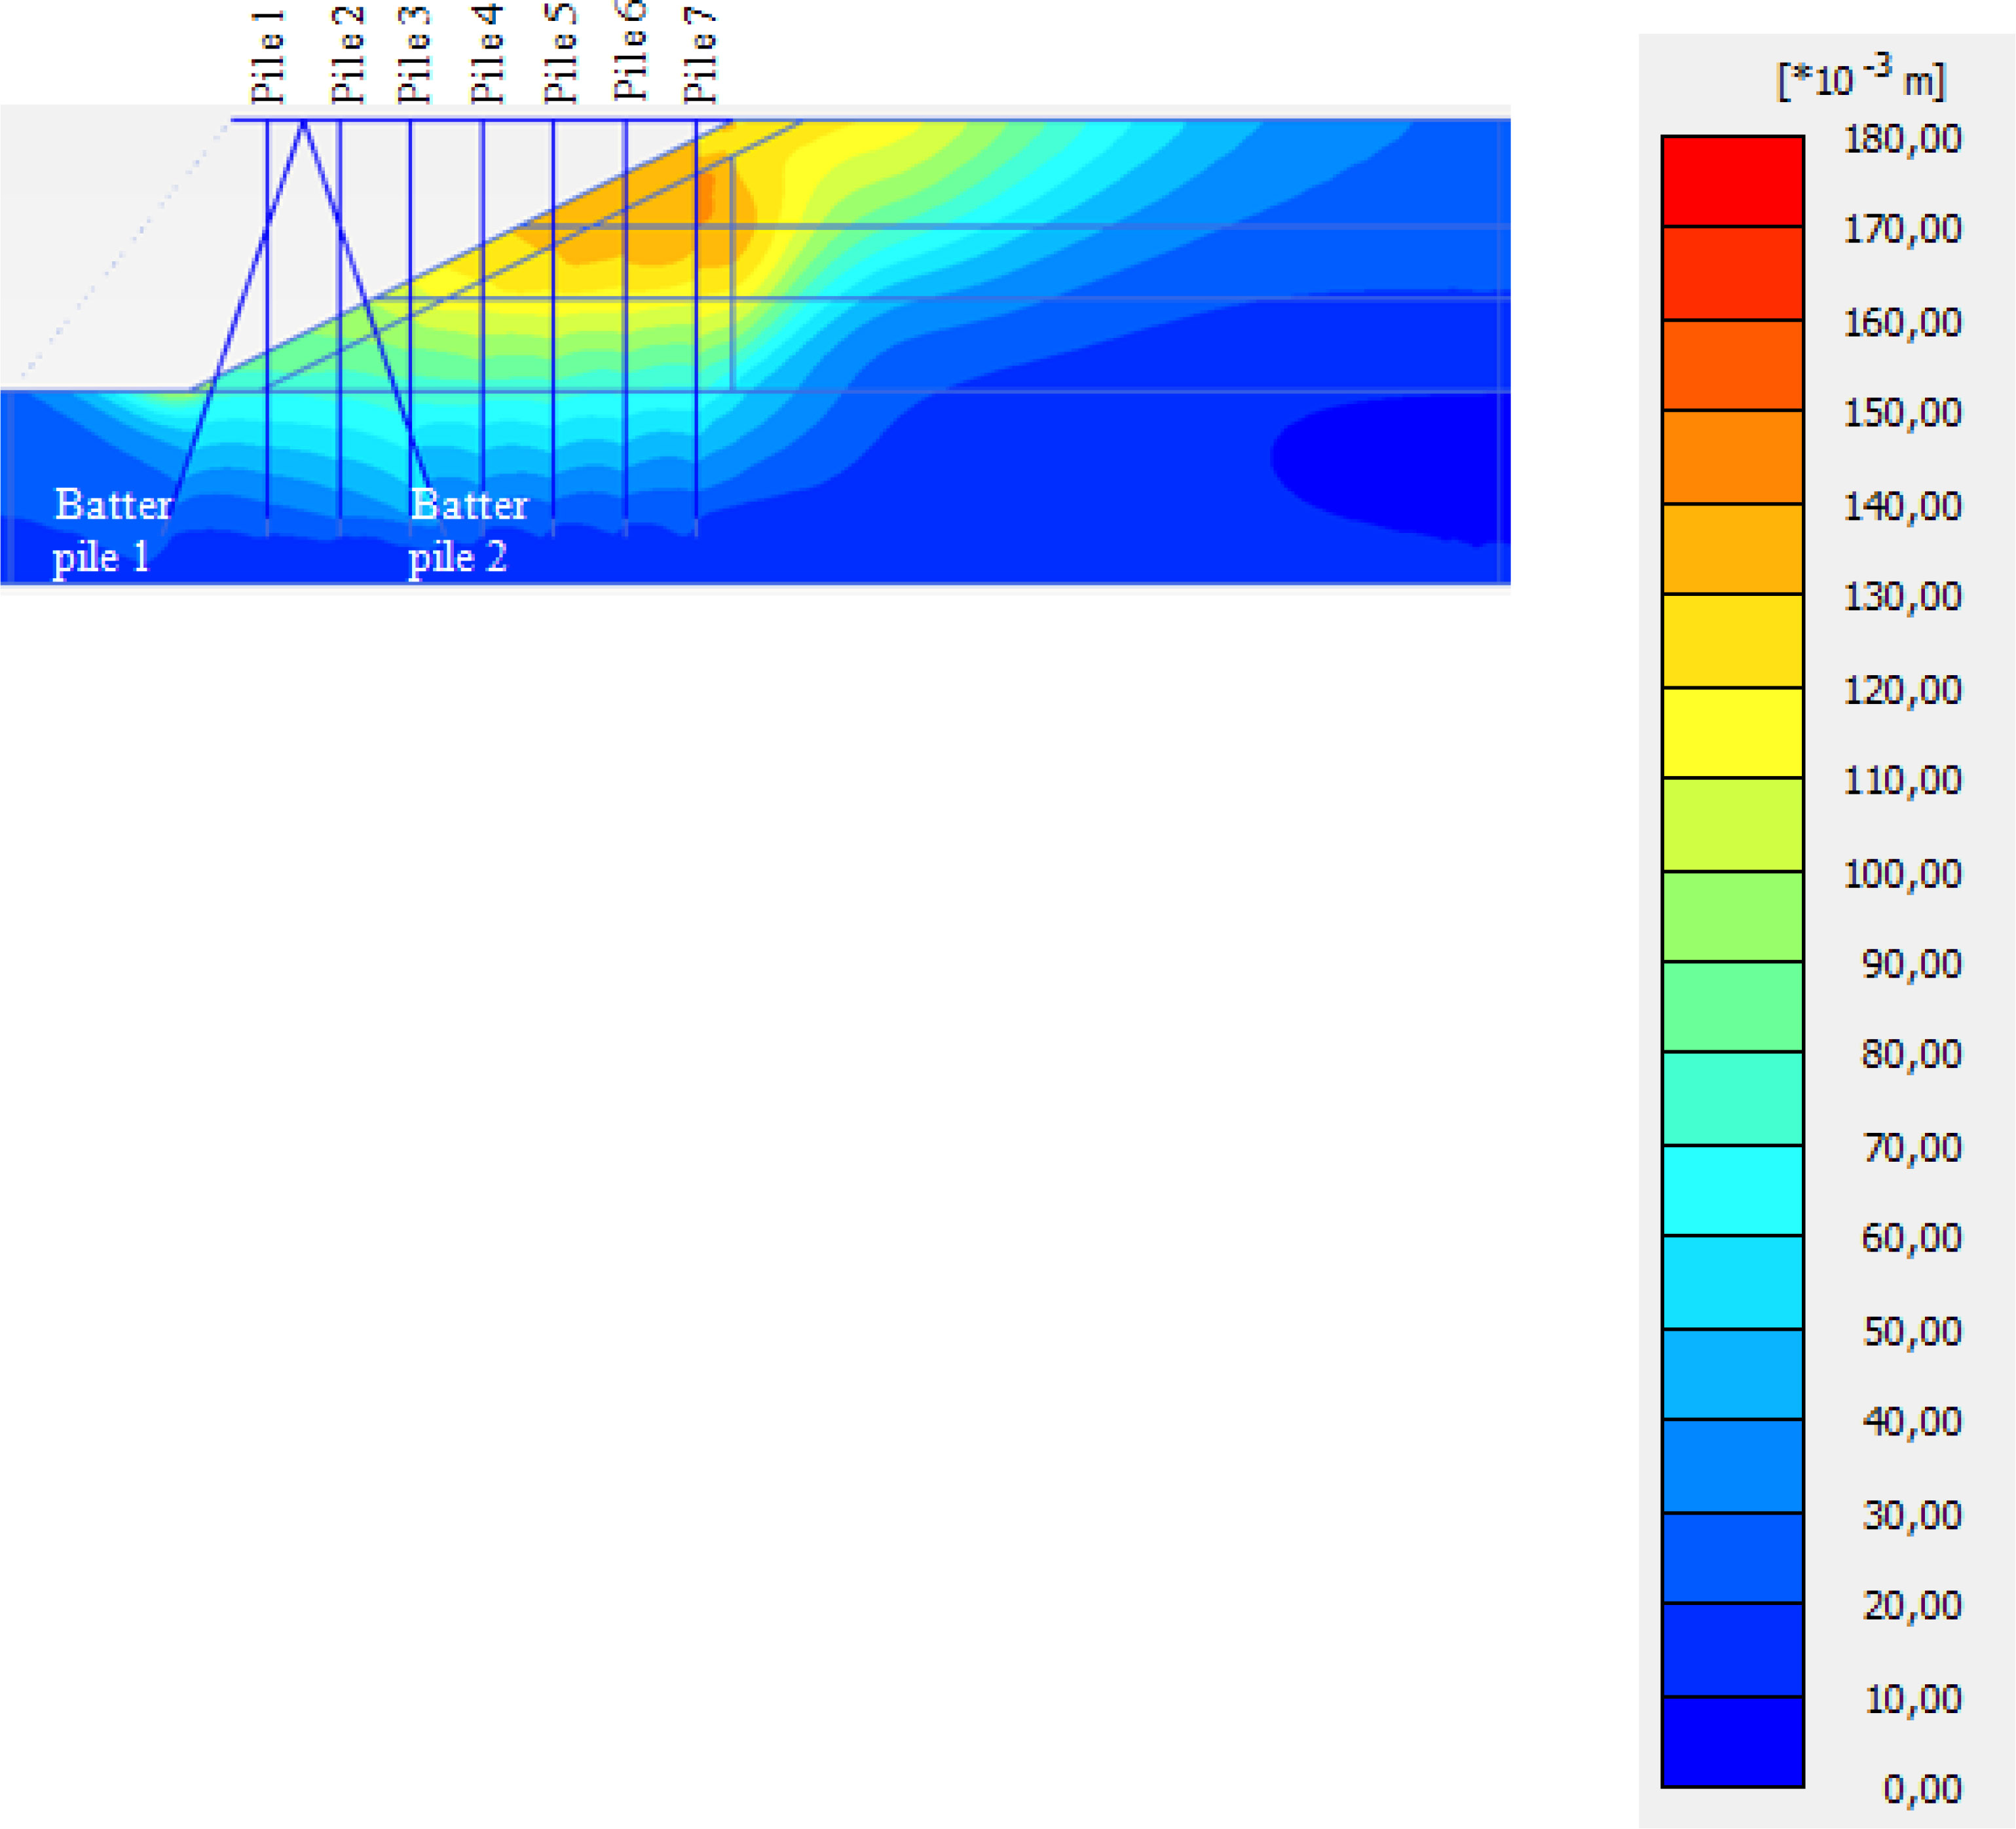
Figure 6
Total displacements with MC model.
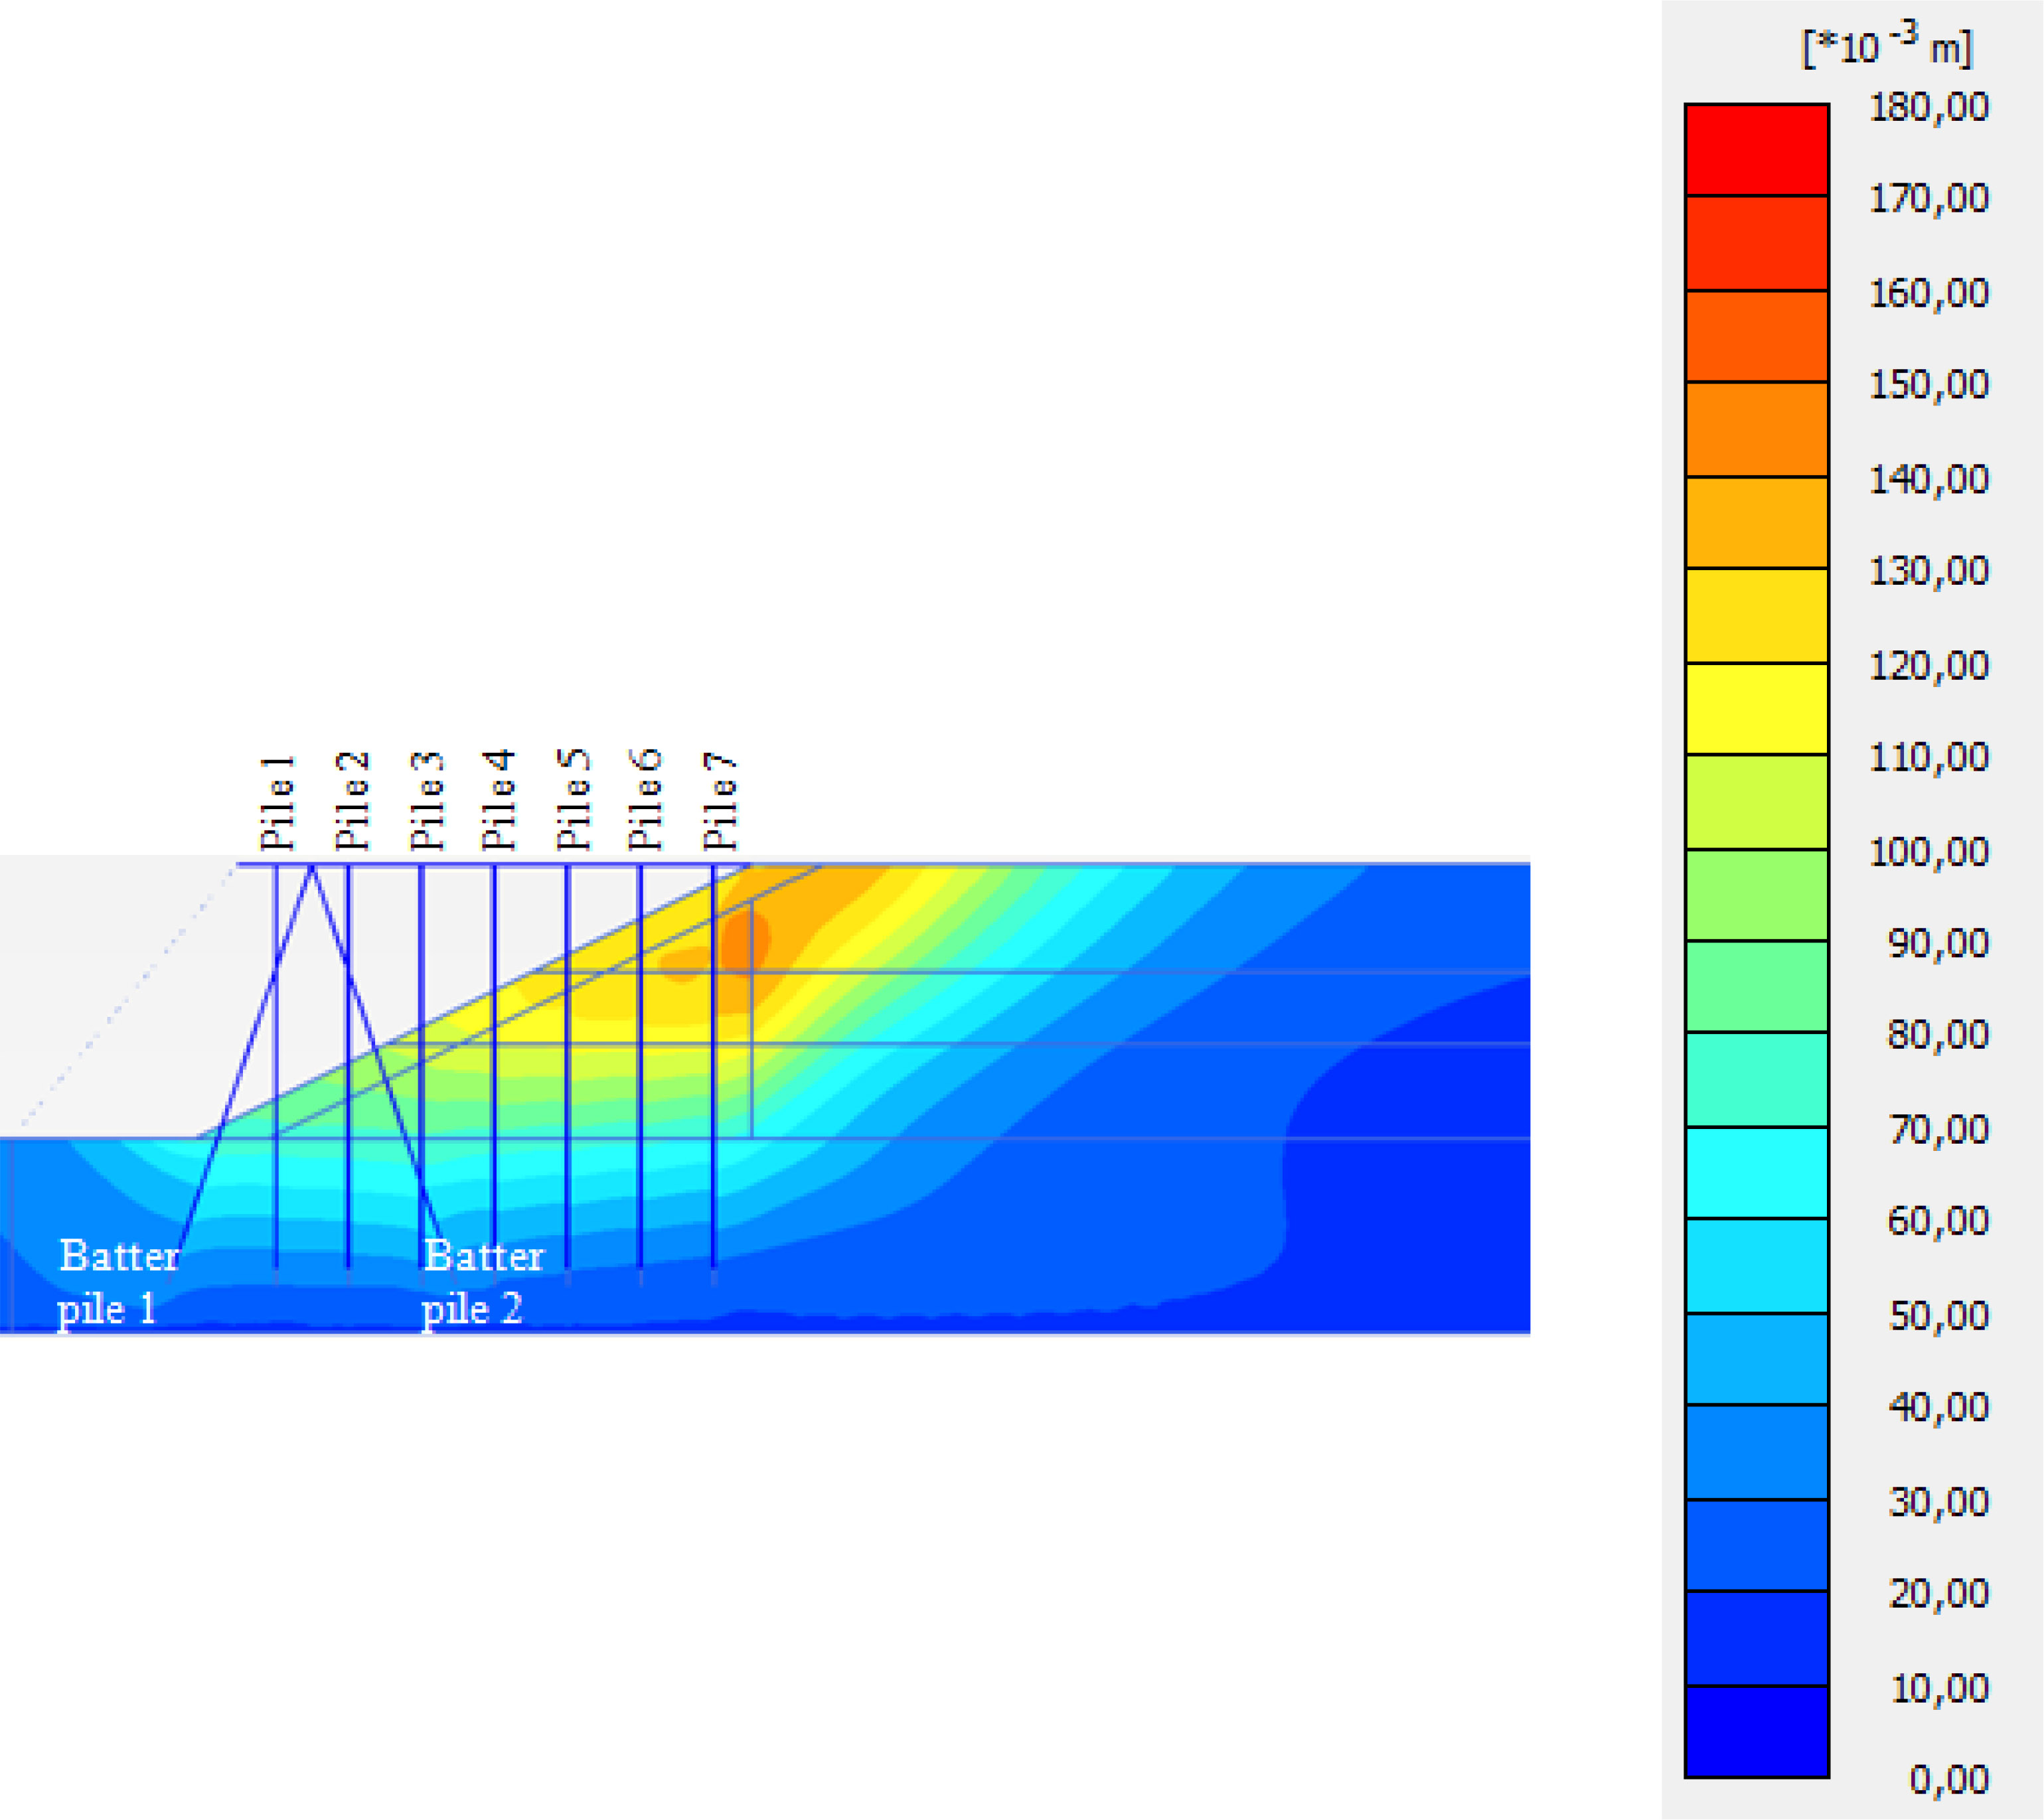
Figure 7
Total displacements with HS model.
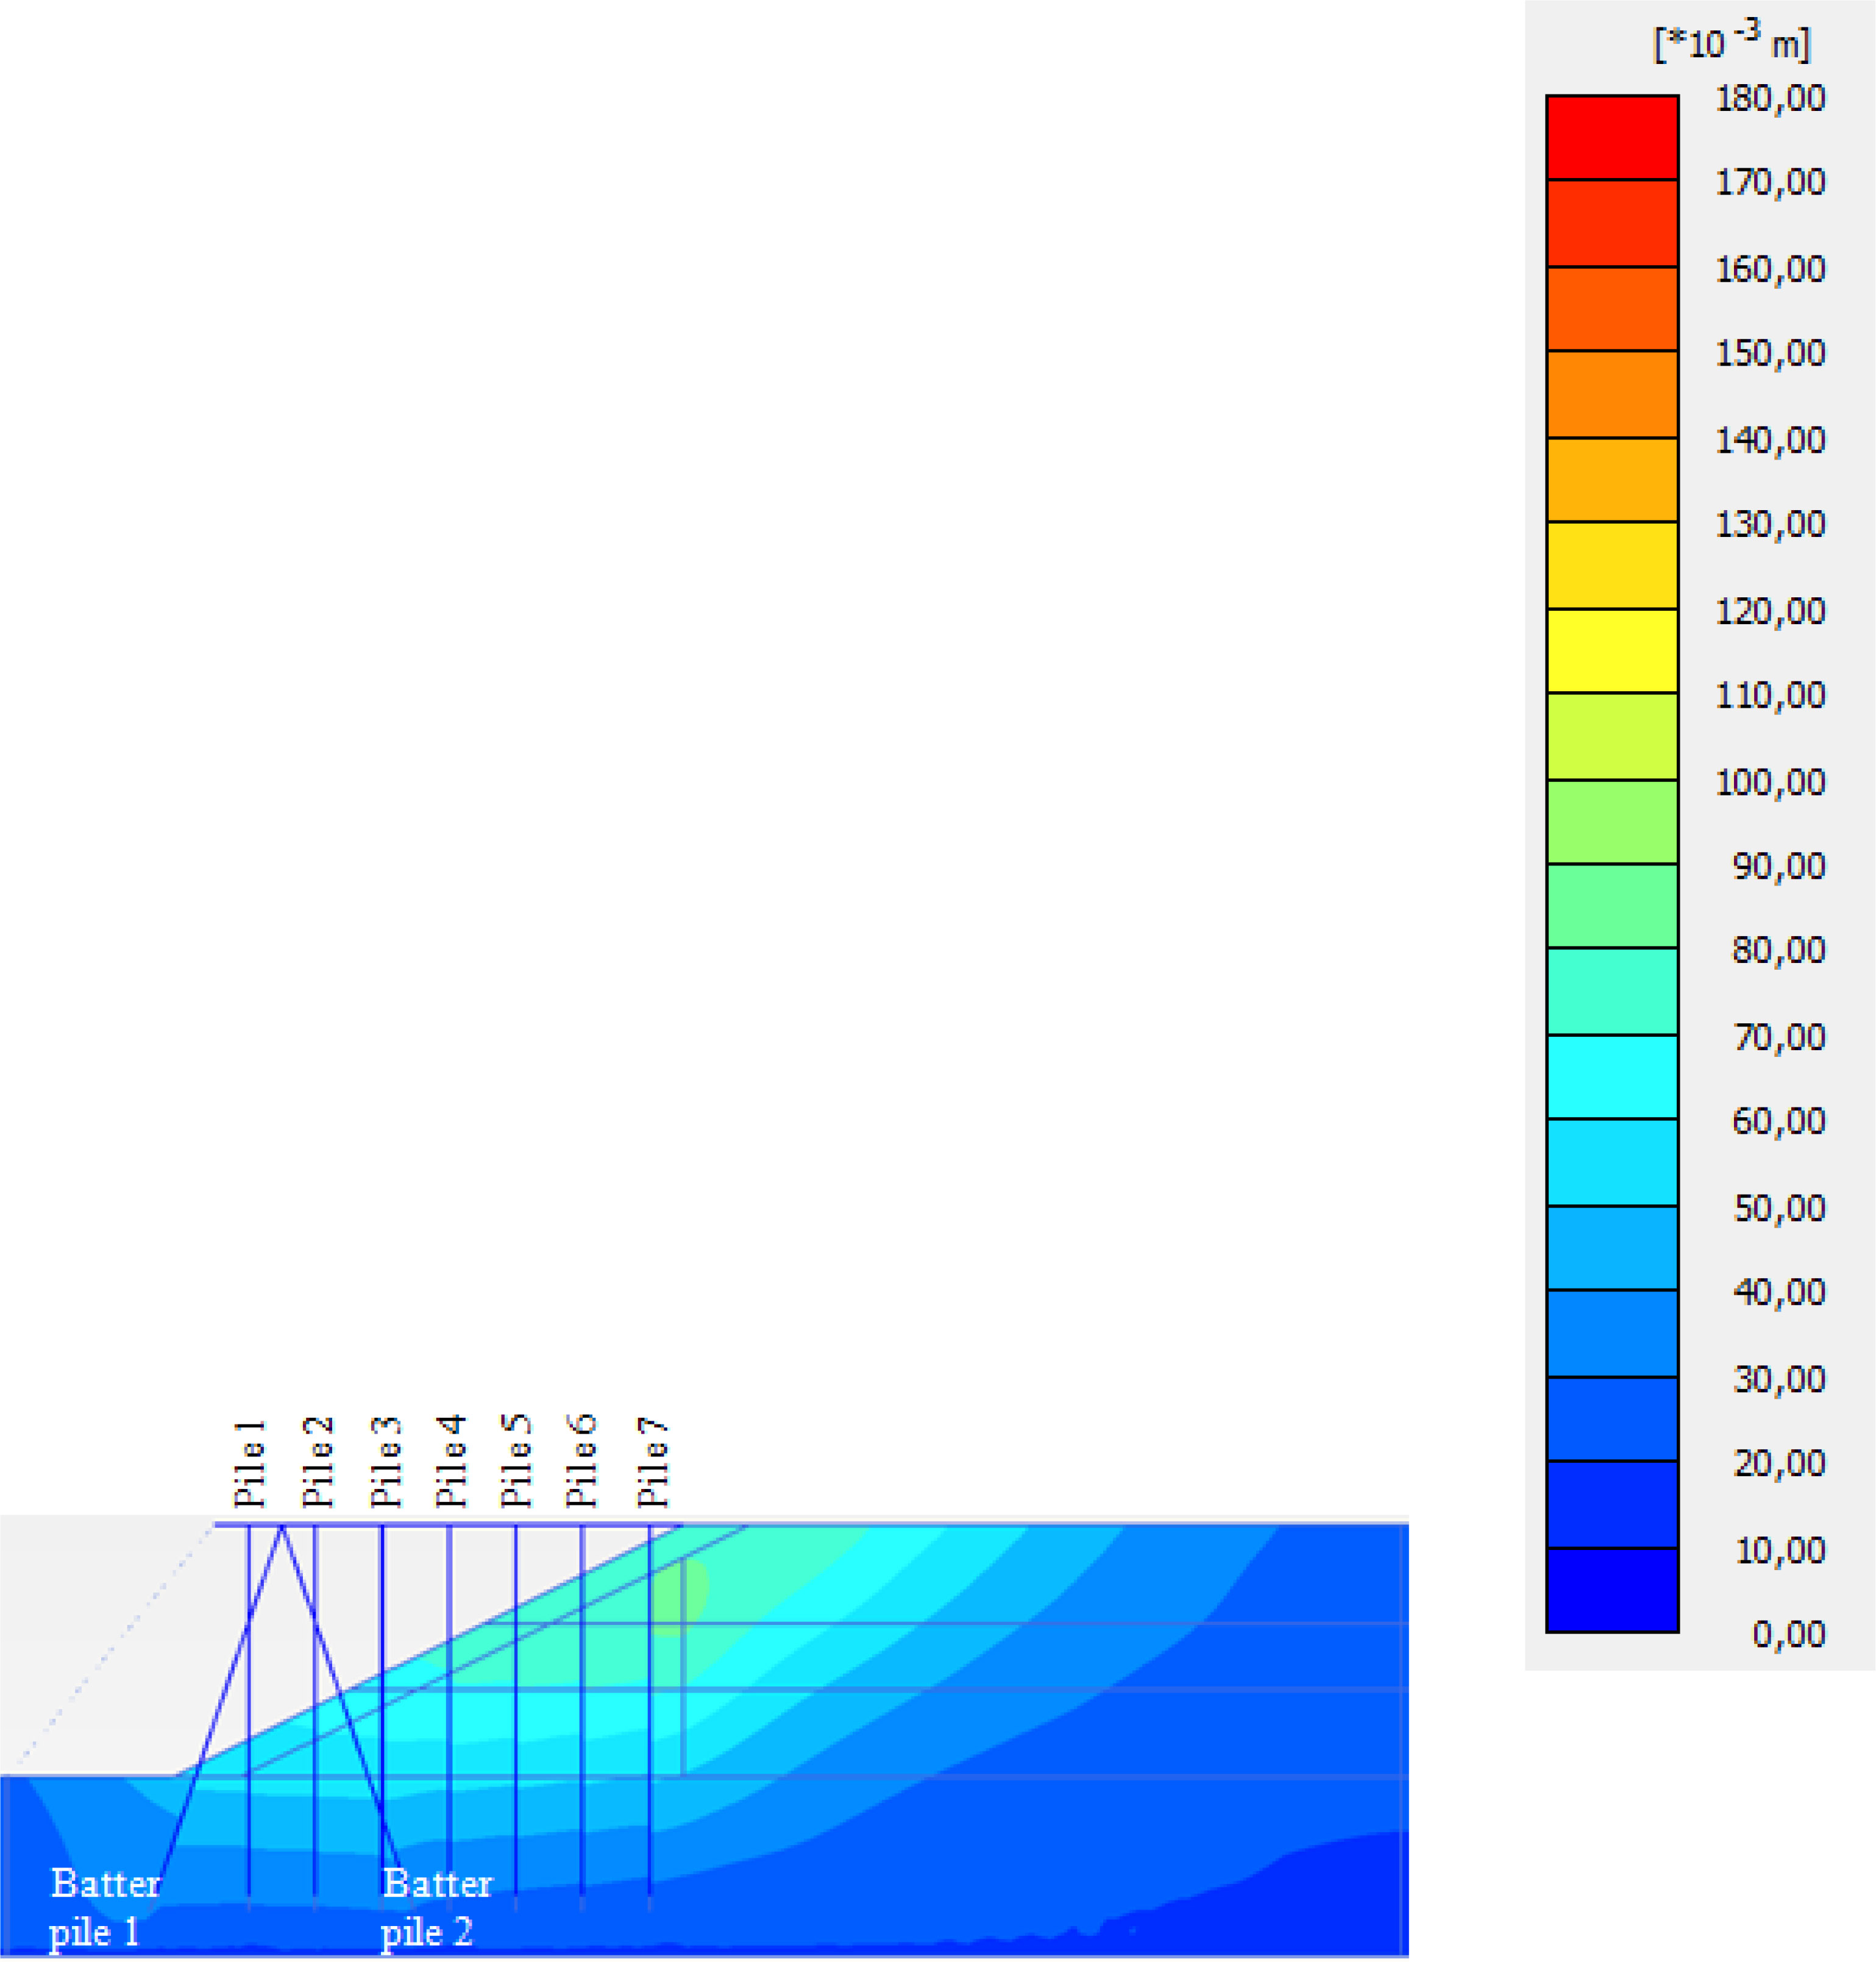
Figure 8
Total displacements with HSS model.
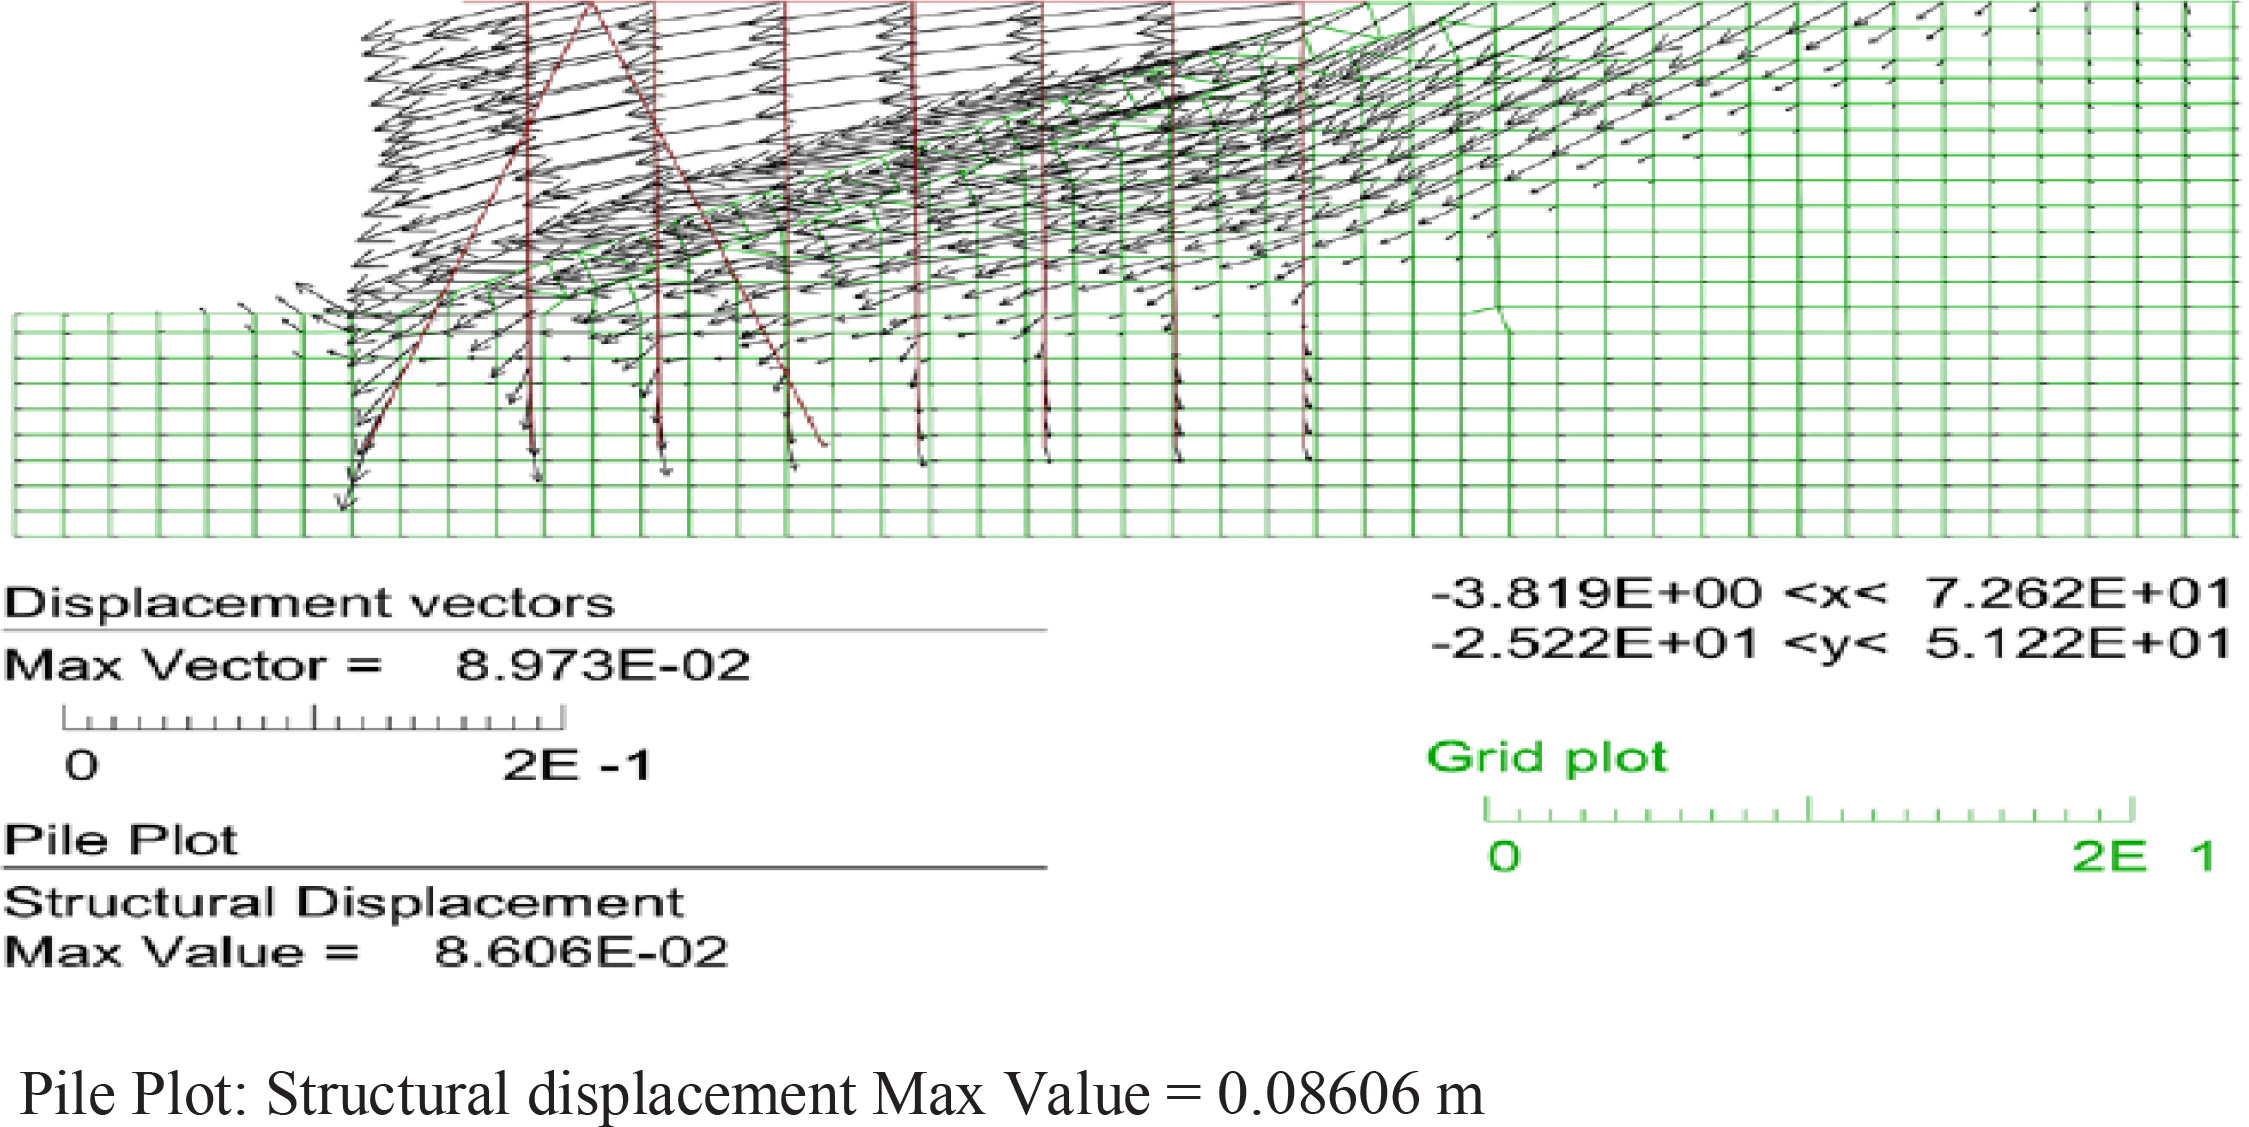
Figure 9
Nodal displacement vectors for the wharf supported piles (m)[28].
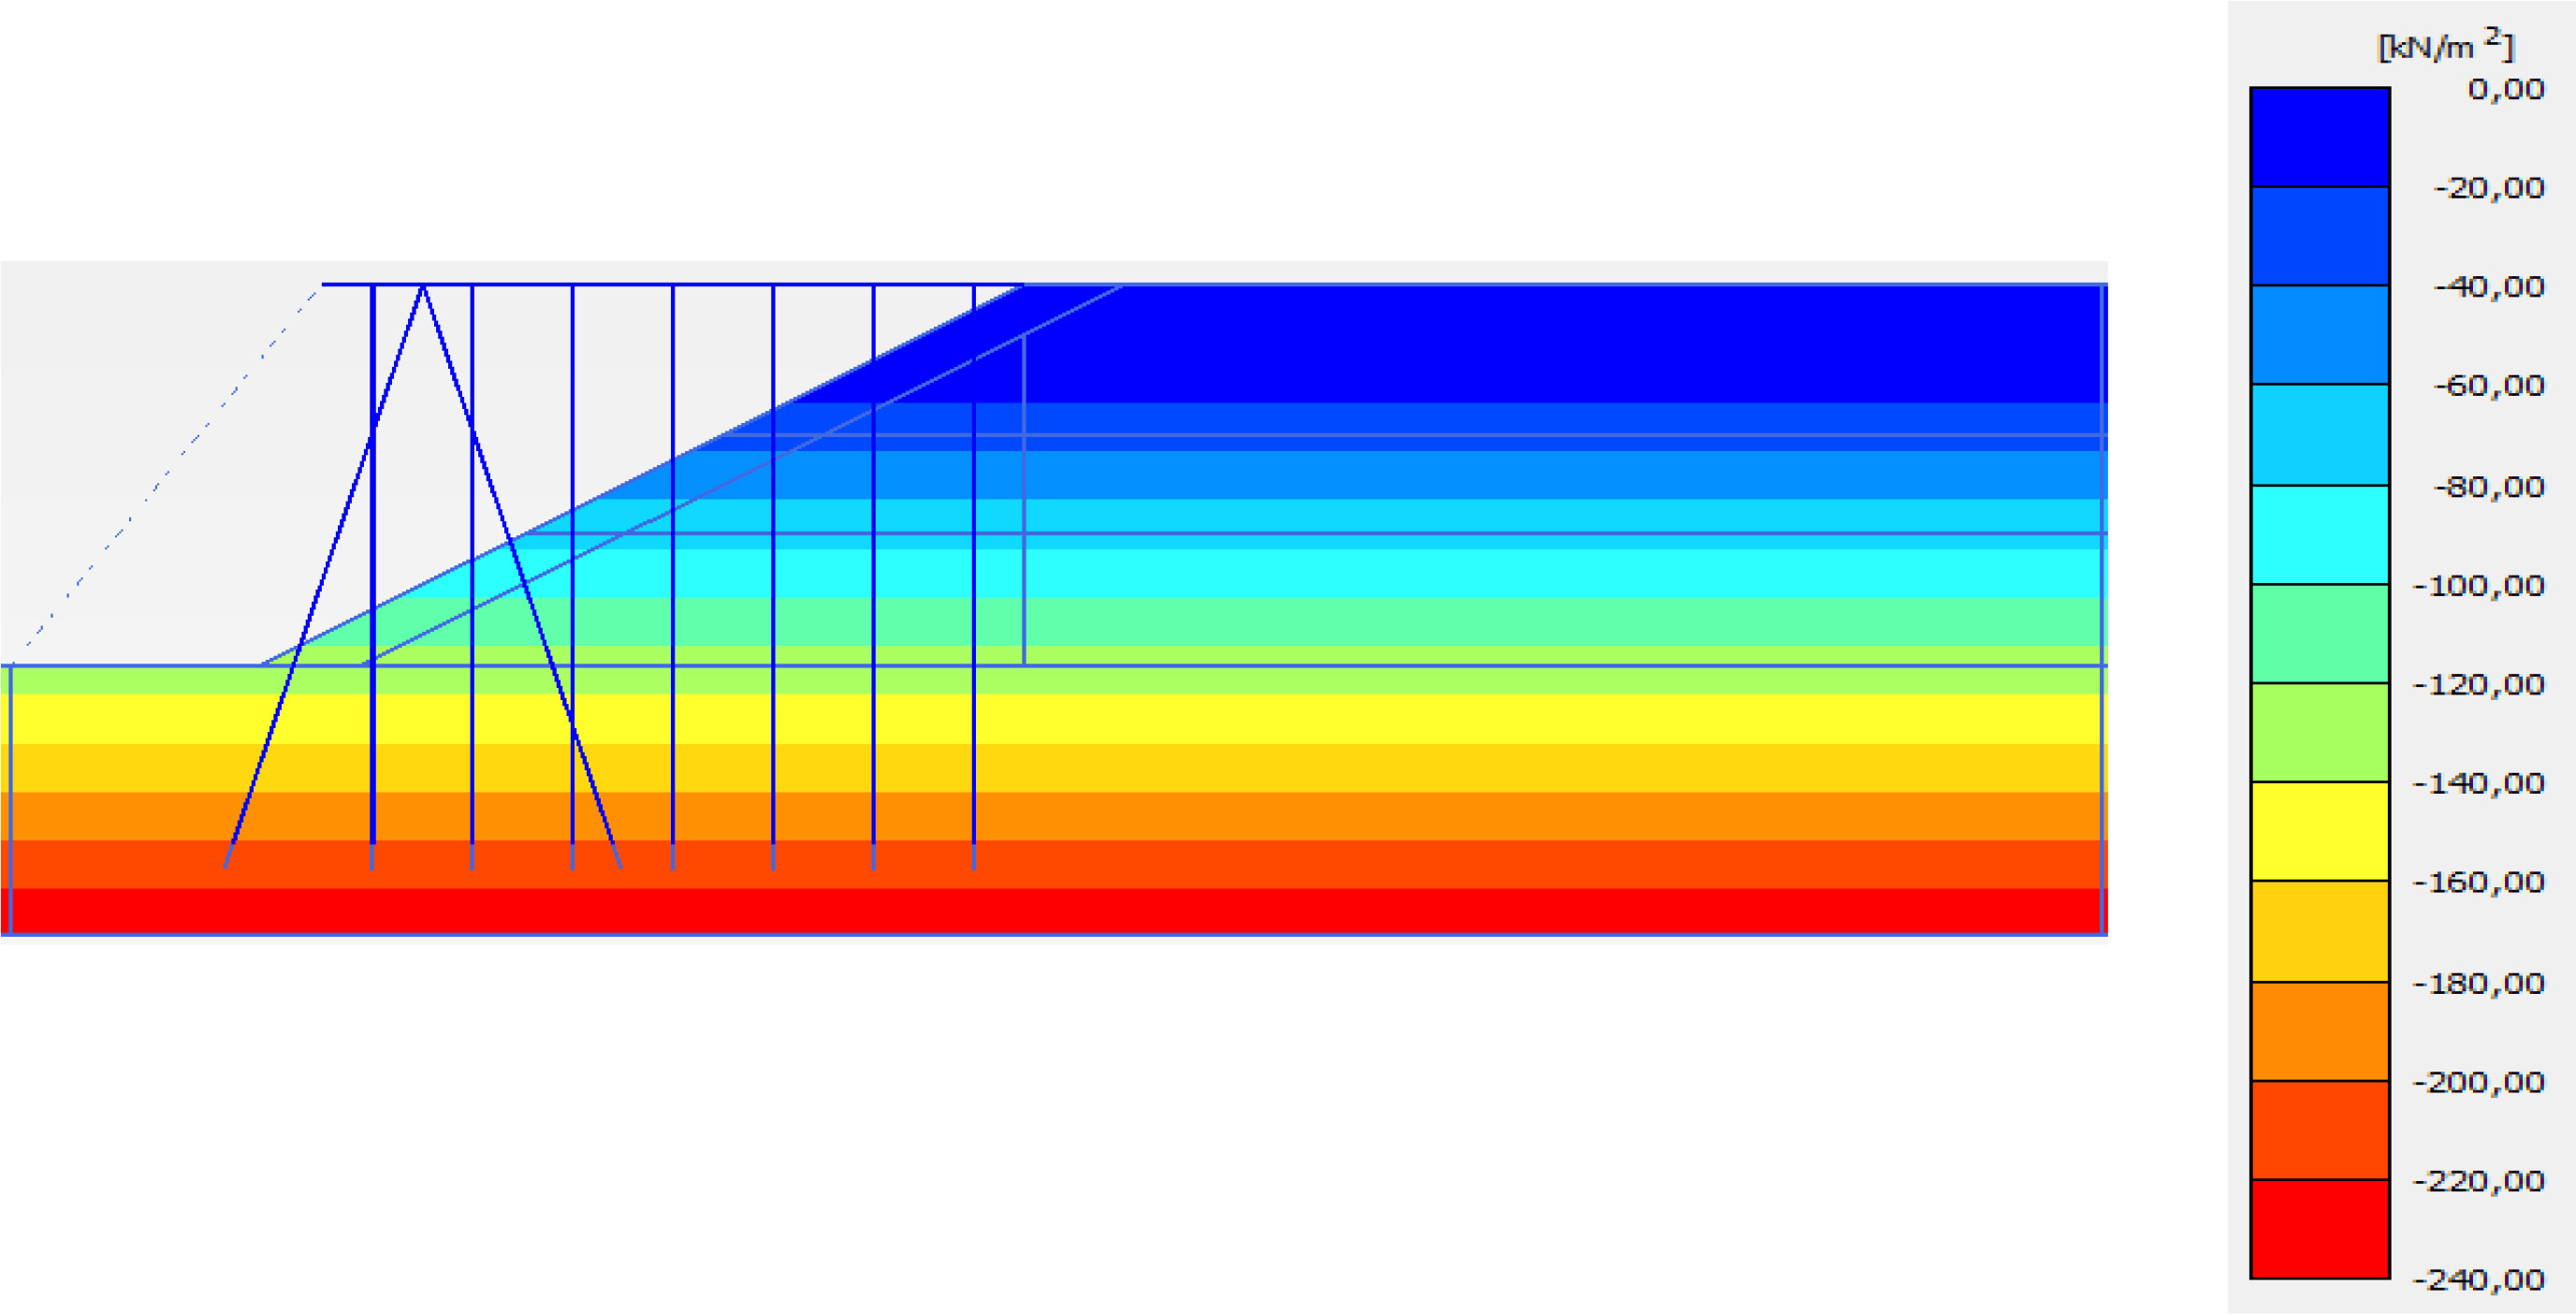
Figure 10
Pore pressure of the numerical model
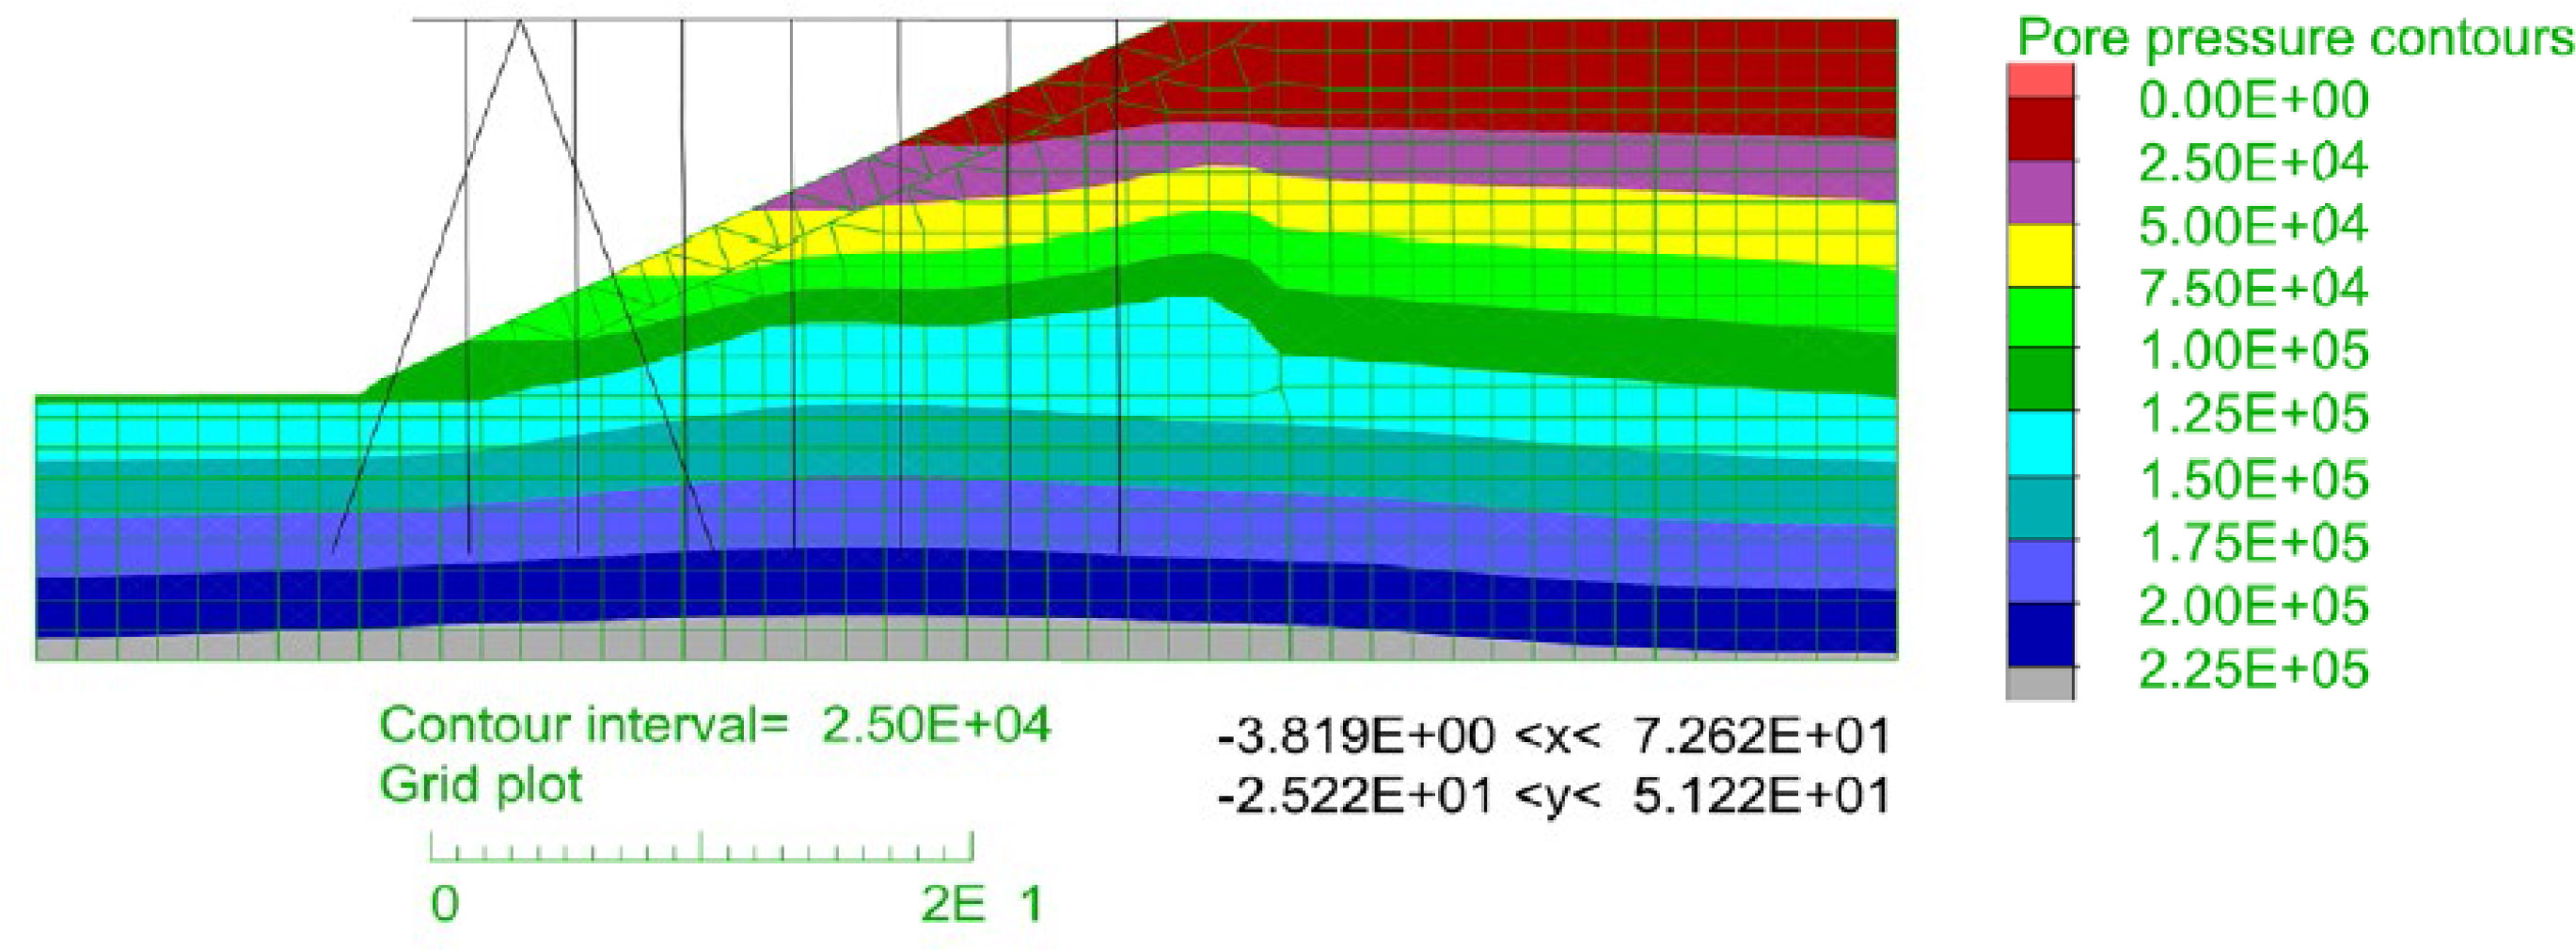
Figure 11
Total pore pressure contours (Pa)[28].
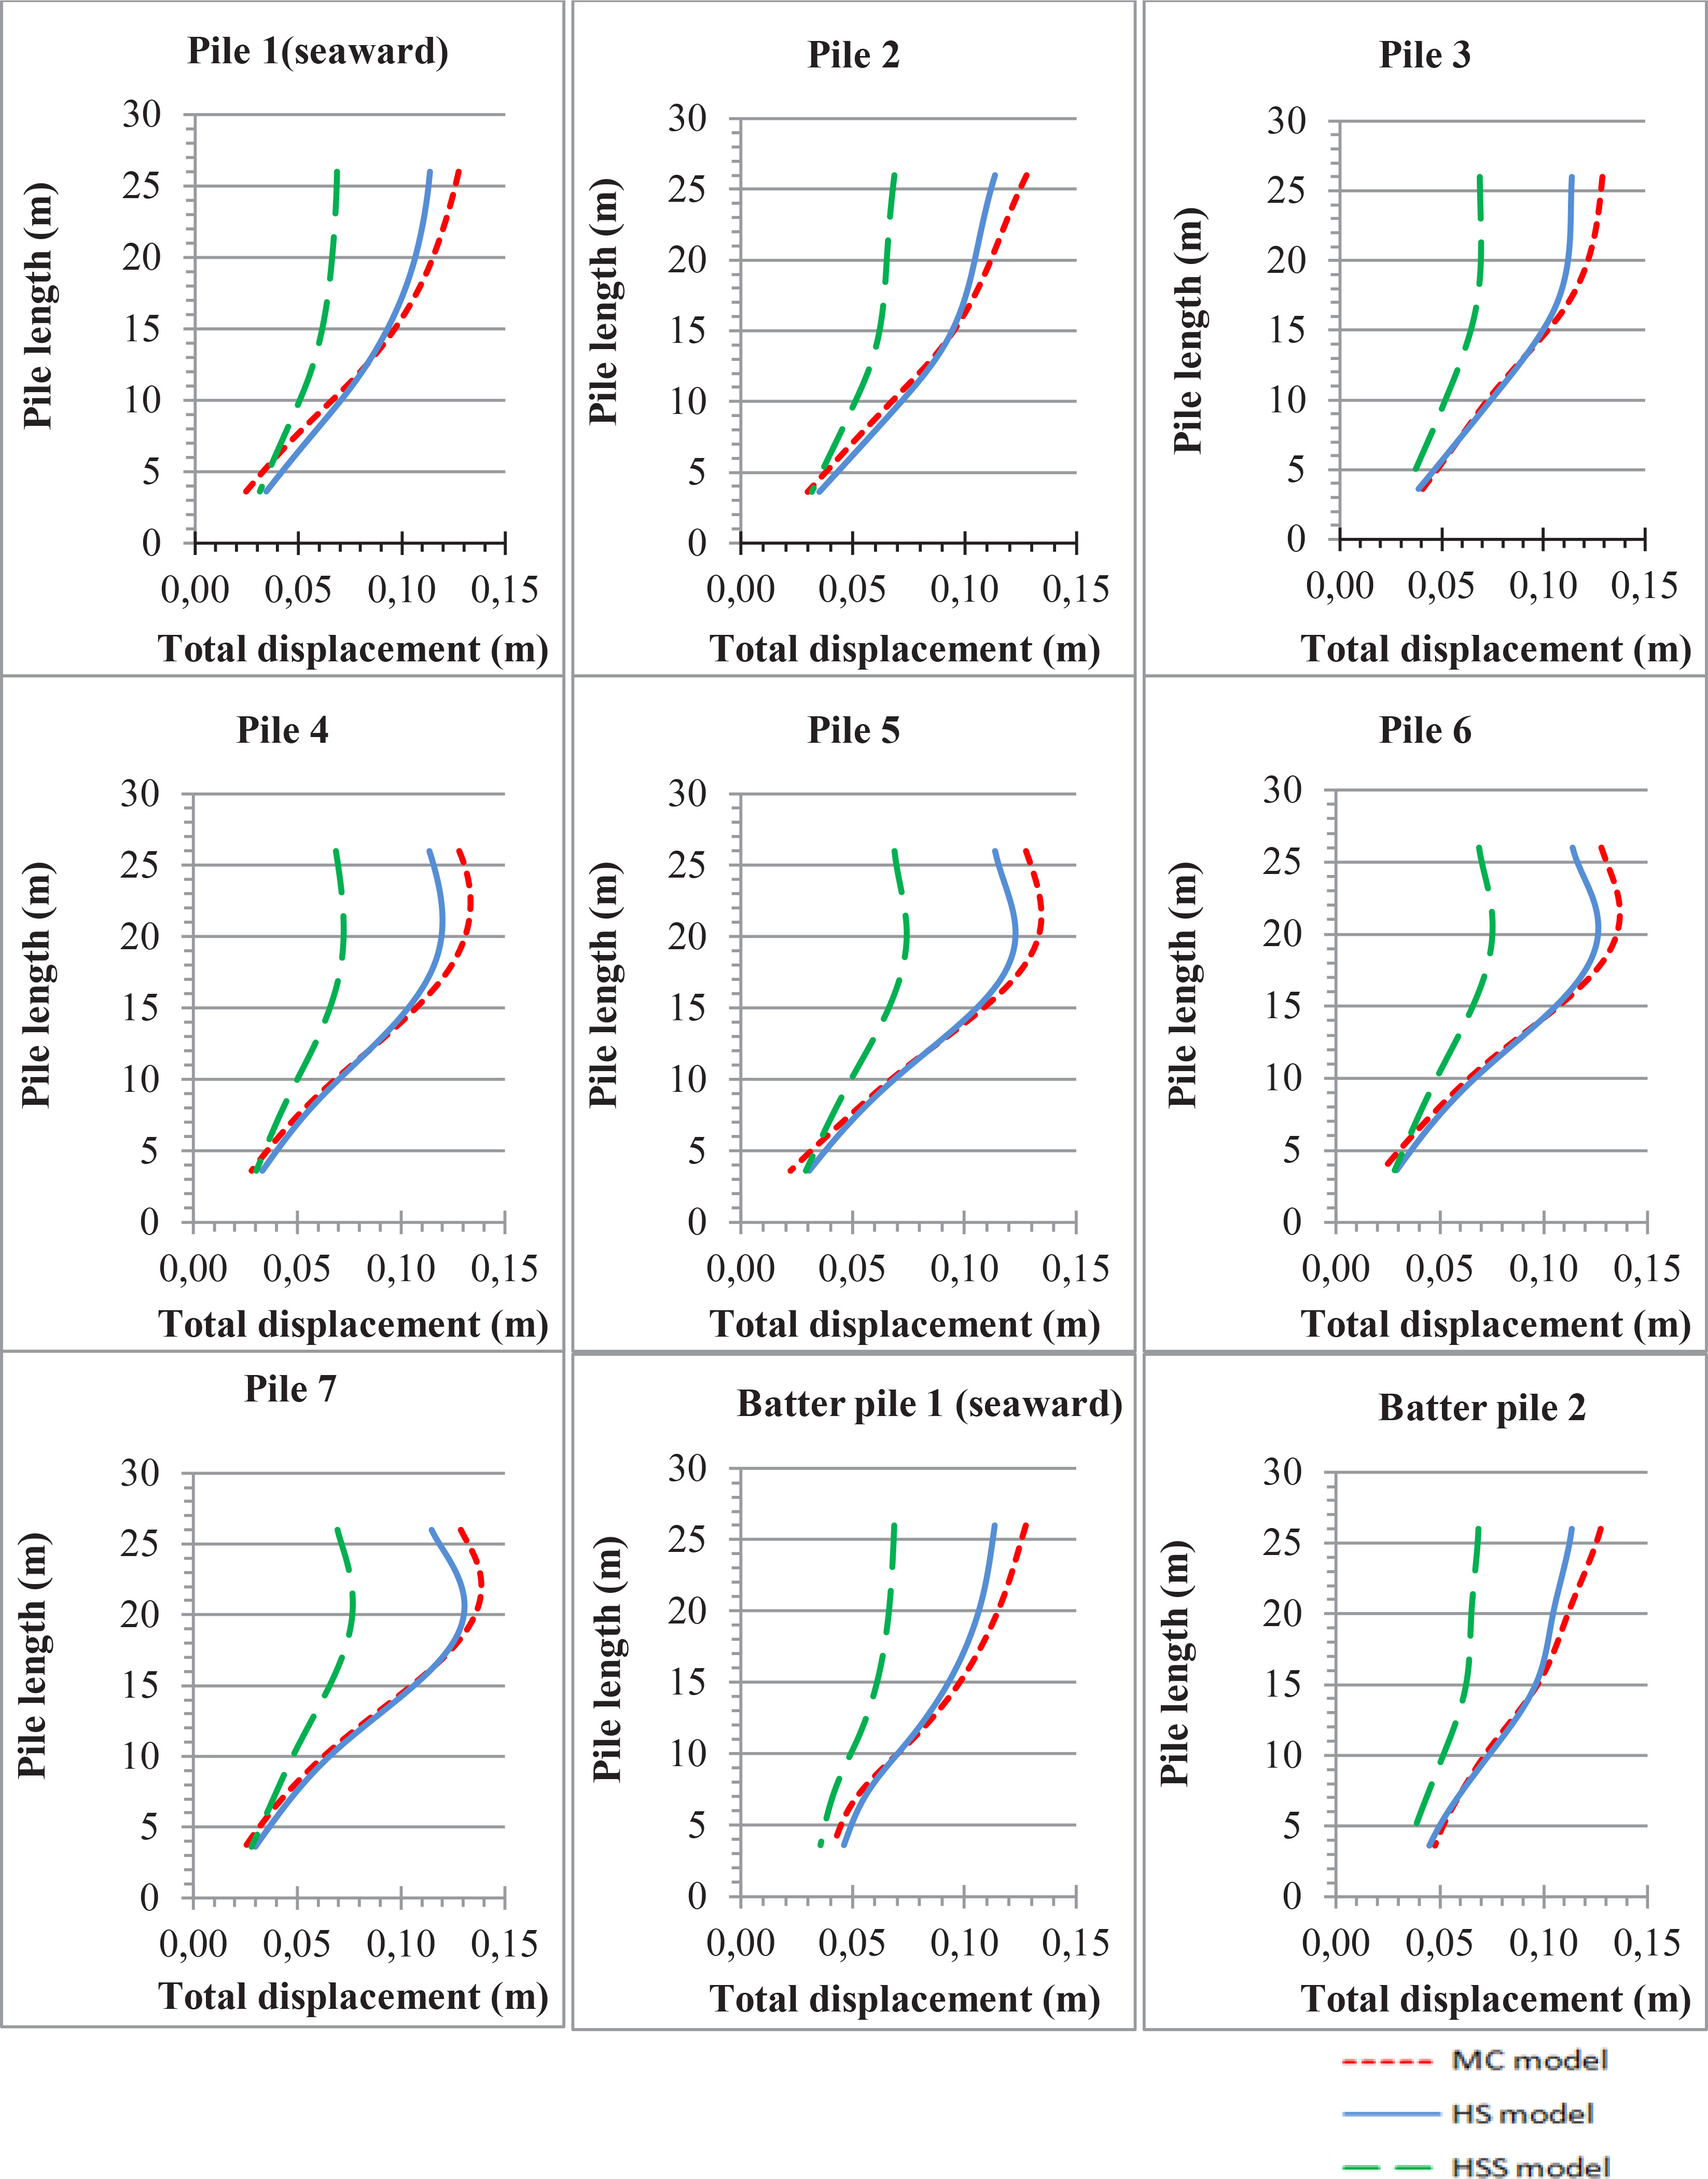
Figure 12
Total displacements of the piles.