
Table 1
List of the analysed static quantities.
| Beam division | Analysed quantity | Type of load | ||
|---|---|---|---|---|
| Scheme | 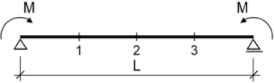 | 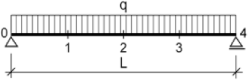 | 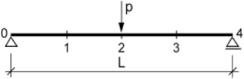 | |
| two sections c = L/2 | w2 | |||
| M2 | M | |||
| M2(FEM) | M | |||
| η2 | 1 | 6/5 | 3/2 | |
| w1 | ||||
| four sections c = L/4 | M1 | M | ||
| M2(FEM) | M | |||
| M1(FEM) | M | |||
| η2 | 1 | 24/23 | 6/5 | |
| η1 | 1 | 18/17 | 1 | |
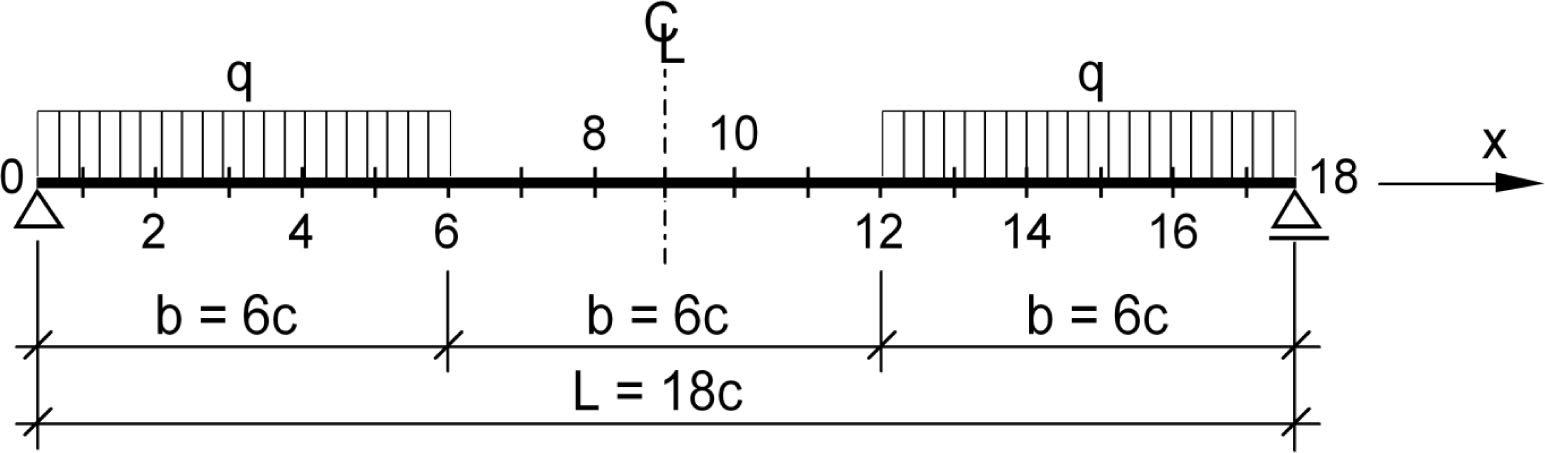
Figure 1
Static scheme of an analysed beam system.
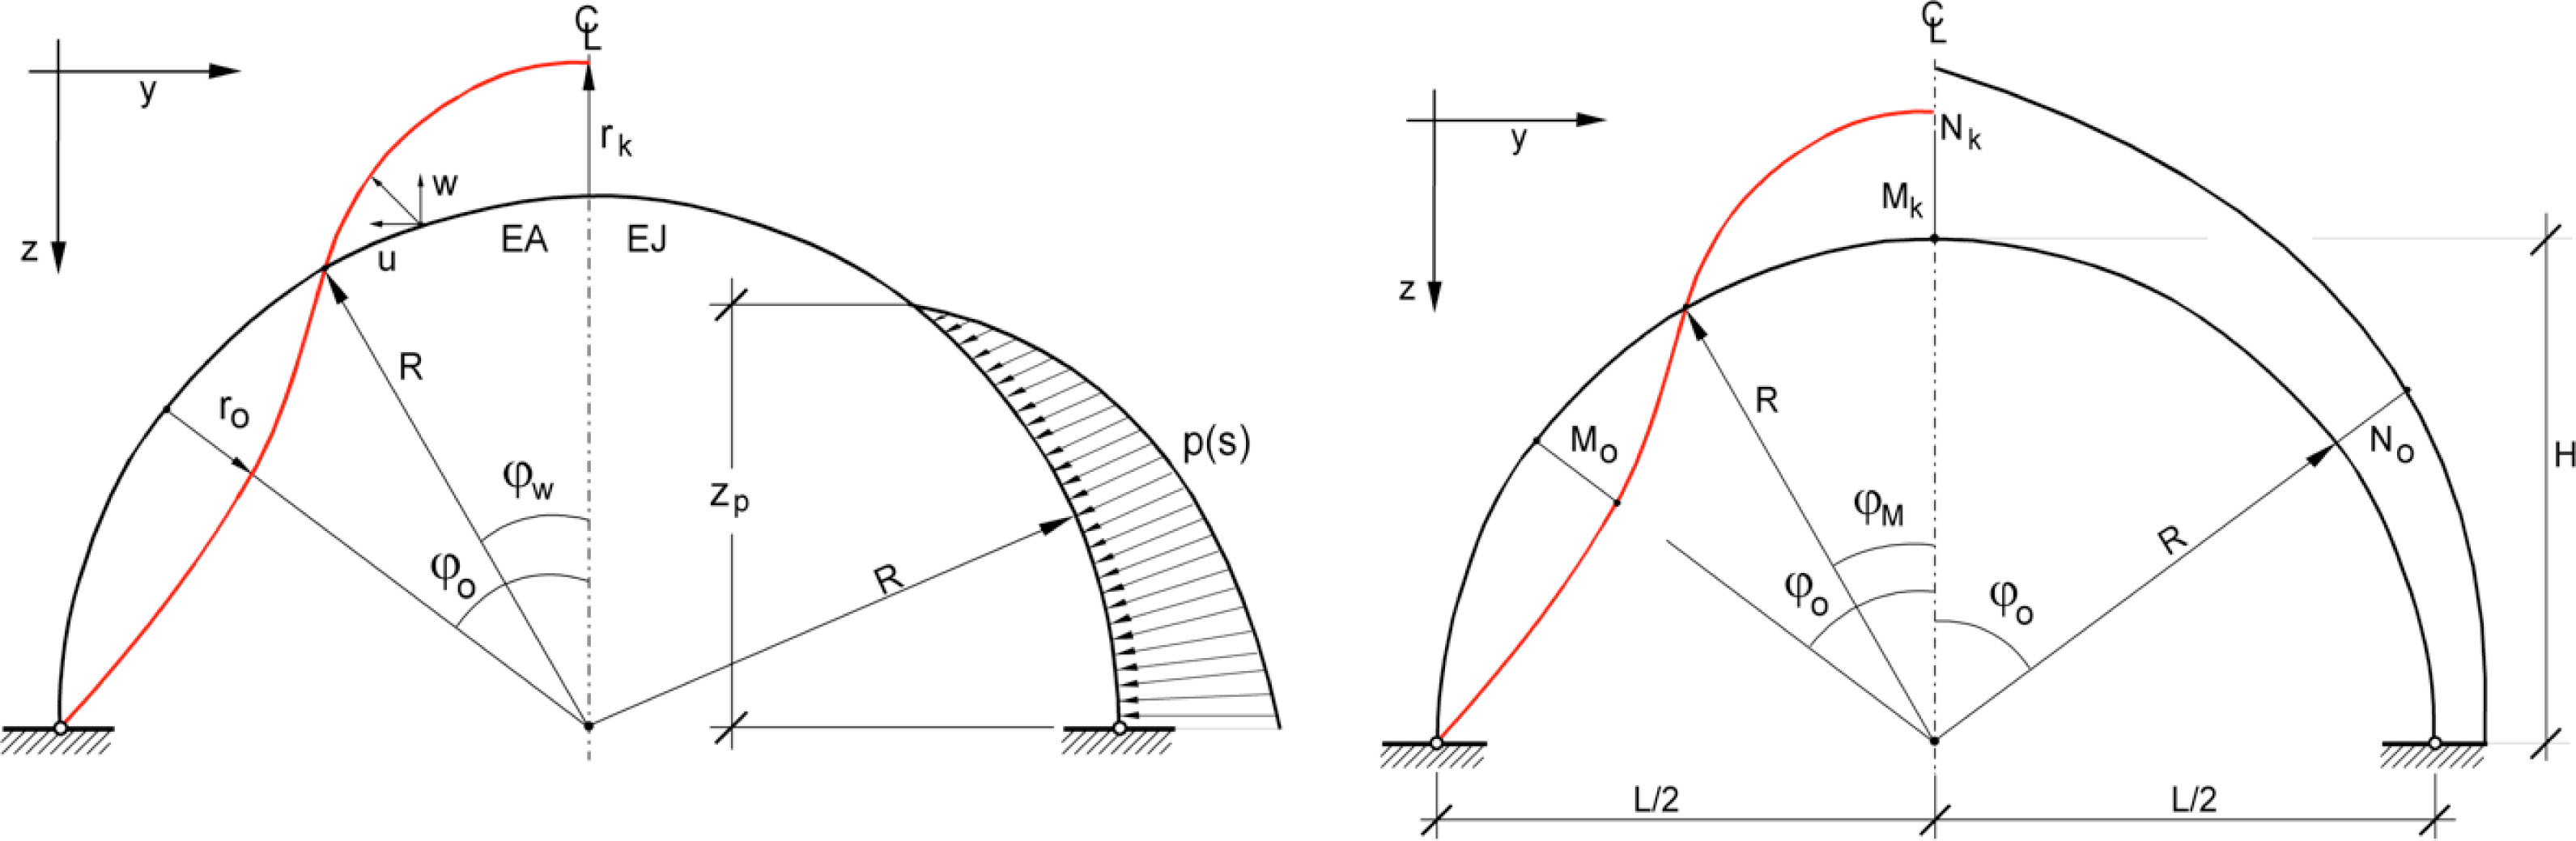
Figure 2
Diagram of the impact of filling, and also the deformation of the circumferential layers of the shell.
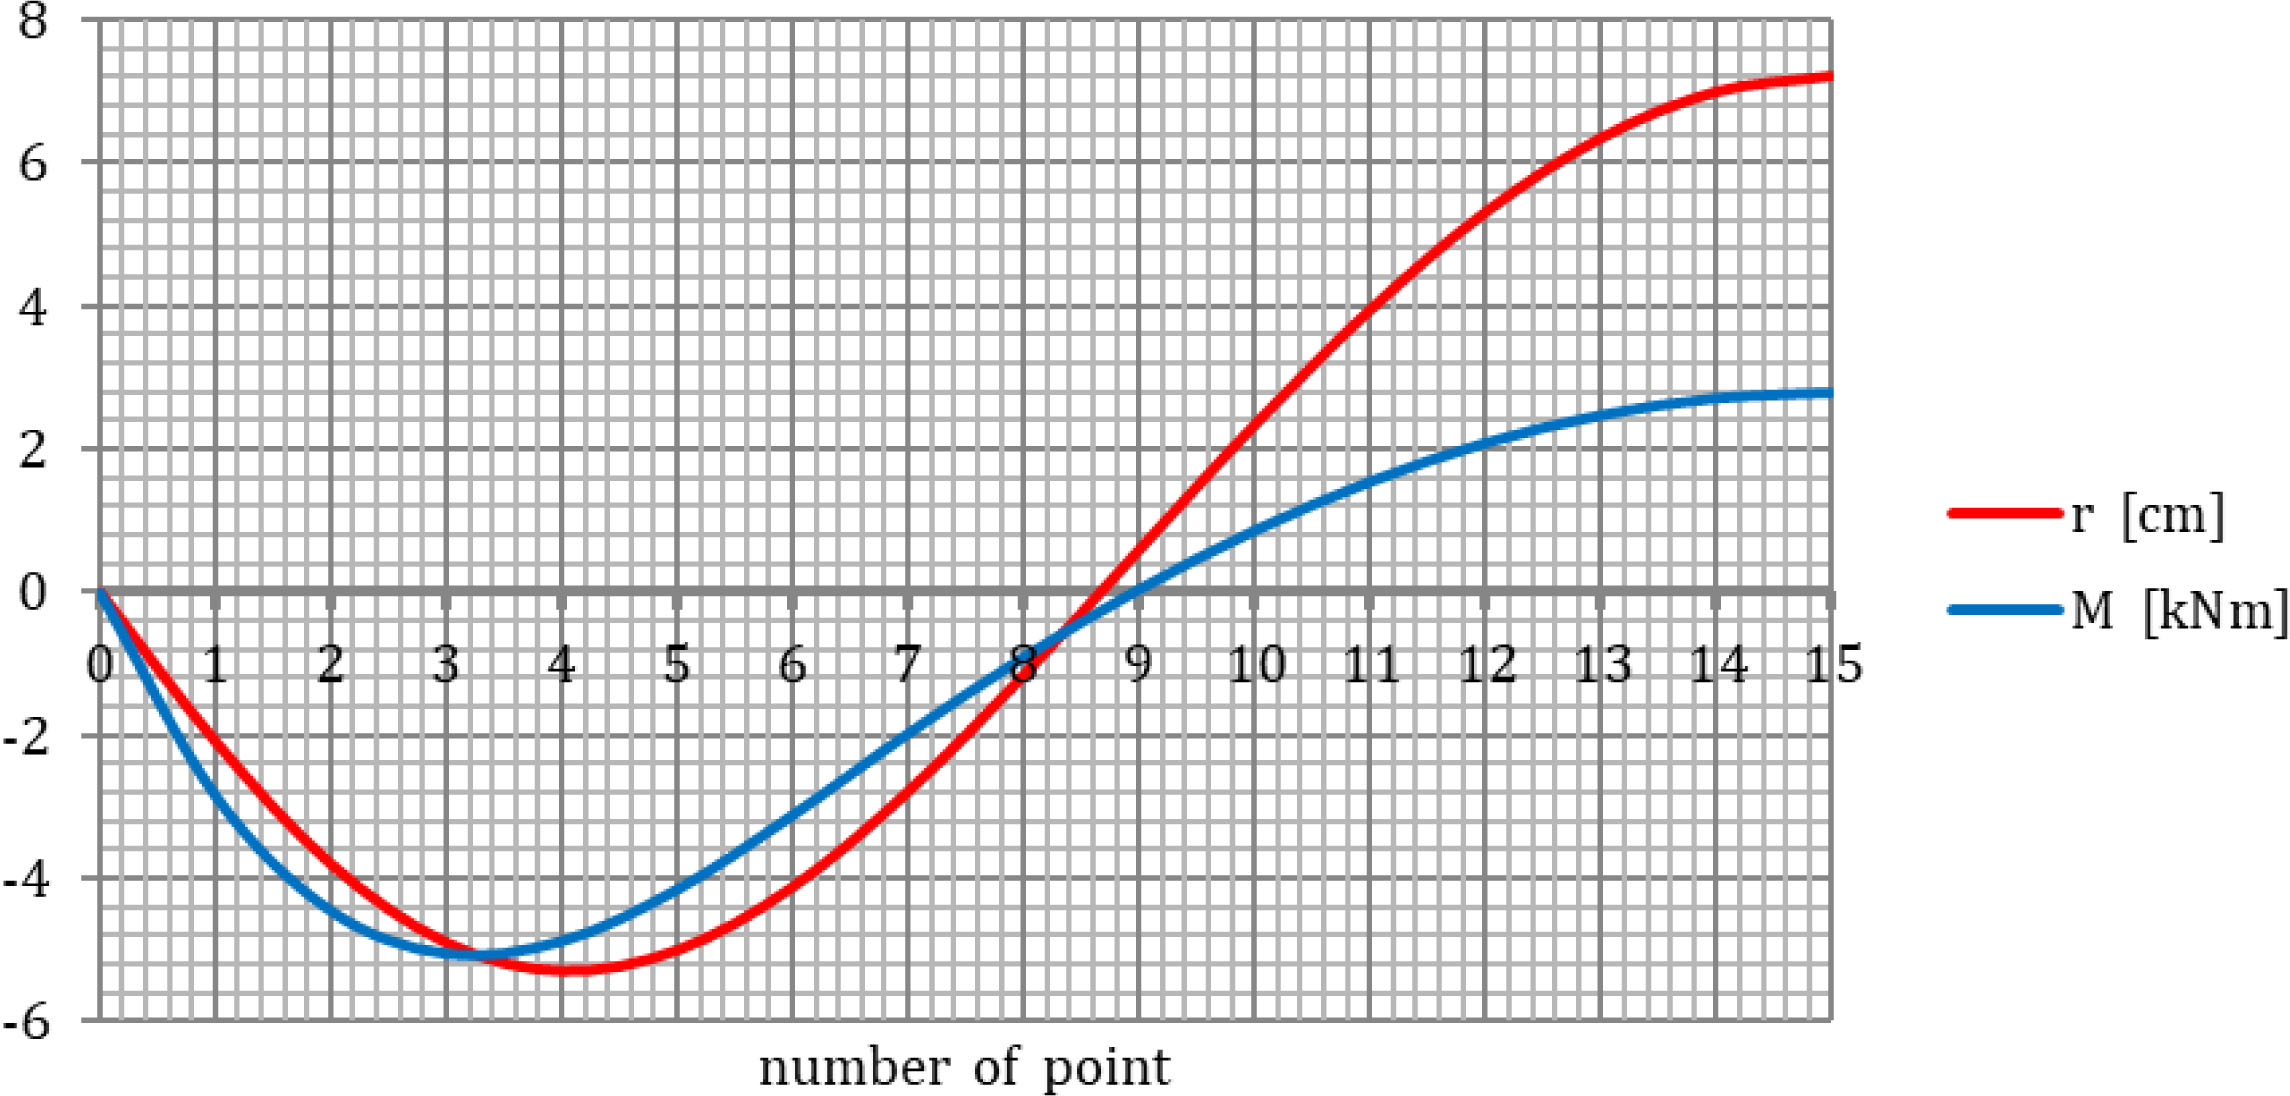
Figure 3
The diagrams of the bending moments and displacements calculated using the FEM model.
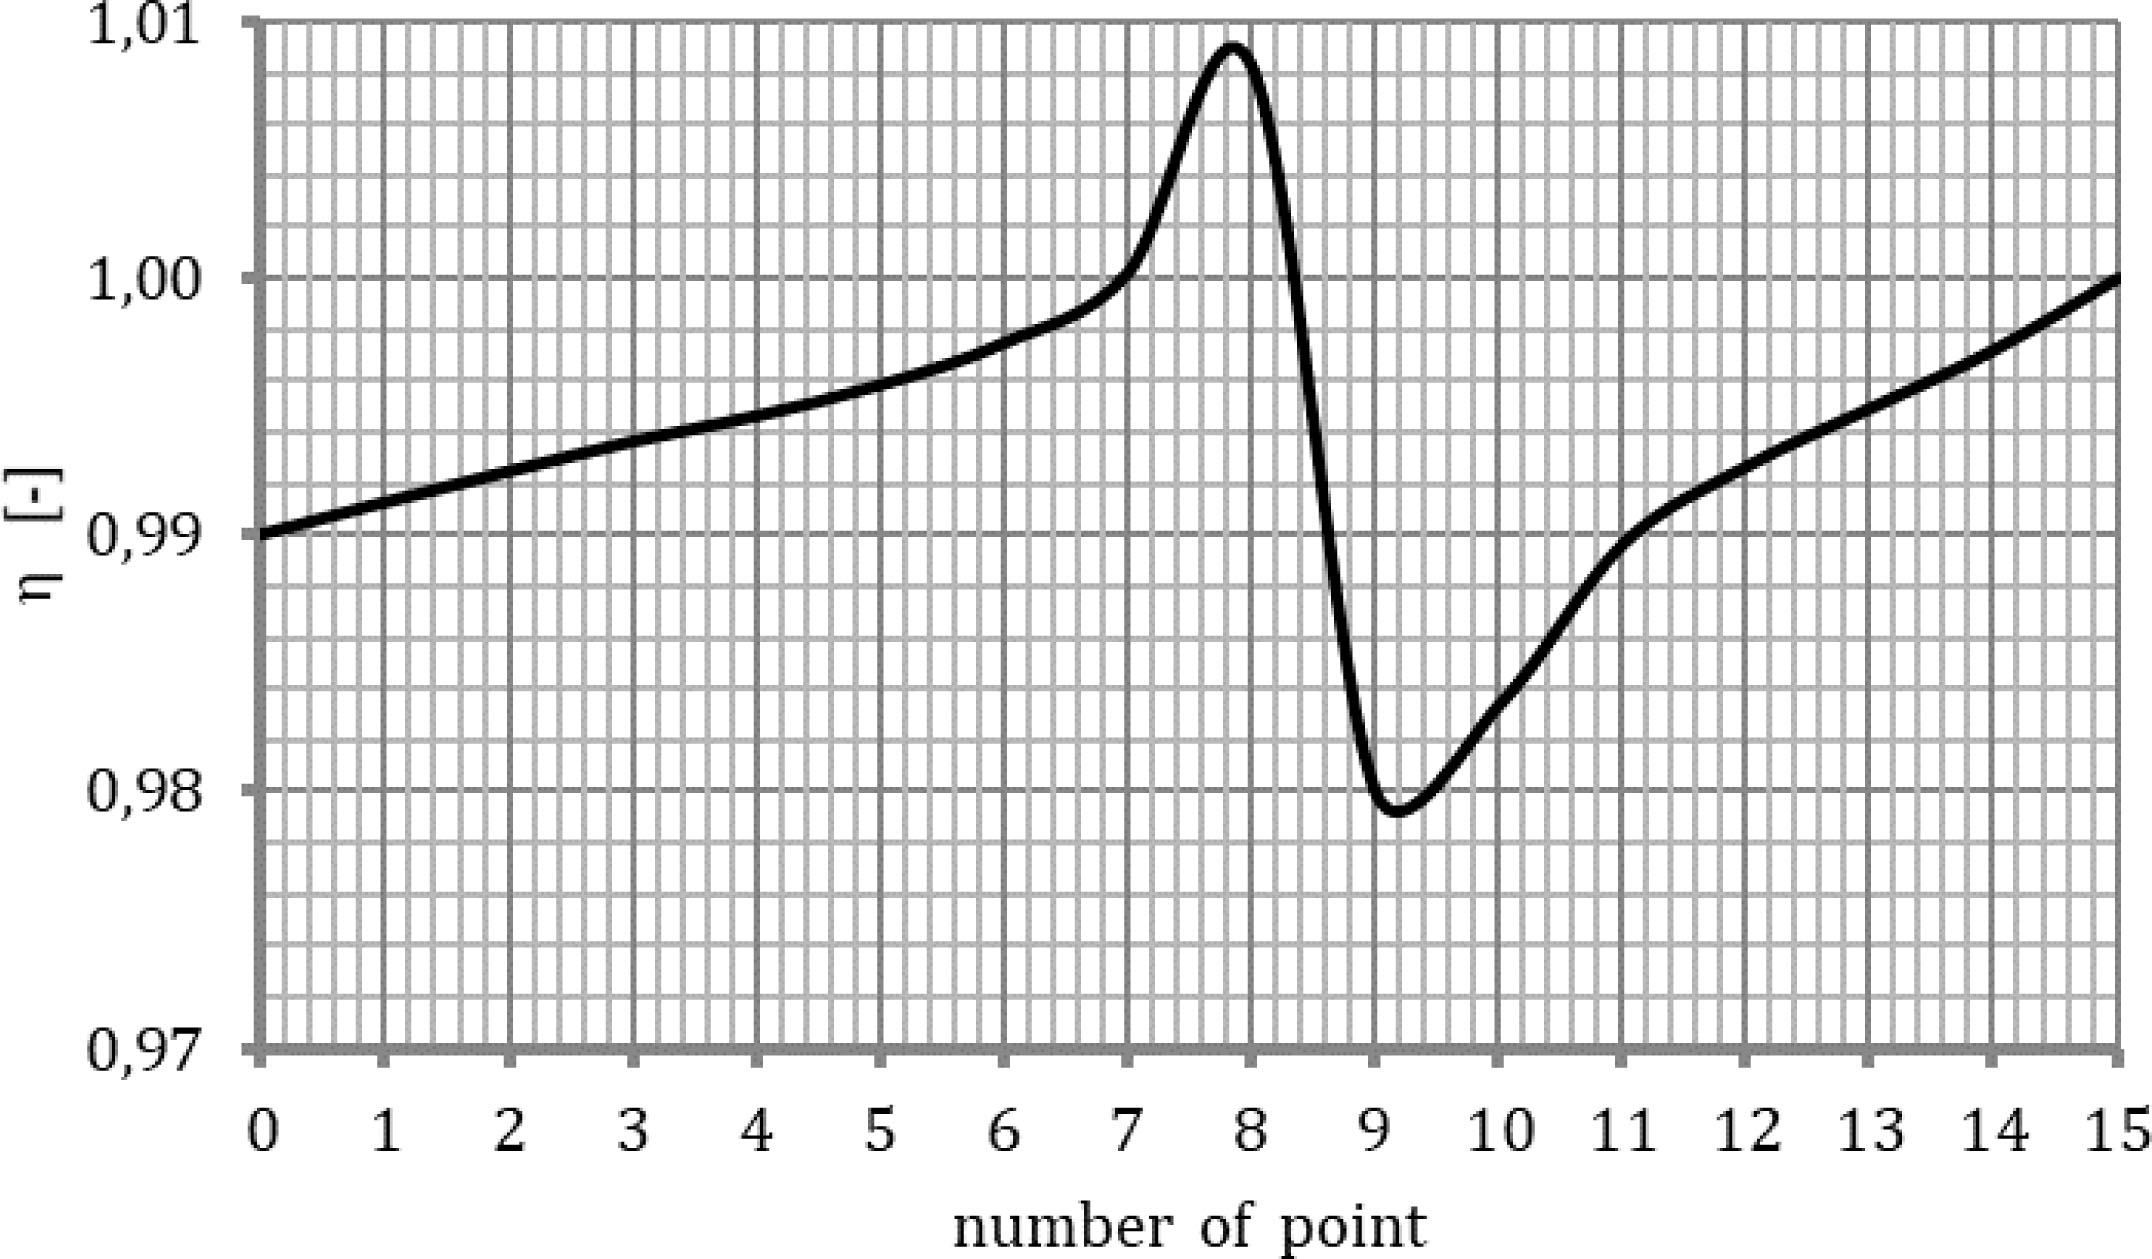
Figure 4
Distribution of differential coefficients along the length of the arch.
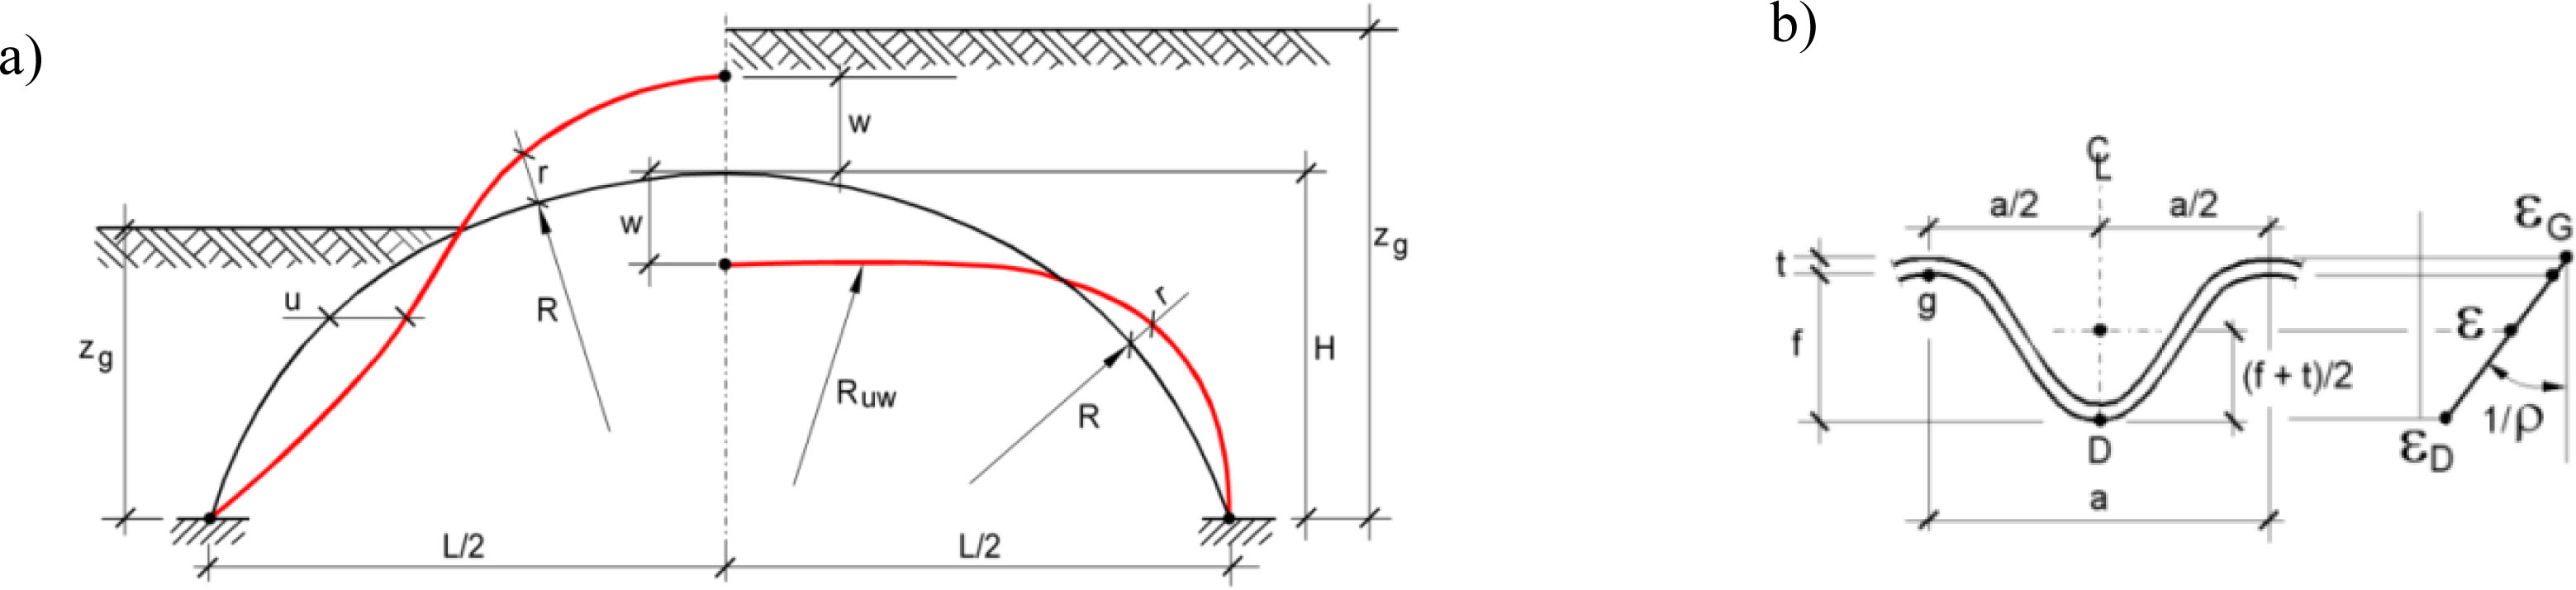
Figure 5
Geometry of the circumferential band of the shell: a) deformation of the shell, b) distribution of the deformations in the cross-section of the shell that is evaluated.
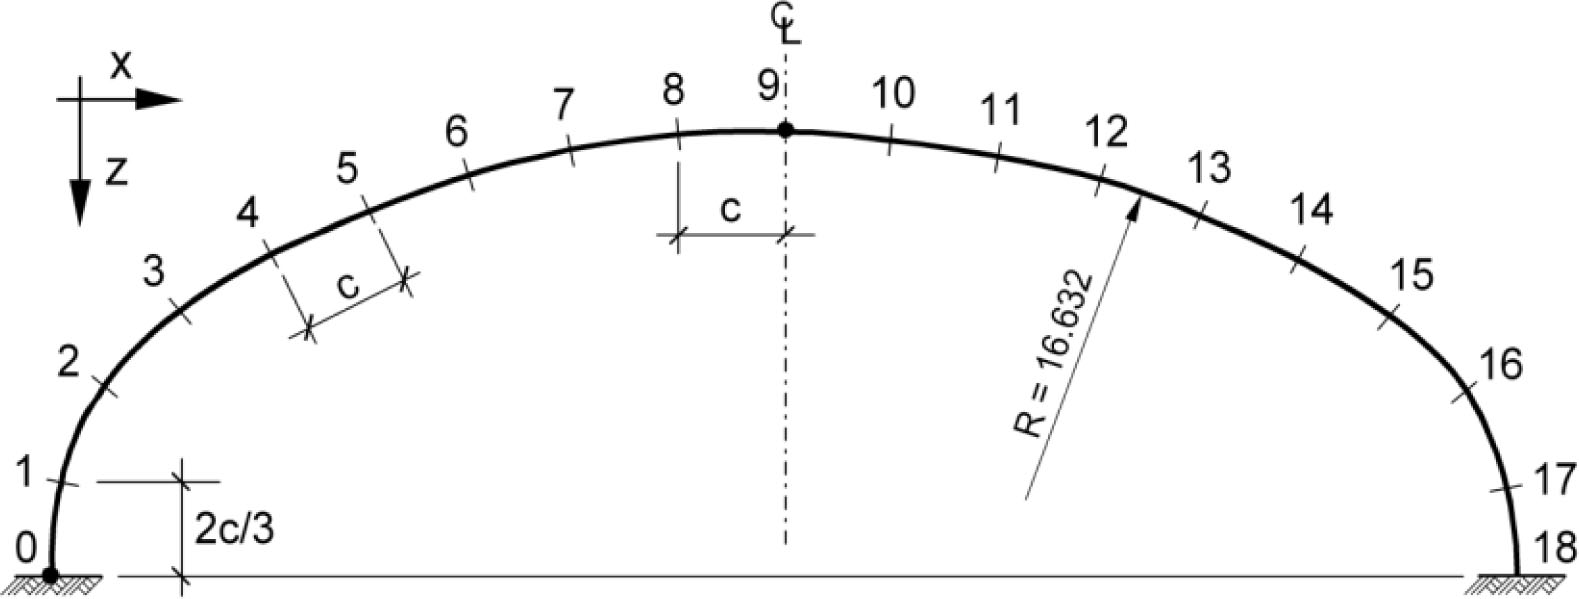
Figure 6
Scheme of the circumferential band of the shell with the collocation points.
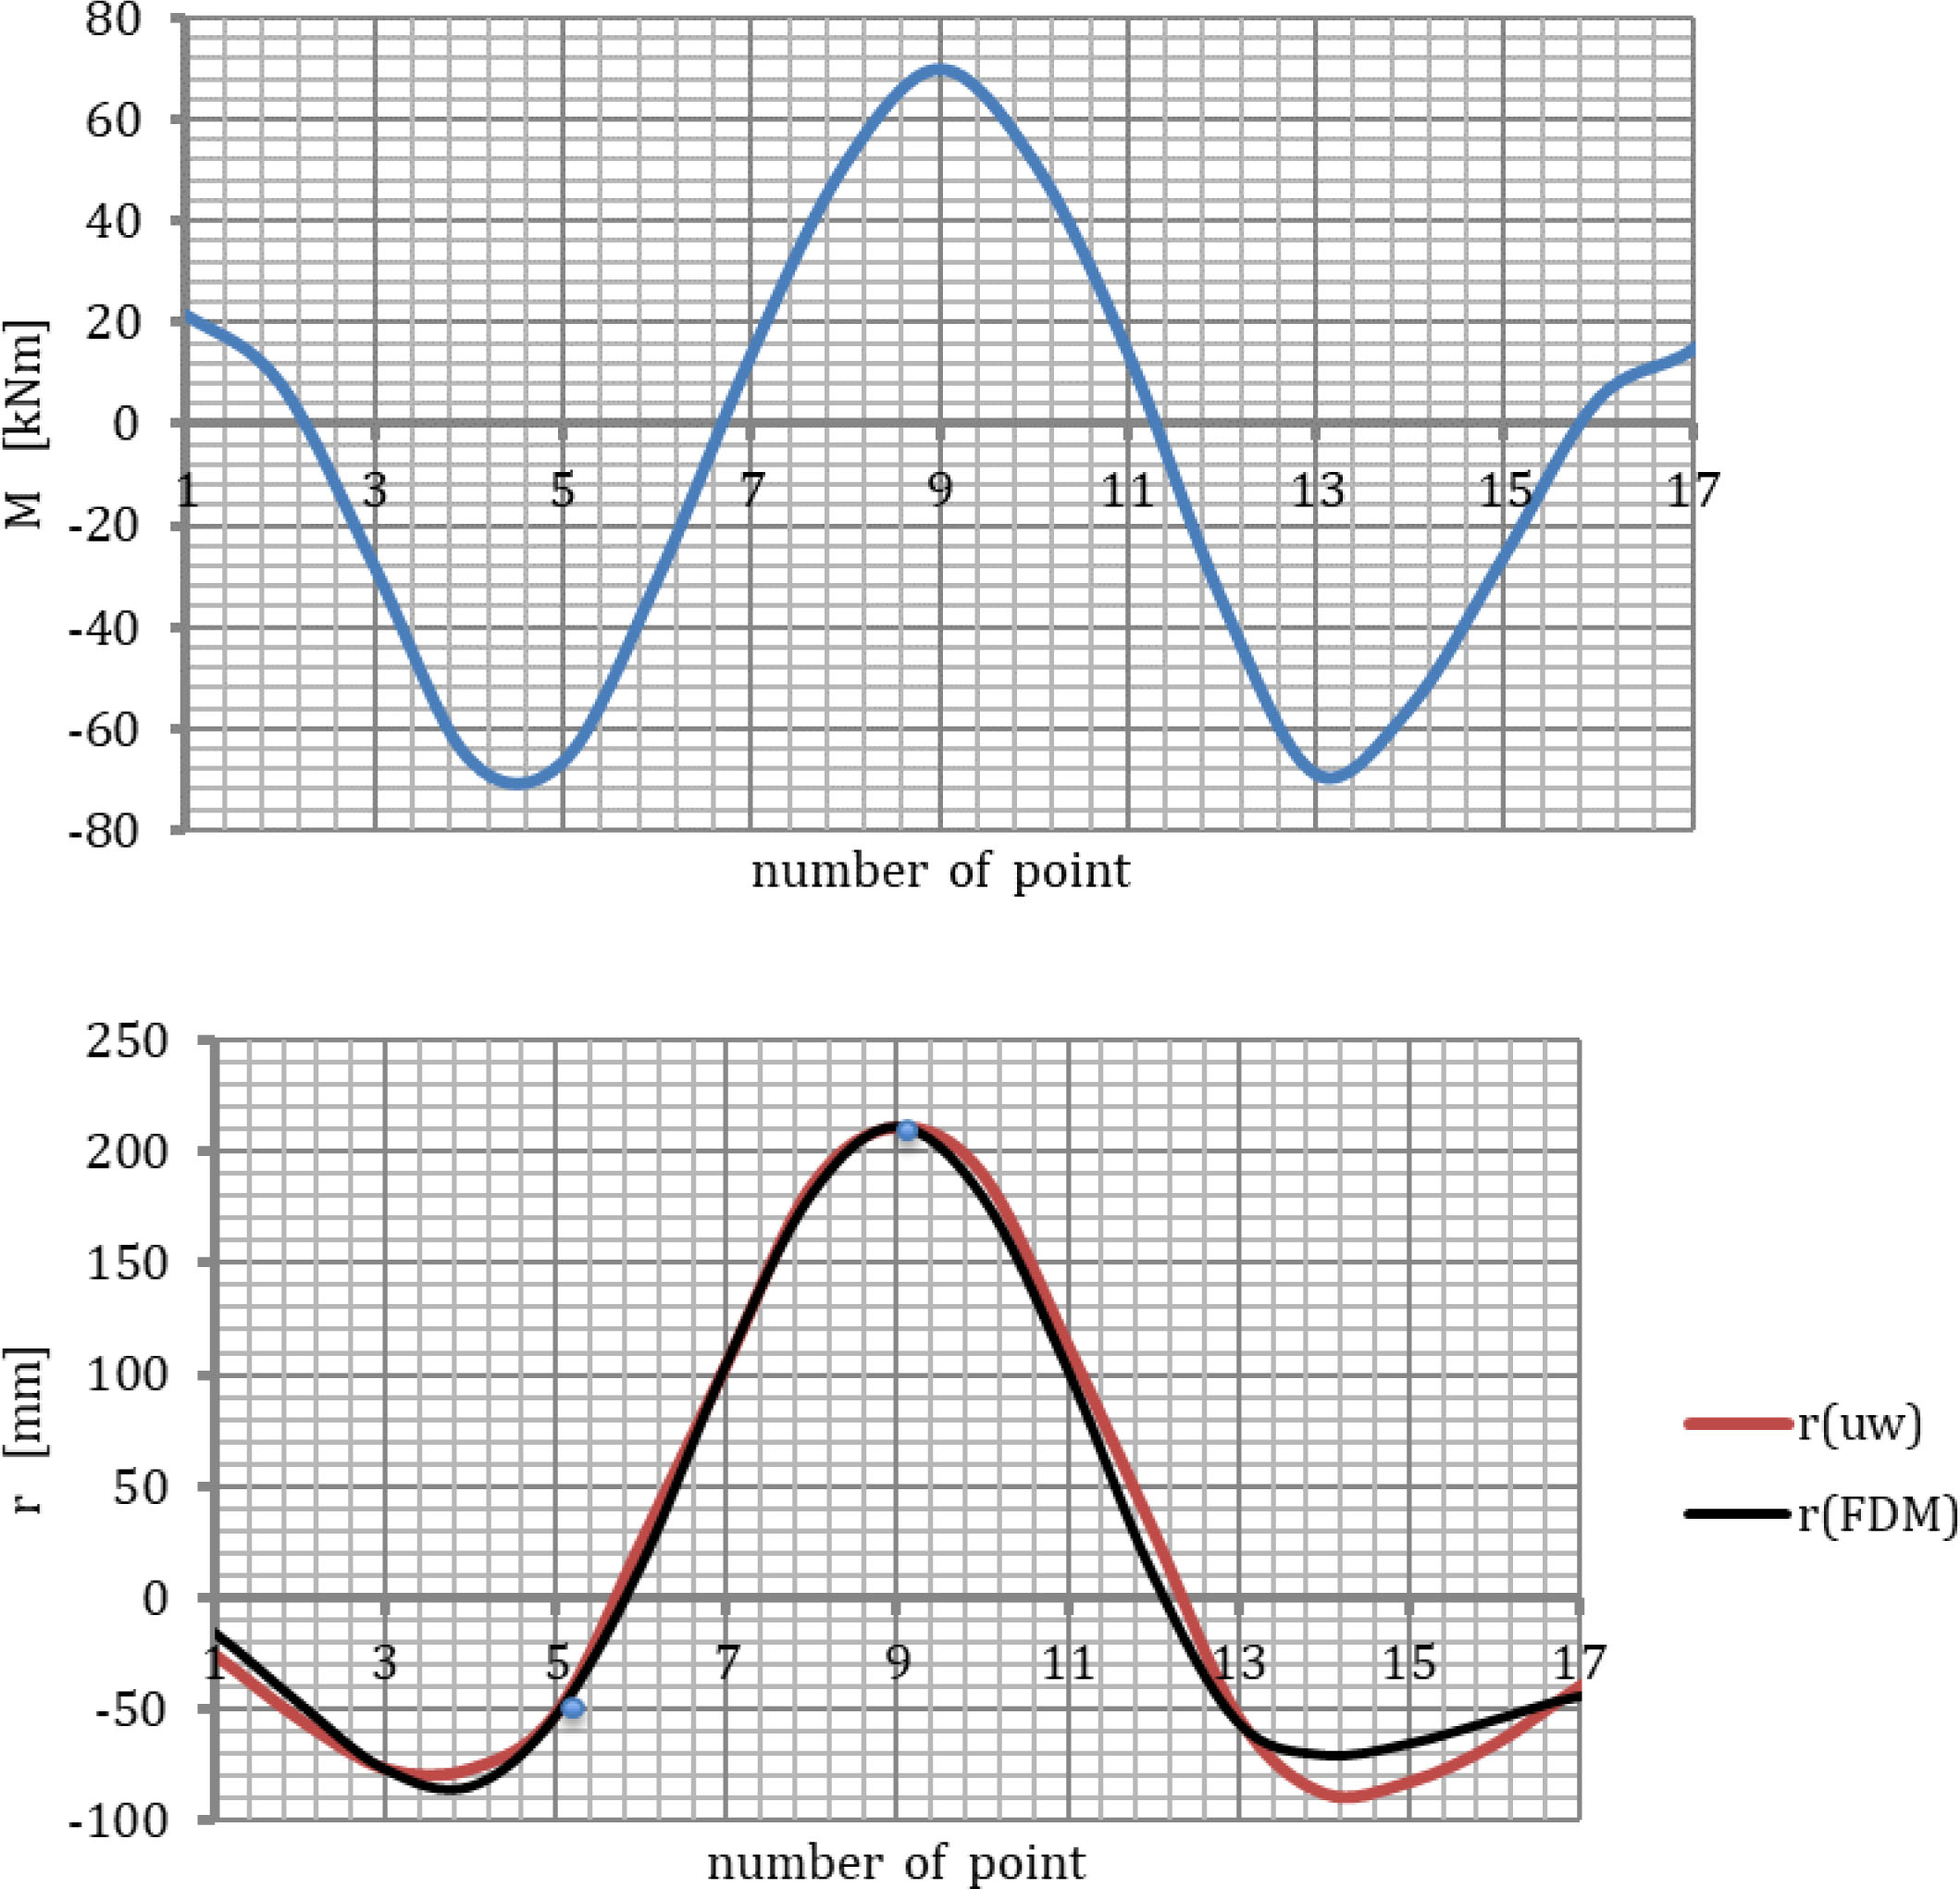
Figure 7
Bending moments and radial displacements in the circumferential band of the shell when zg = H.
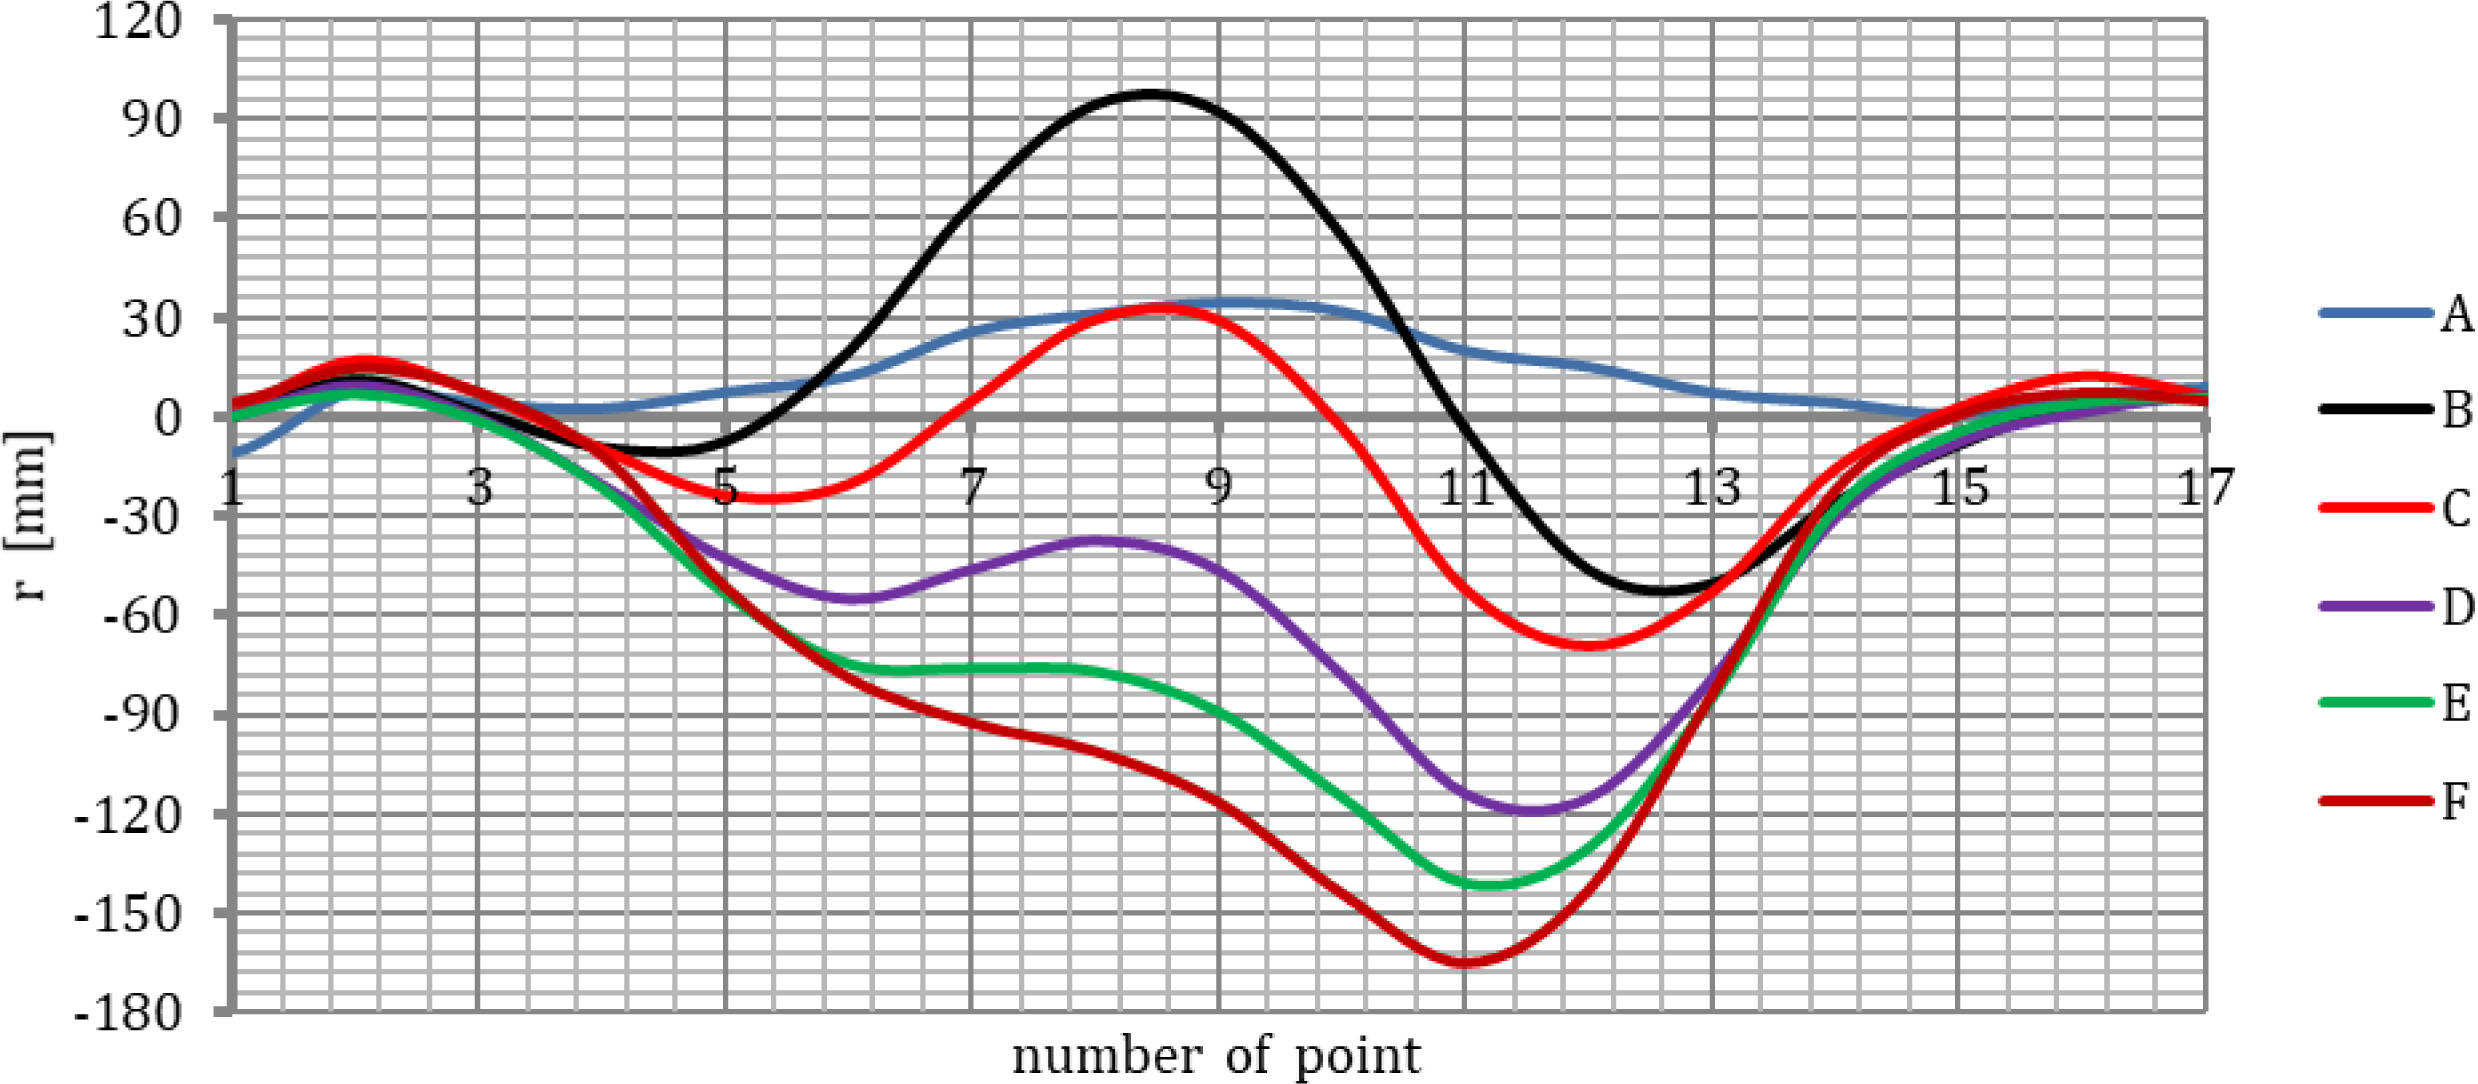
Figure 8
Functions of the deformations of the circumferential band of the shell.
Table 2
Comparison of the results of geodetic and strain gauge measurements.
| Construction phase | A | B | C | D | E | F |
|---|---|---|---|---|---|---|
| κ(r)•10−3 [1/m] | 0.985 | 5.745 | 5.302 | 3.699 | 2.248 | 1.936 |
| κ(ε) 10−3 [1/m] | 0.886 | 5.363 | 5.038 | 4.276 | 2.484 | 2.614 |
| η | 0.899 | 0.933 | 0.950 | 1.156 | 1.105 | 1.350 |
| w [mm] | 34.7 | 92.3 | 28.8 | −46.8 | −89.4 | −116.3 |
| zg [m] | 7.54/7.25 | 9.78/9.99 | 10.44/11.04 | 10.48/11.32 | 11.07/11.92 | 11.73/12.32 |
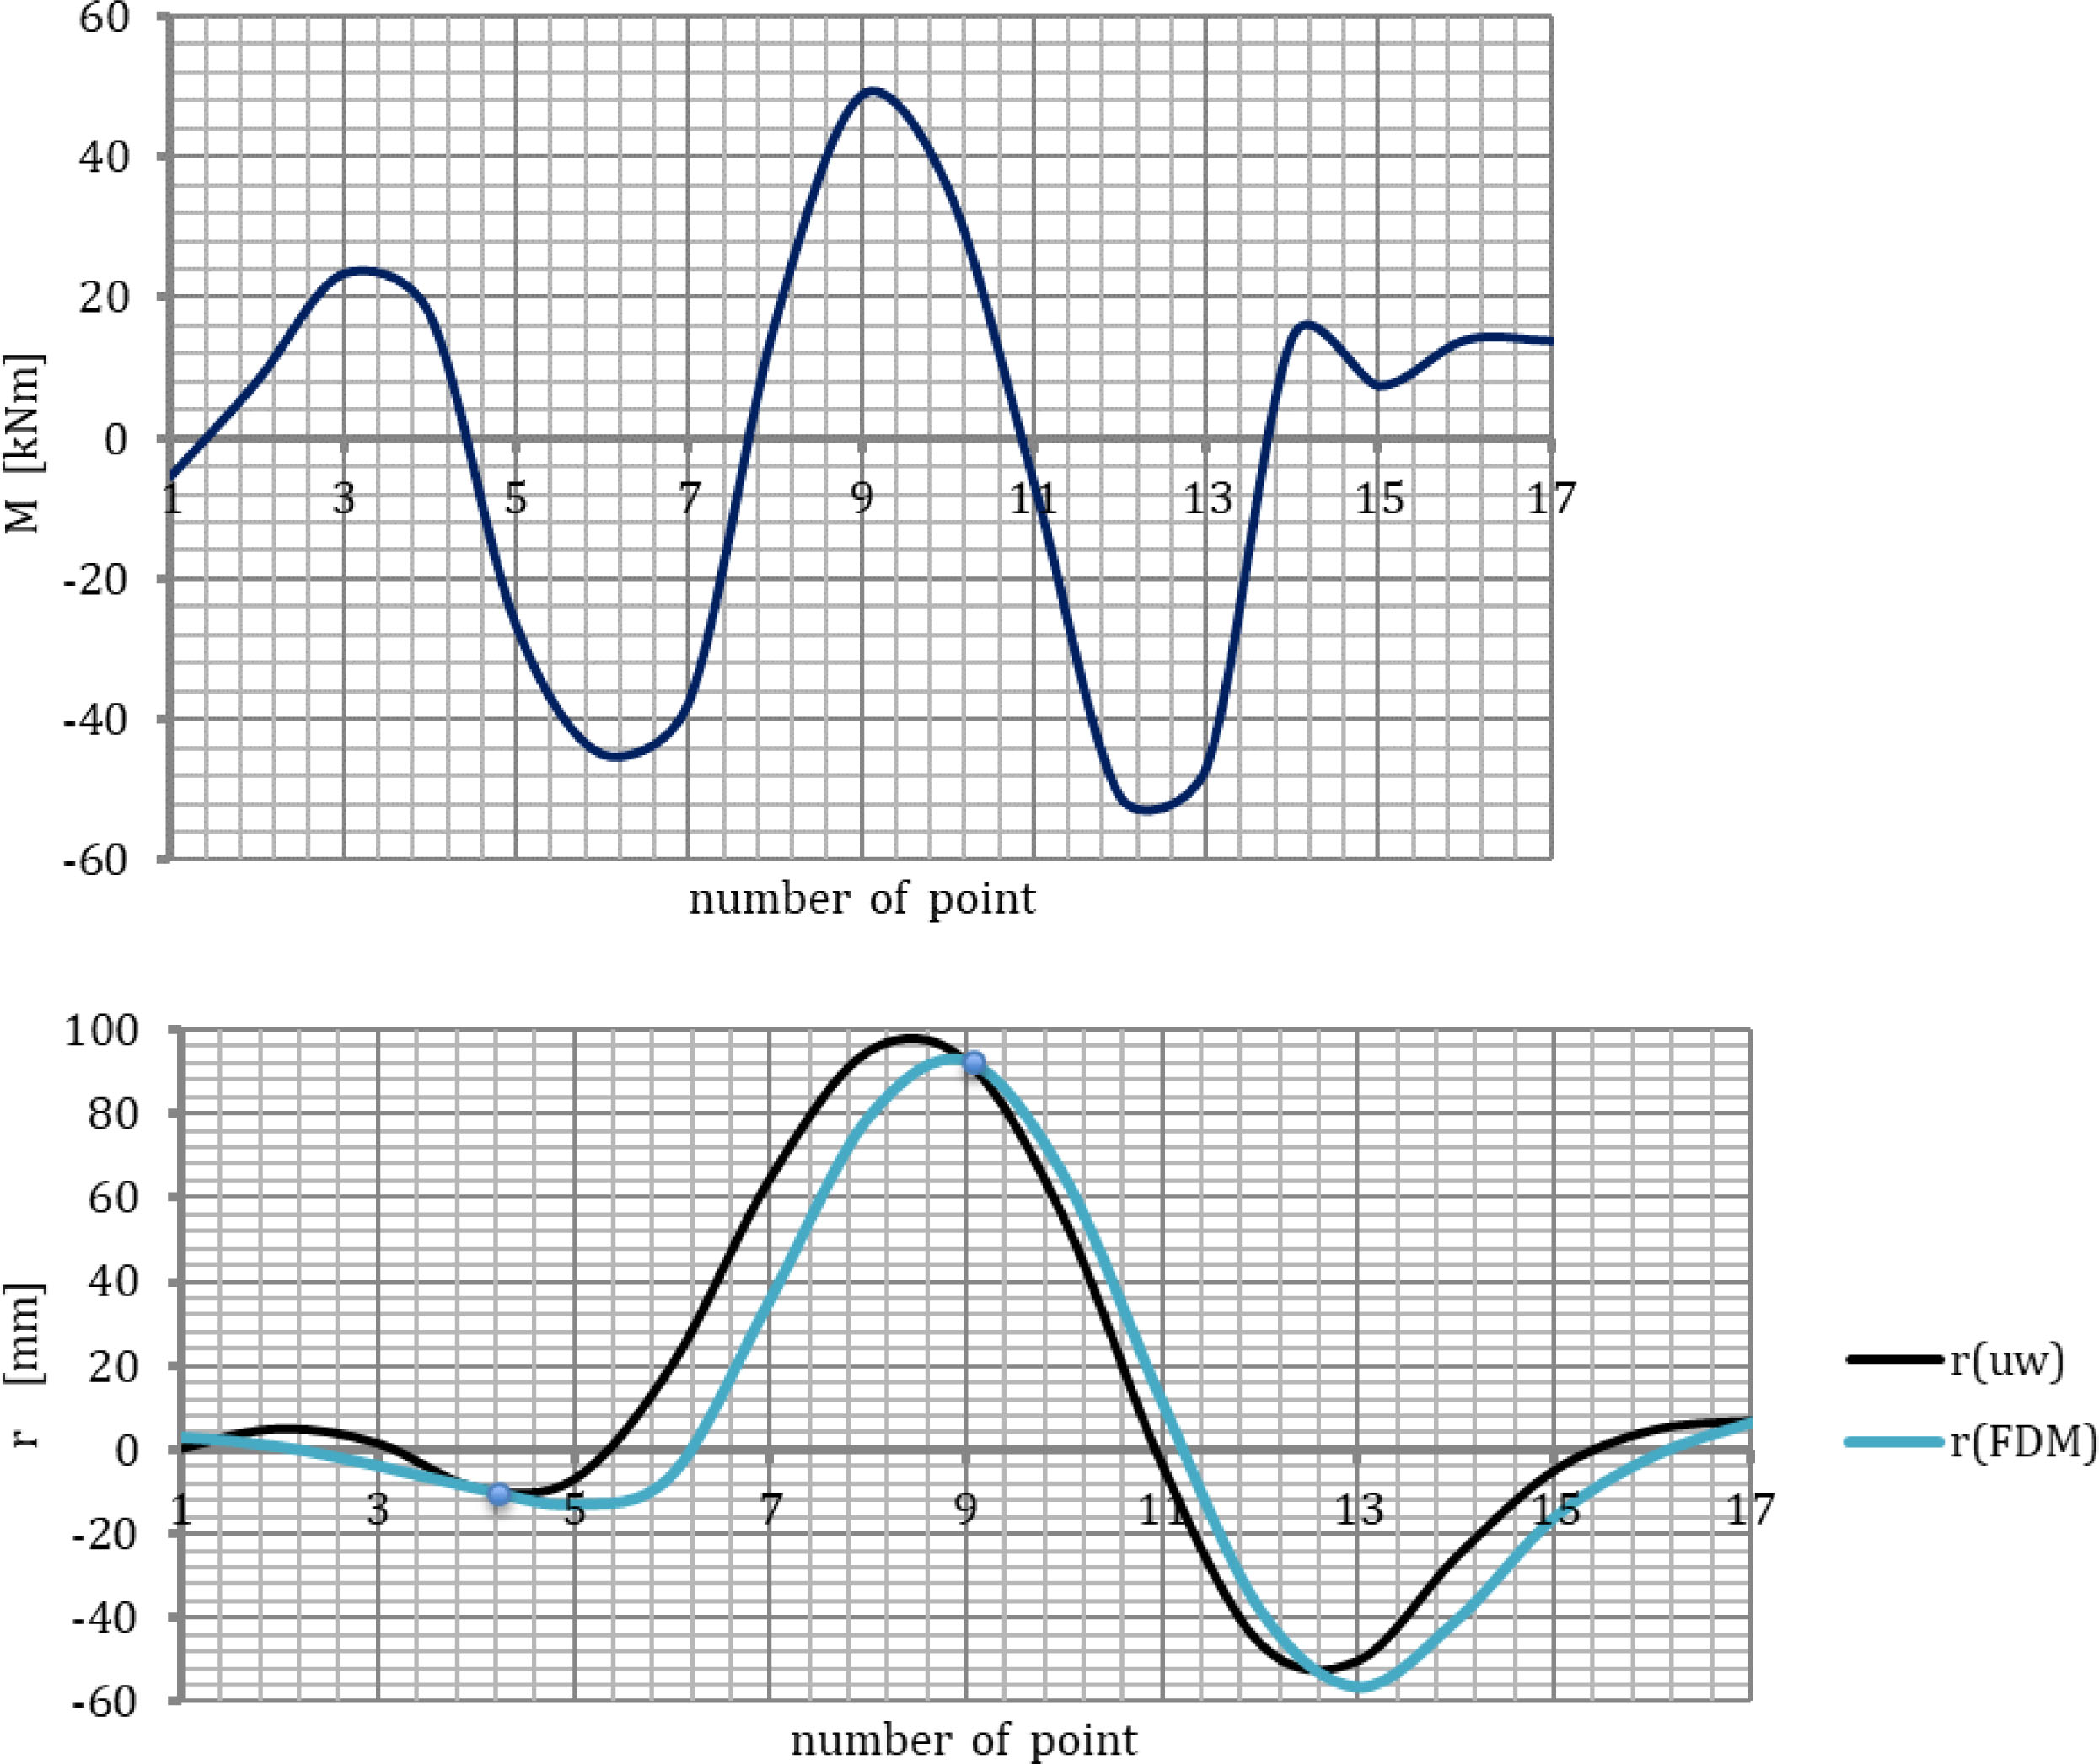
Figure 9
Radial displacements in the circumferential band of the shell during construction phase B.
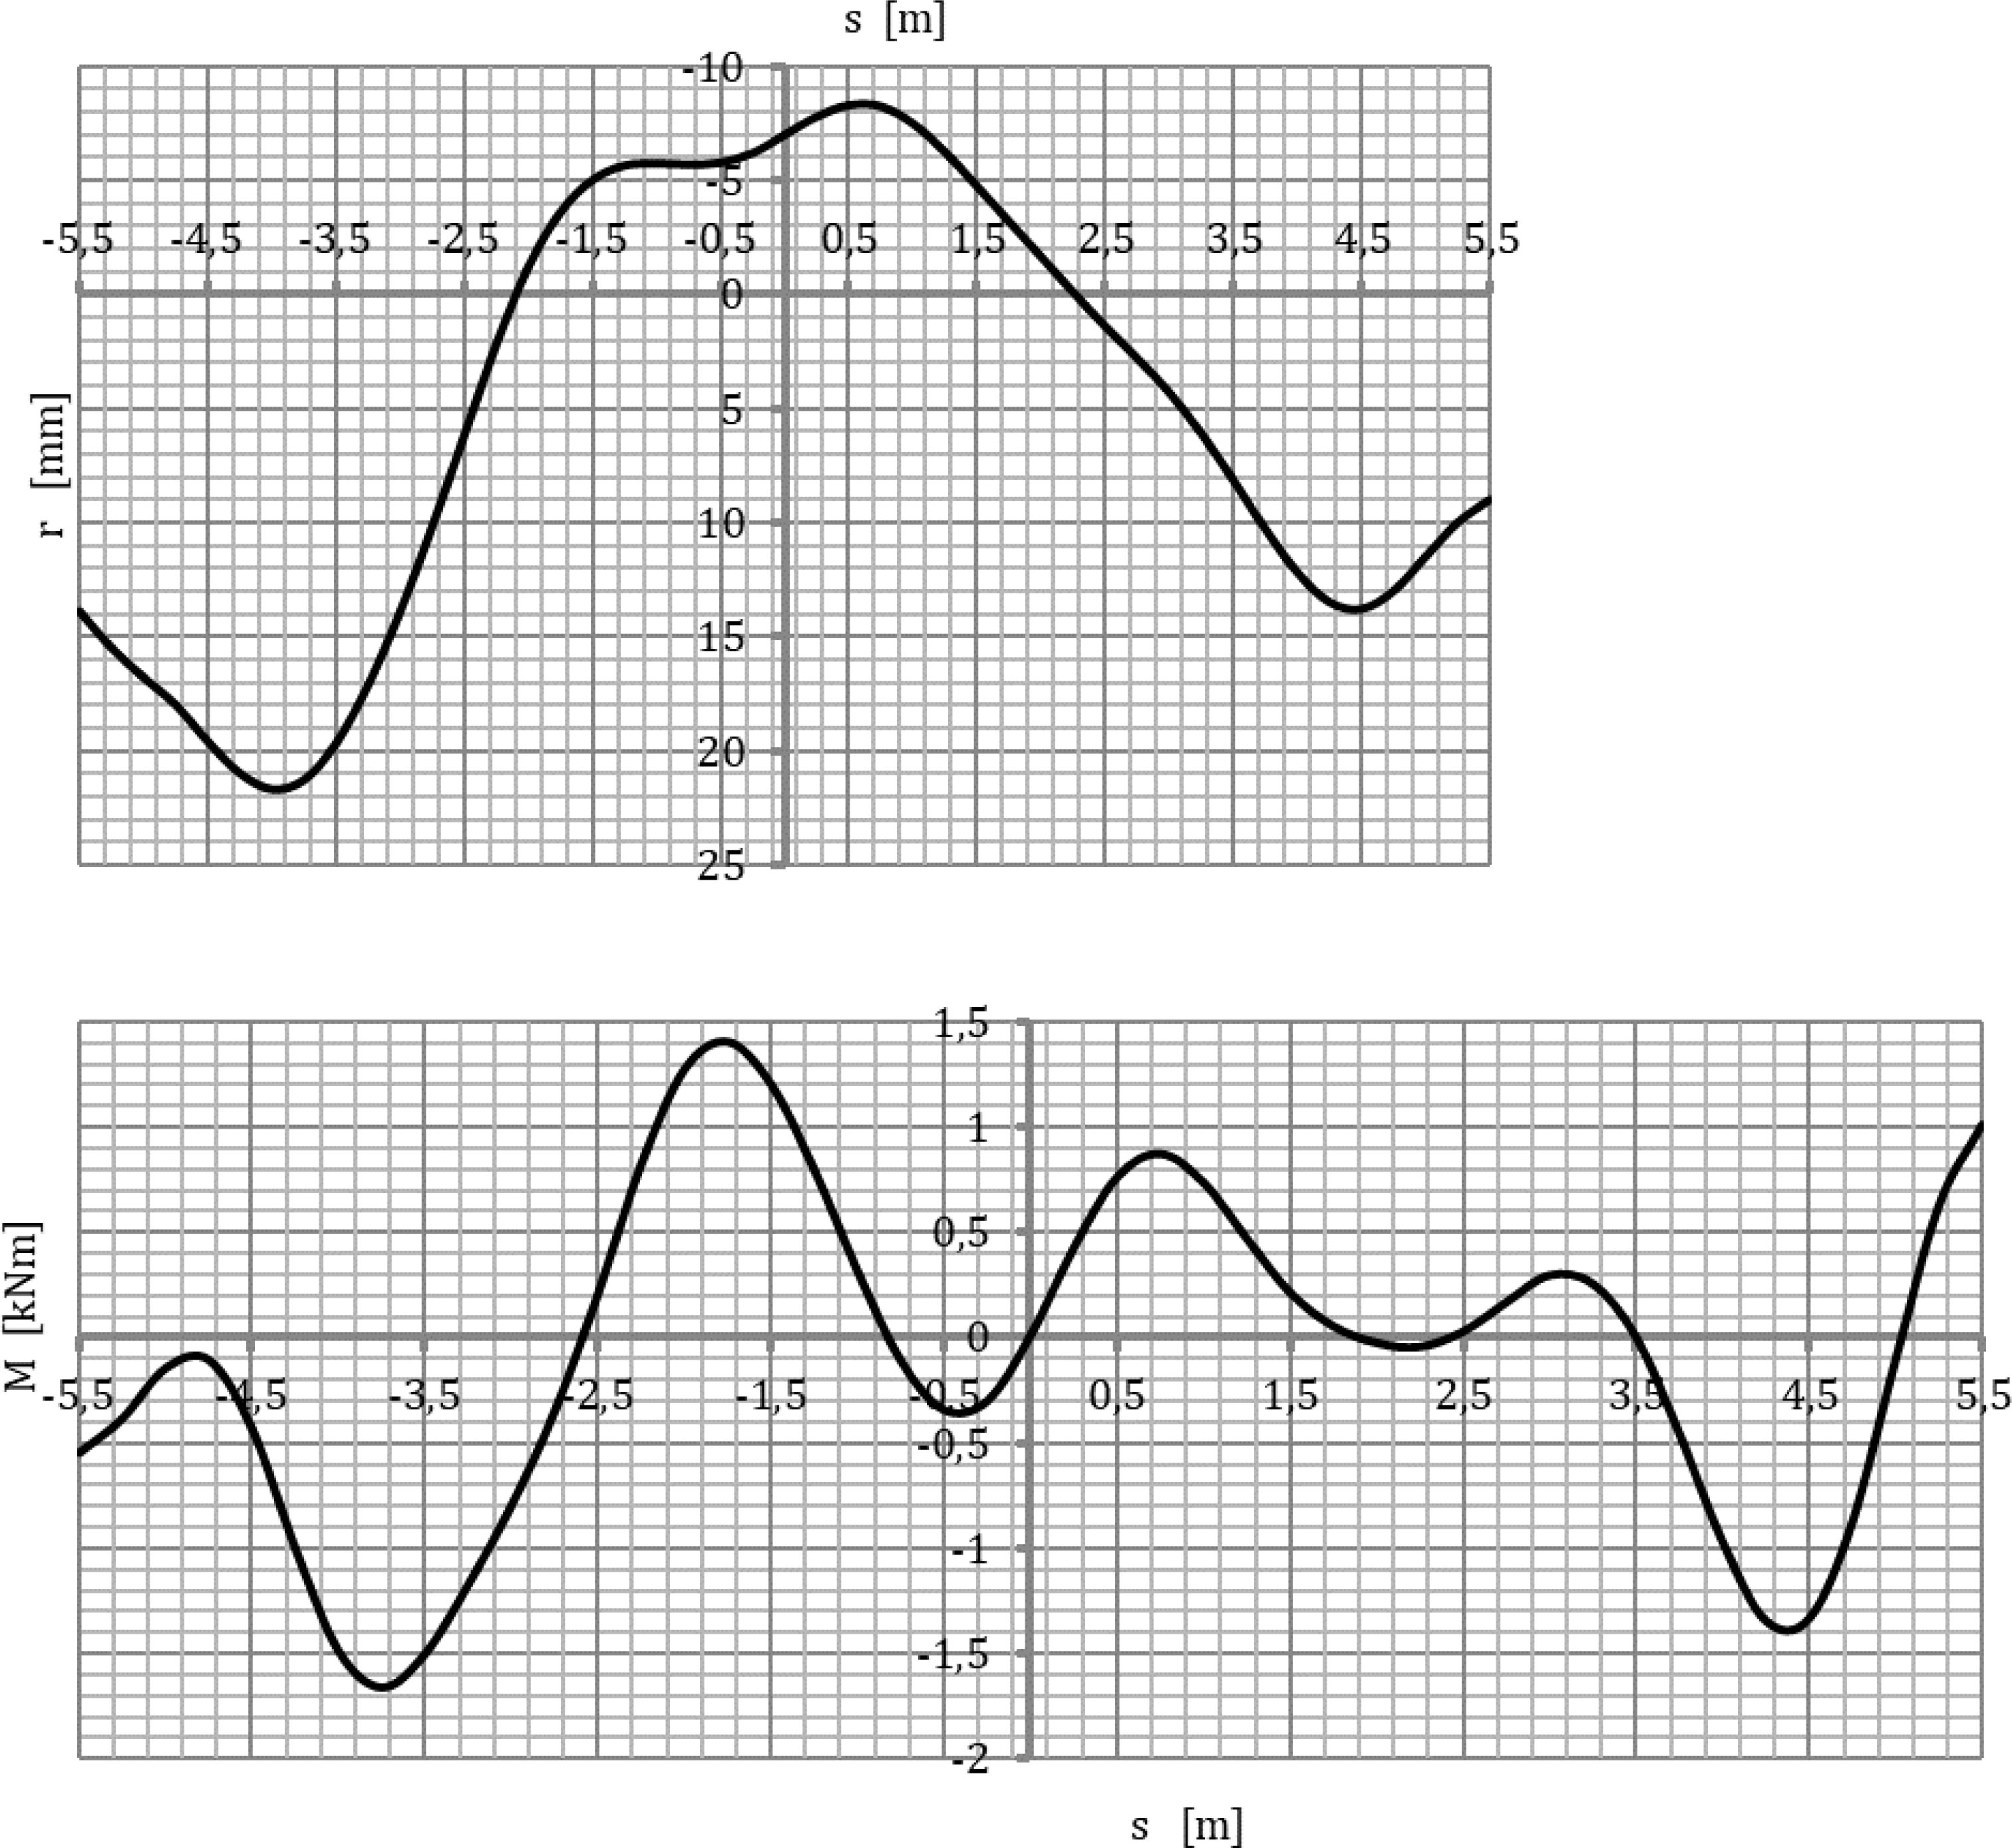
Figure 10
Diagram of the displacements and bending moments of the shell in the radial direction.
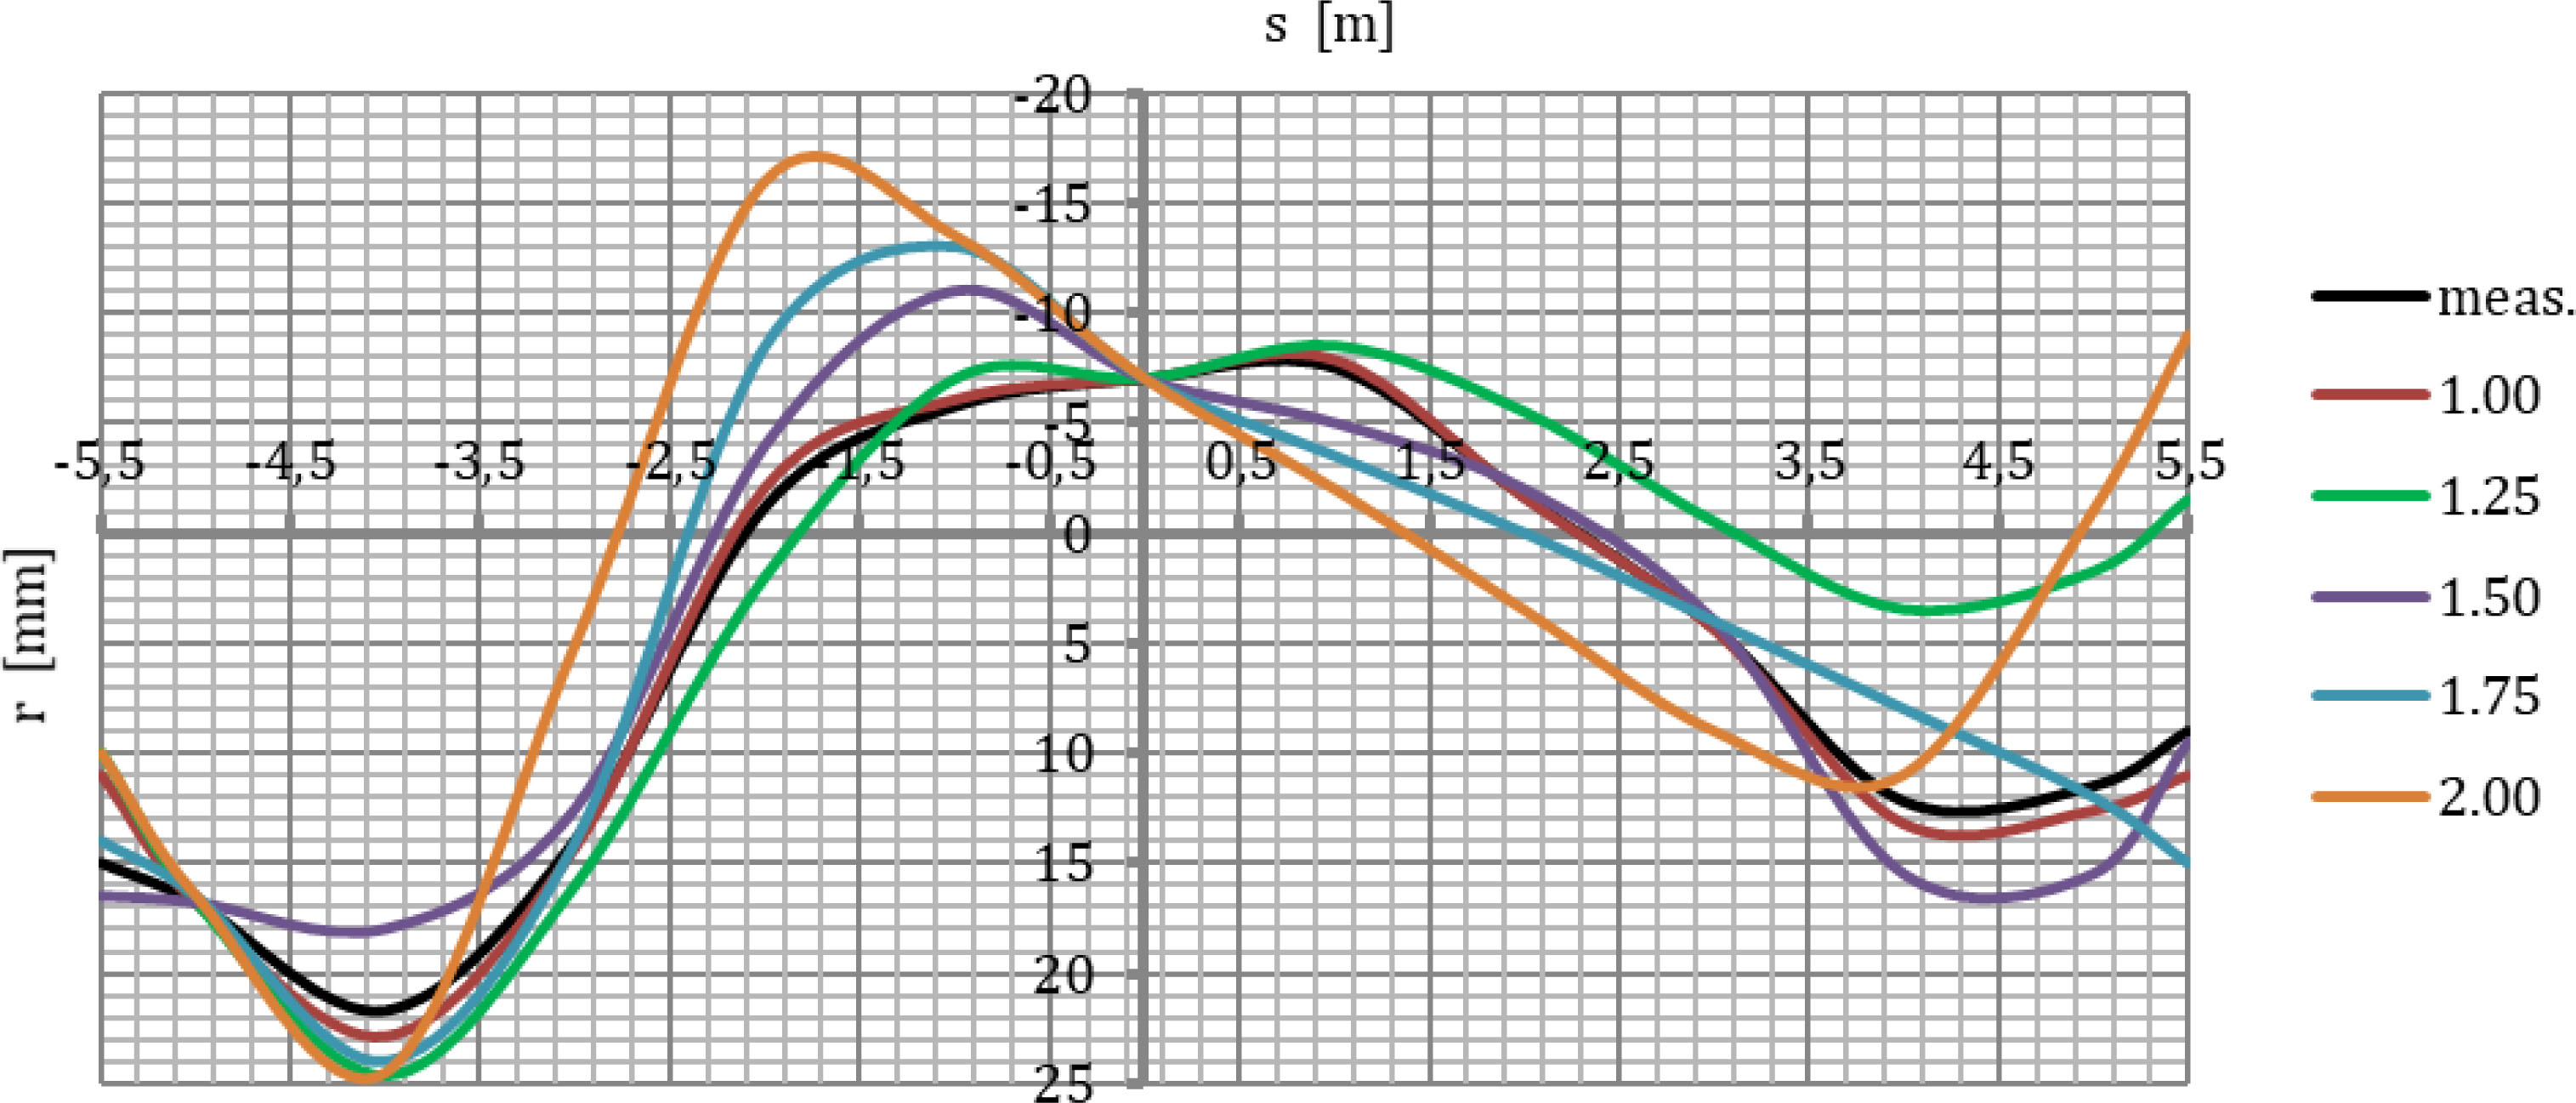
Figure 11
The diagram of displacements (curvature changes) in the circumferential bands of the shells.