
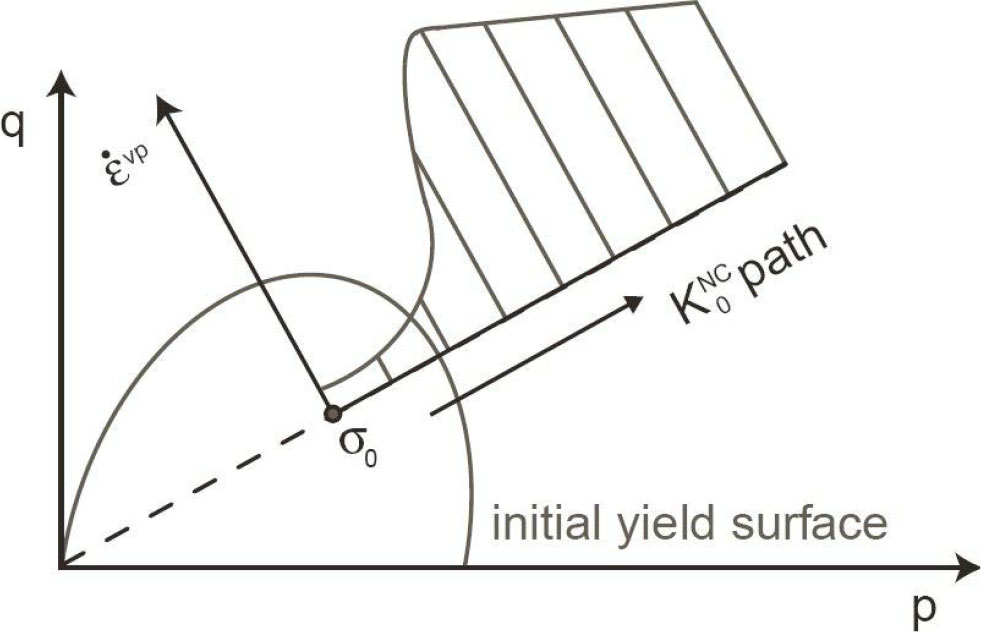
Figure 1
Influence of OCR on the creep rate in oedometric conditions.
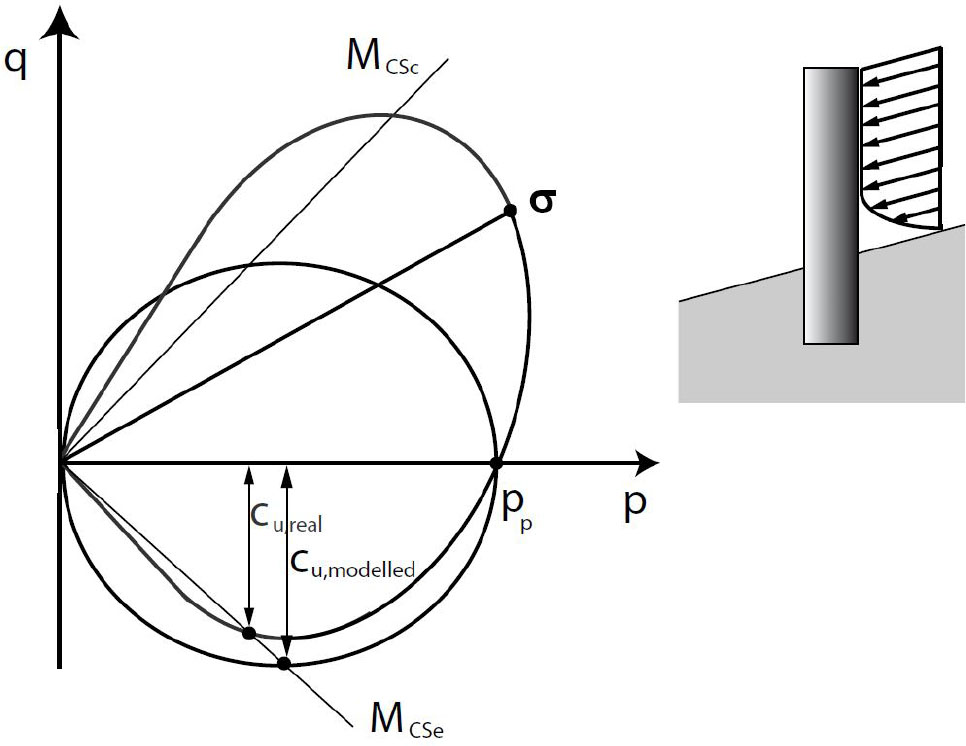
Figure 2
Undrained shear strength in triaxial extension resulting from the application of isotropic model and the real shear strength.
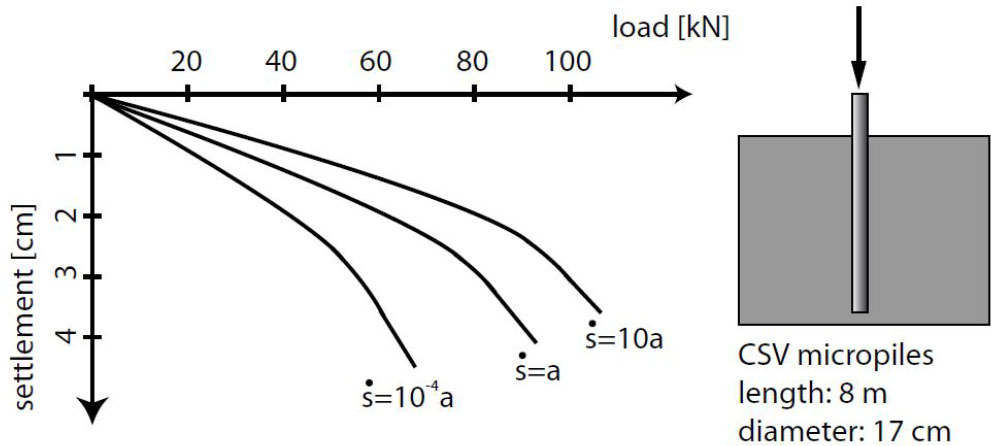
Figure 3
Results of displacement-controlled load tests on floating CSV (Combined Soil Stabilization with Vertical Columns) micropiles after Vermeer and Leoni [5]. is the penetration rate and a is its reference value.
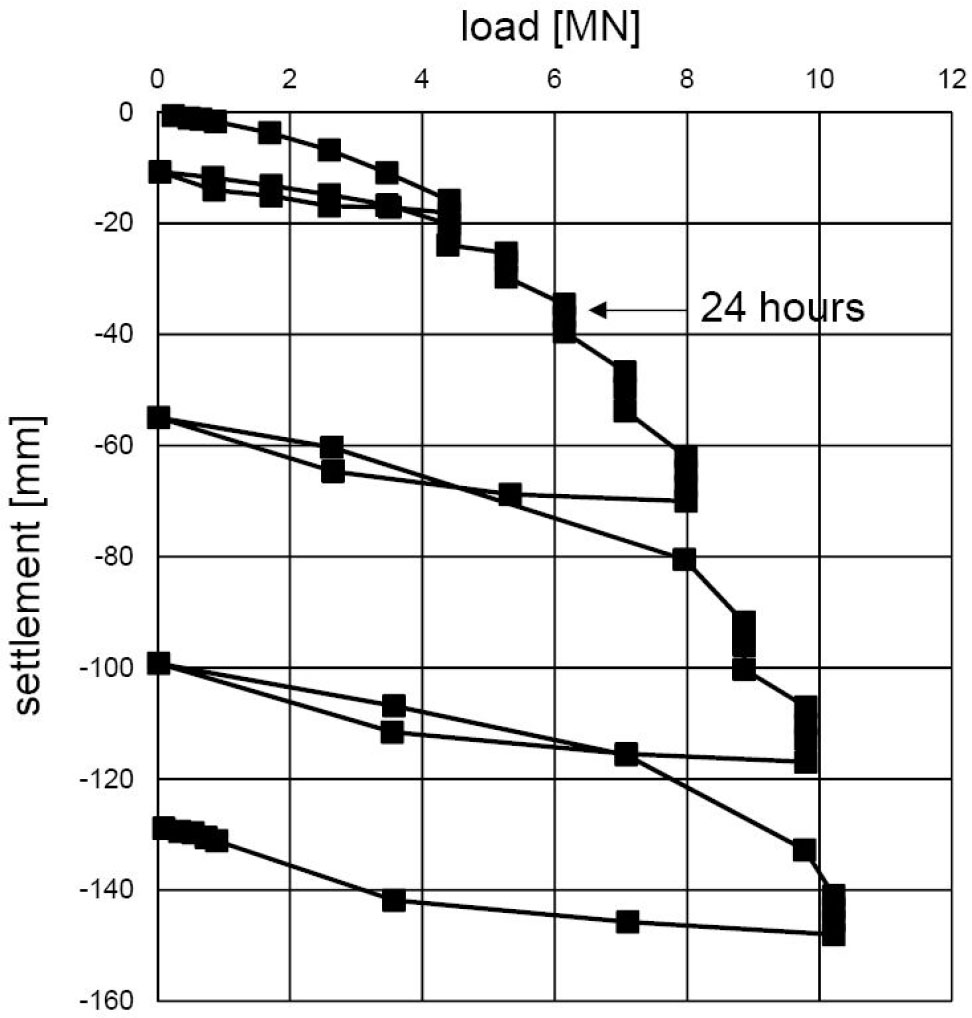
Figure 4
Results of the shallow foundation load test on dense sand after Briaud and Gibbens [8].
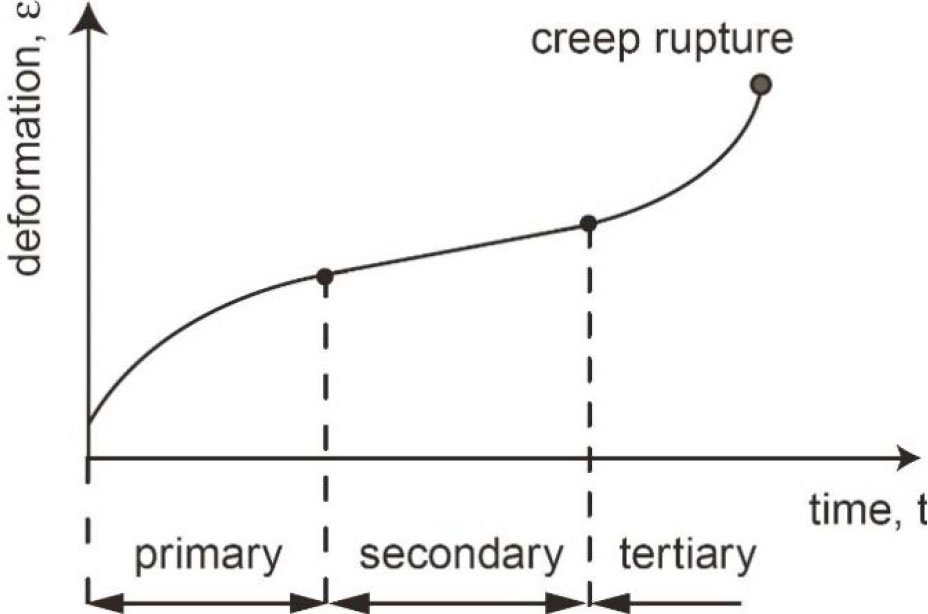
Figure 5
Creep stages based on the strain versus time curve.
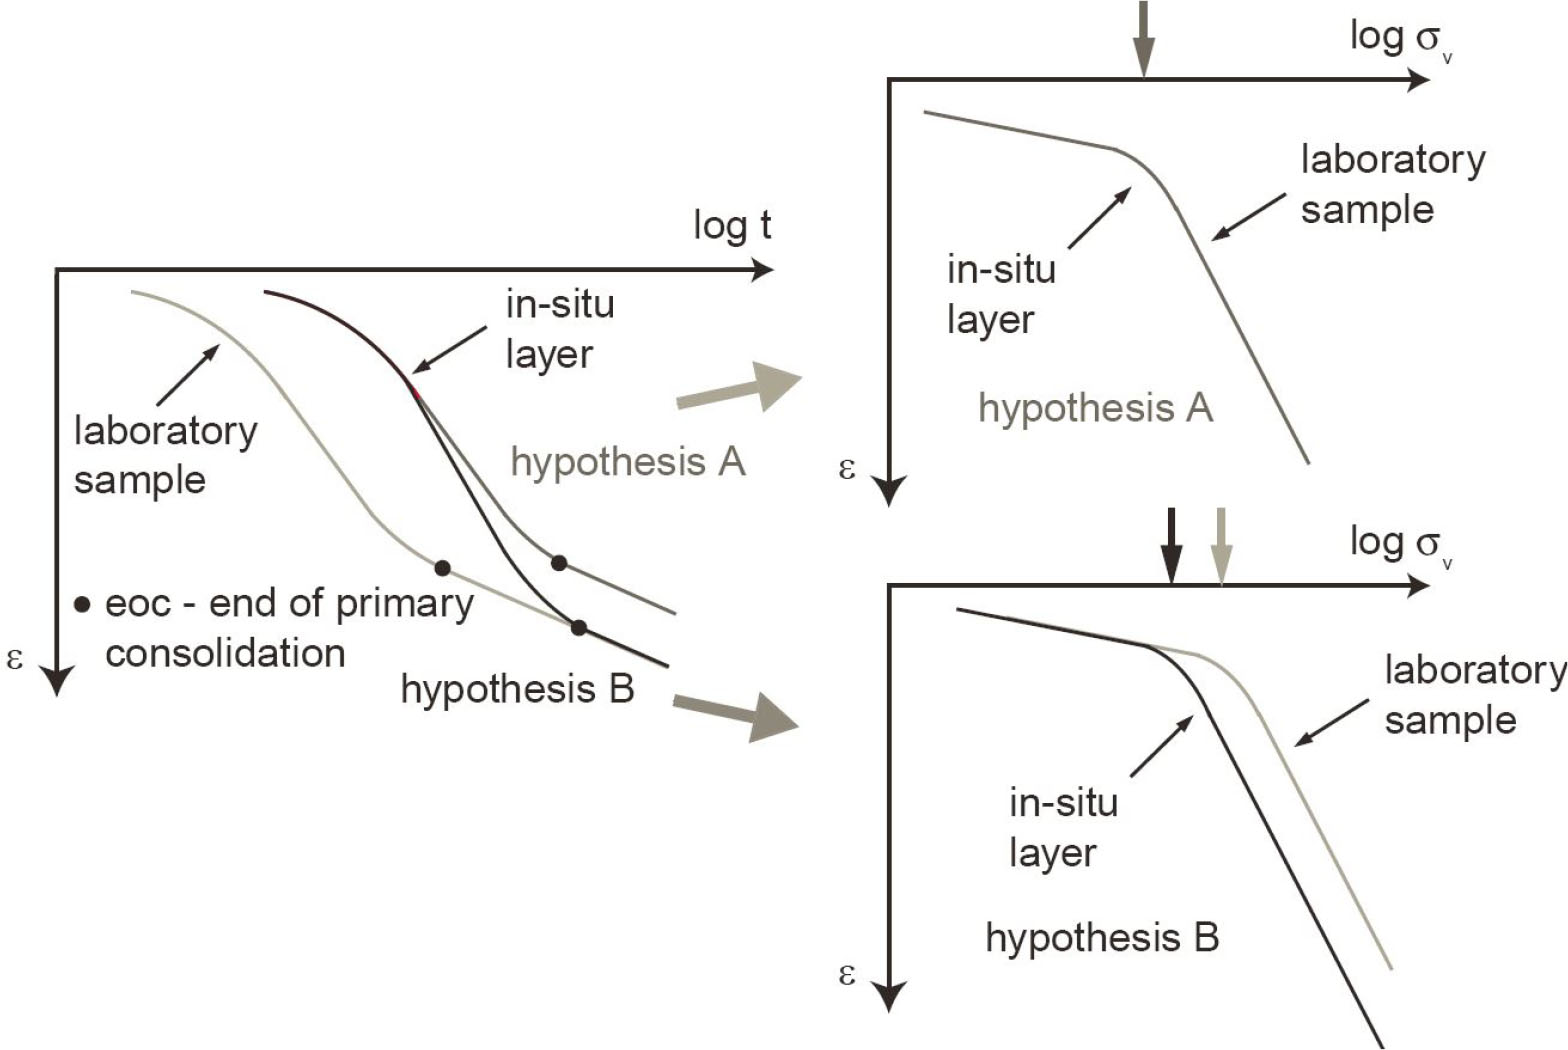
Figure 6
Creep during primary consolidation according to hypotheses A and B after Degago [10].
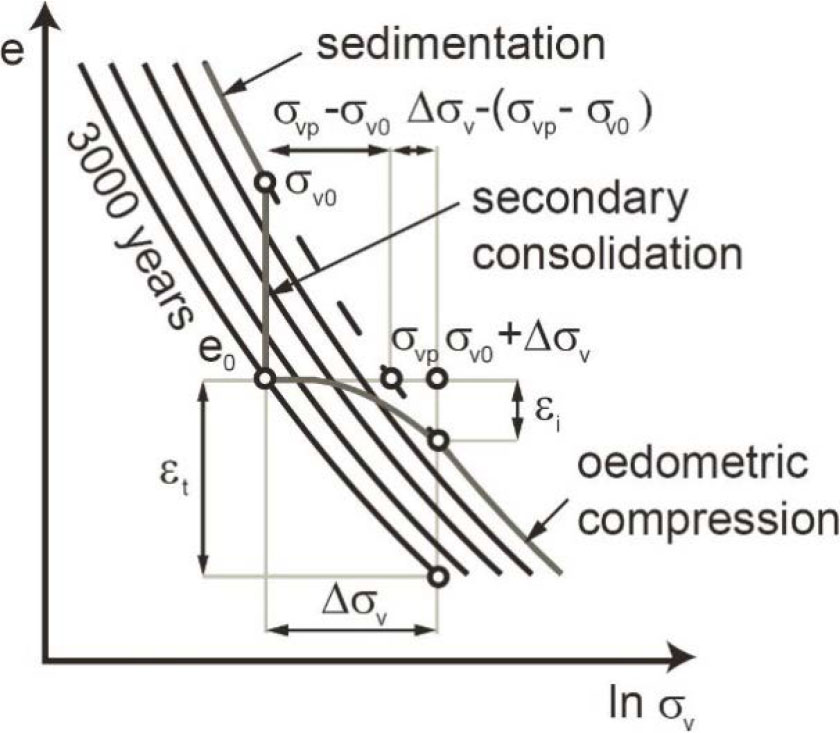
Figure 7
System of isochrones describing the compressibility characteristics of soft soils after Bjerrum [13].
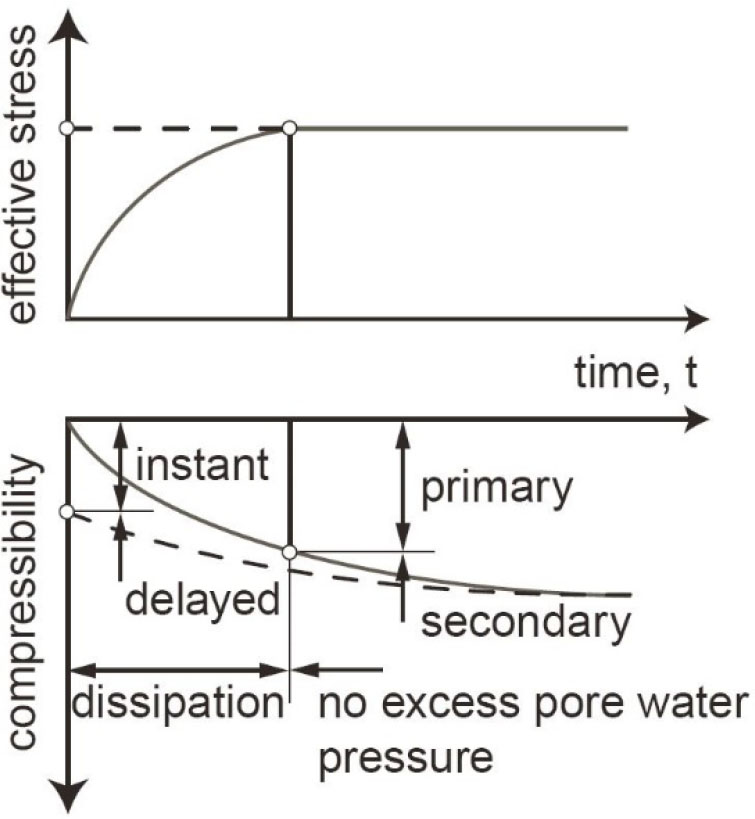
Figure 8
Instant and delayed deformations according to Bjerrum [13].
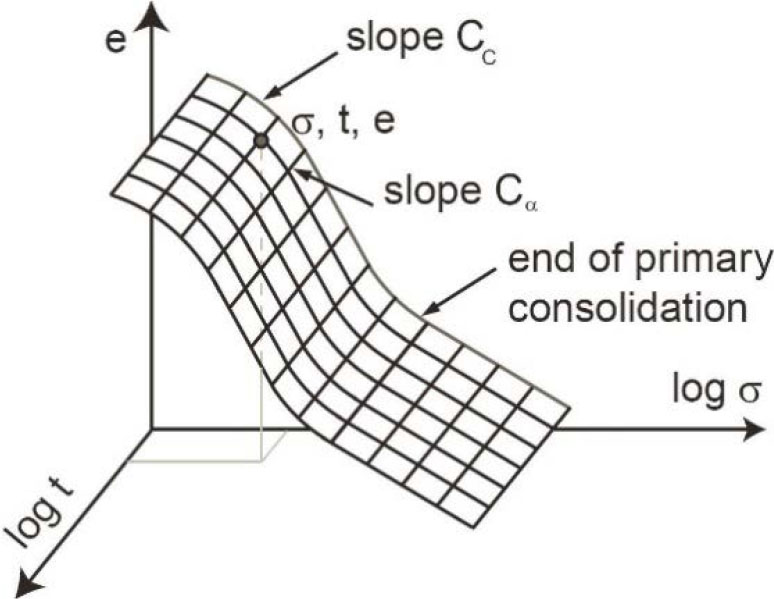
Figure 9
Time- and stress-compressibility interrelationship after Mesri and Godlewski [15].
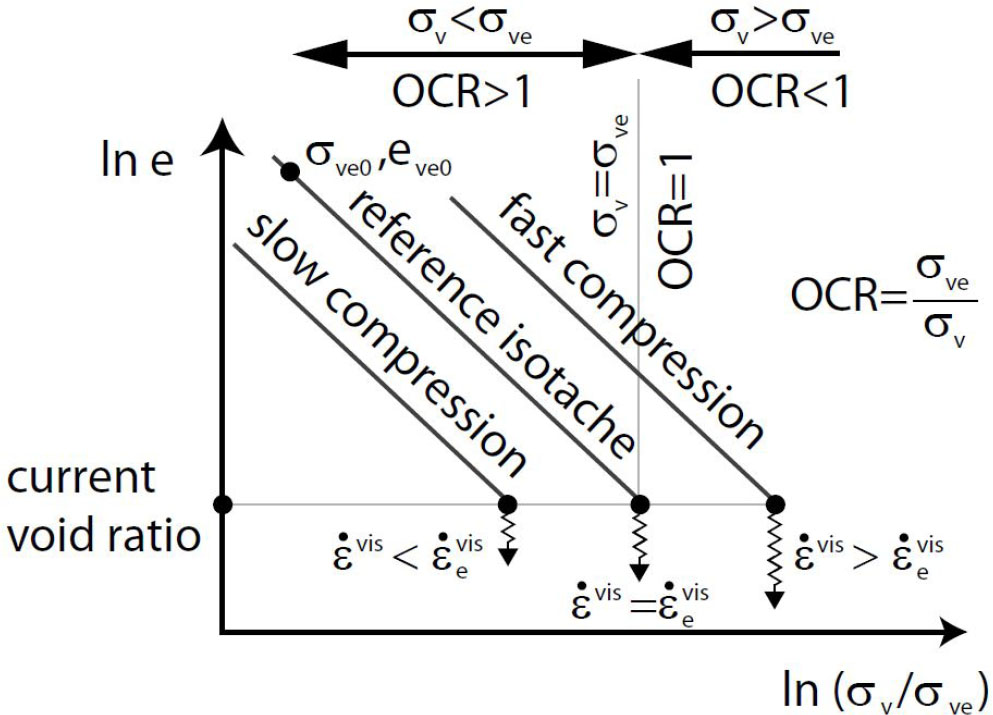
Figure 10
Isotaches concept.
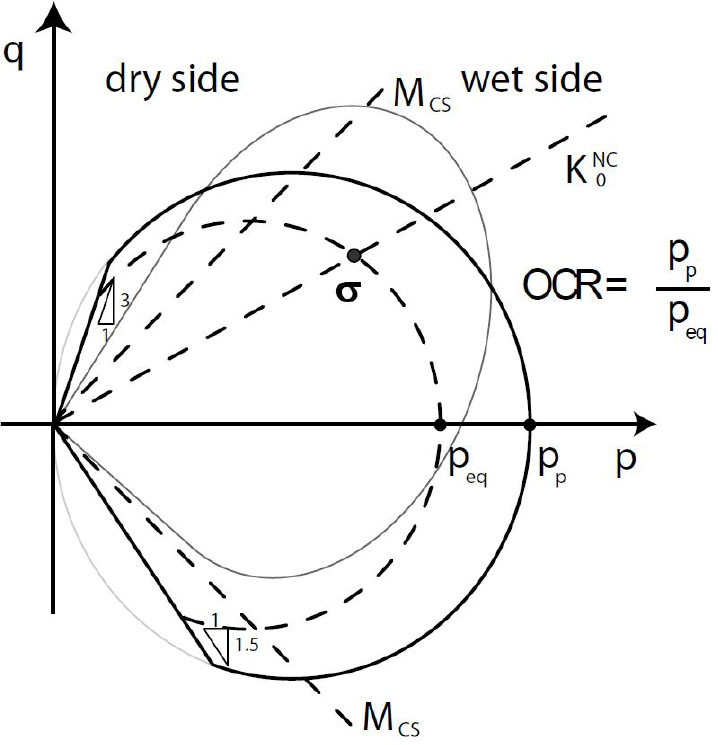
Figure 11
MCC model – the real yield surface known from high accuracy experiments, for example, [38, 43], is indicated with grey colour. MCS is the slope of the CSL [24].
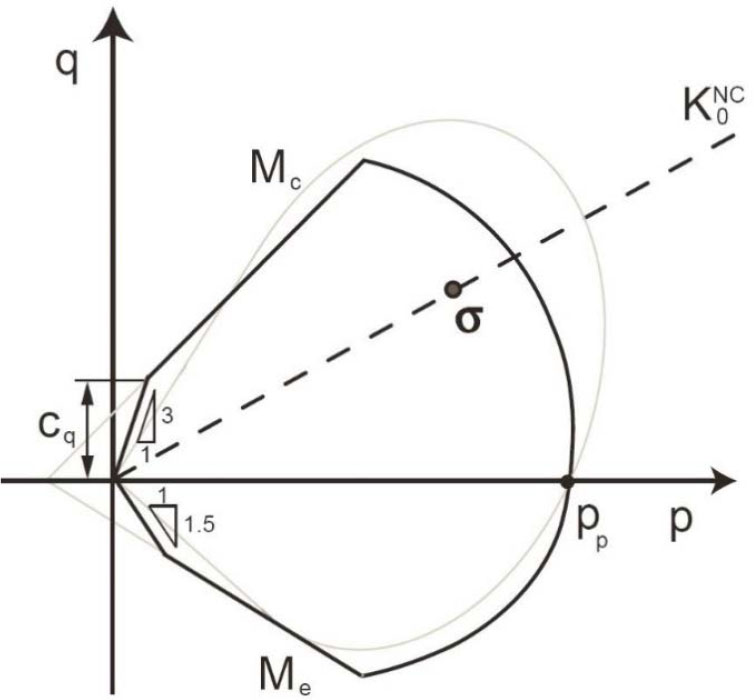
Figure 12
Cap models. Mc and Me are the slopes of M-C criterion in the case of triaxial compression and extension, respectively.
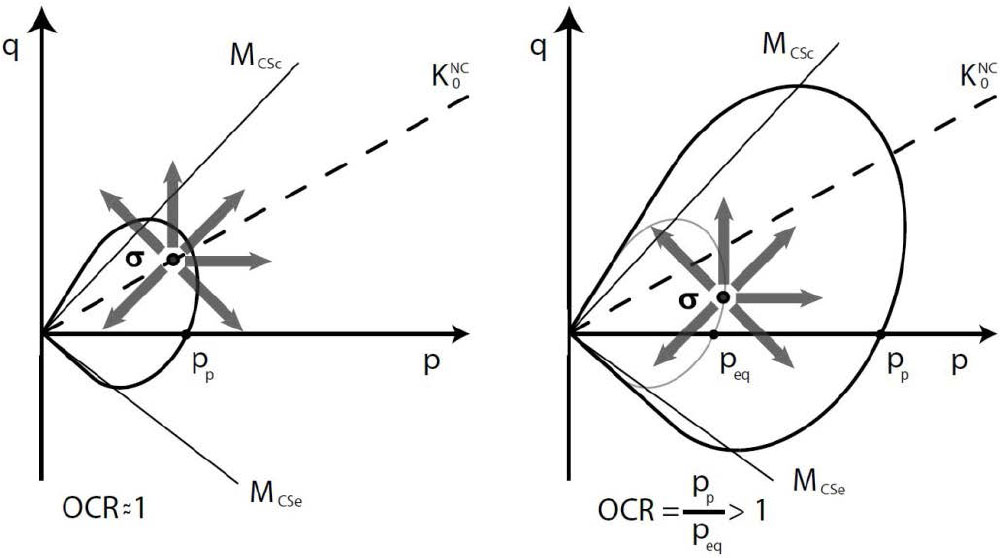
Figure 13
In situ stress state in NC (or slightly OC) and OC soil.
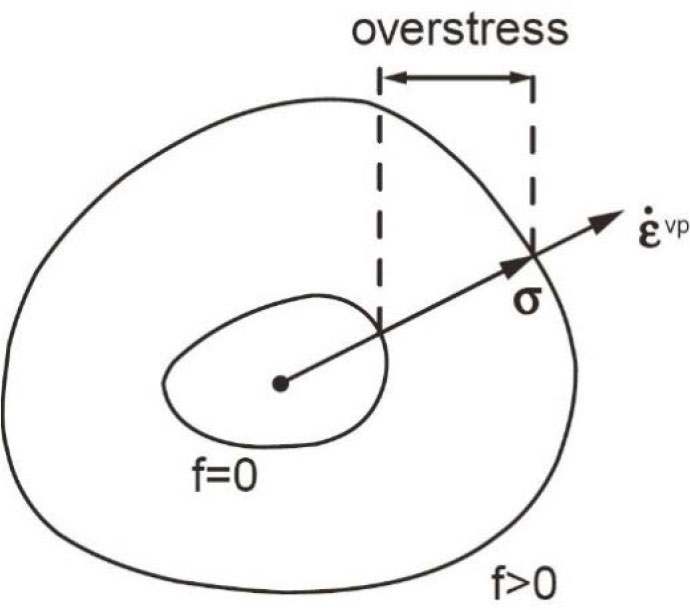
Figure 14
Overstress concept.
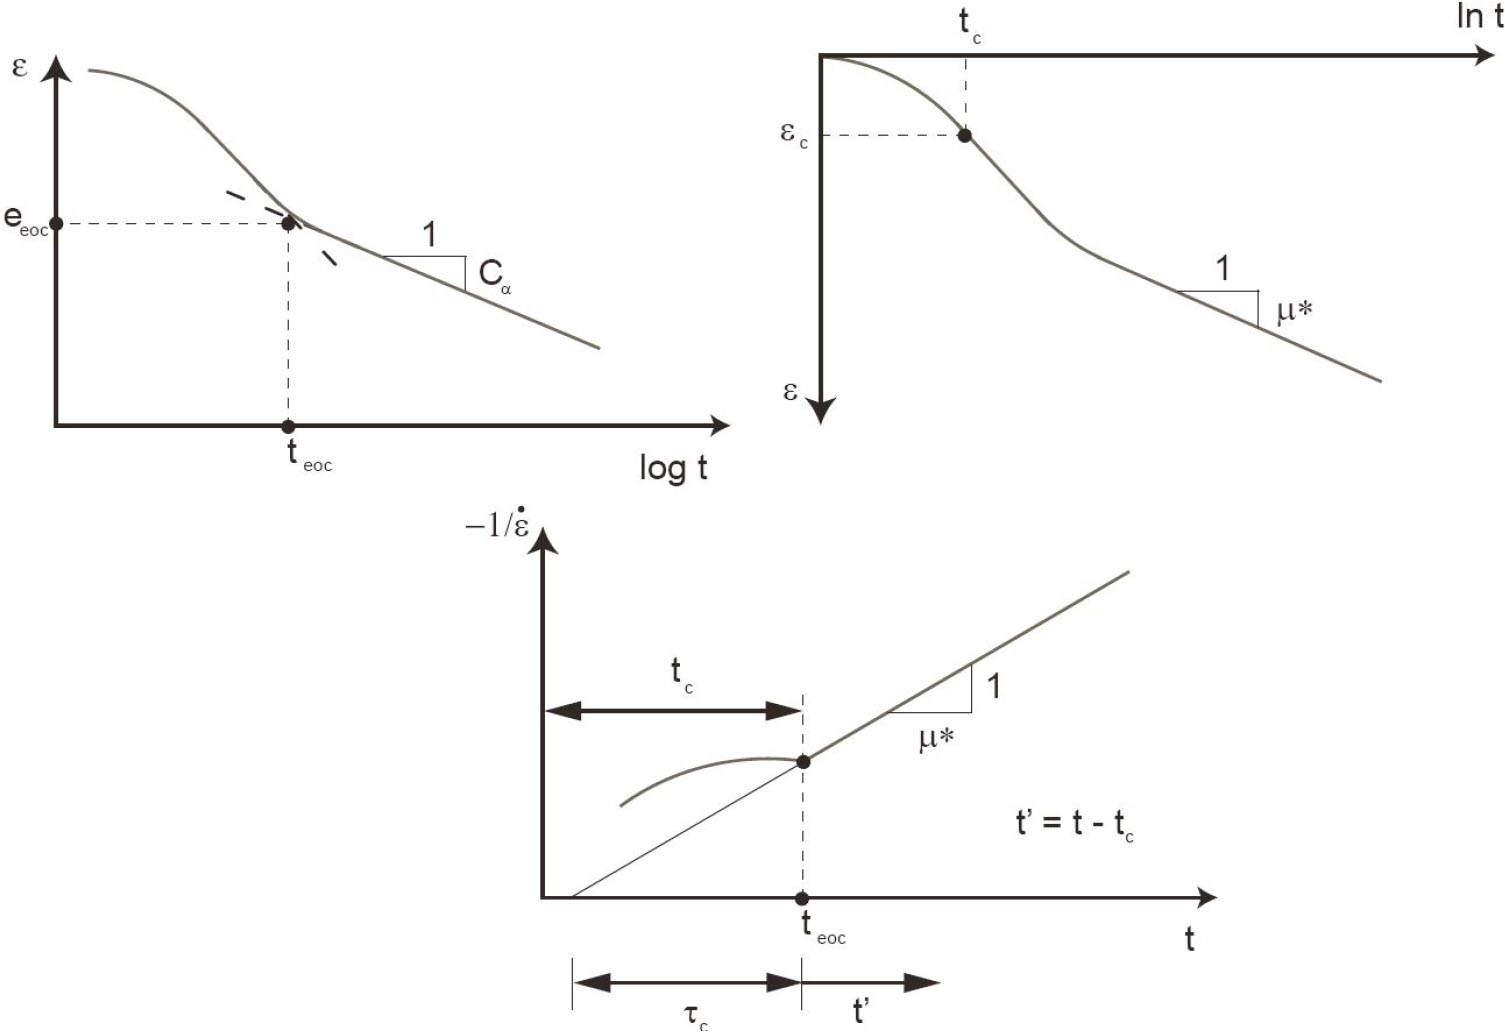
Figure 15
Determination of the creep index in oedometric conditions.
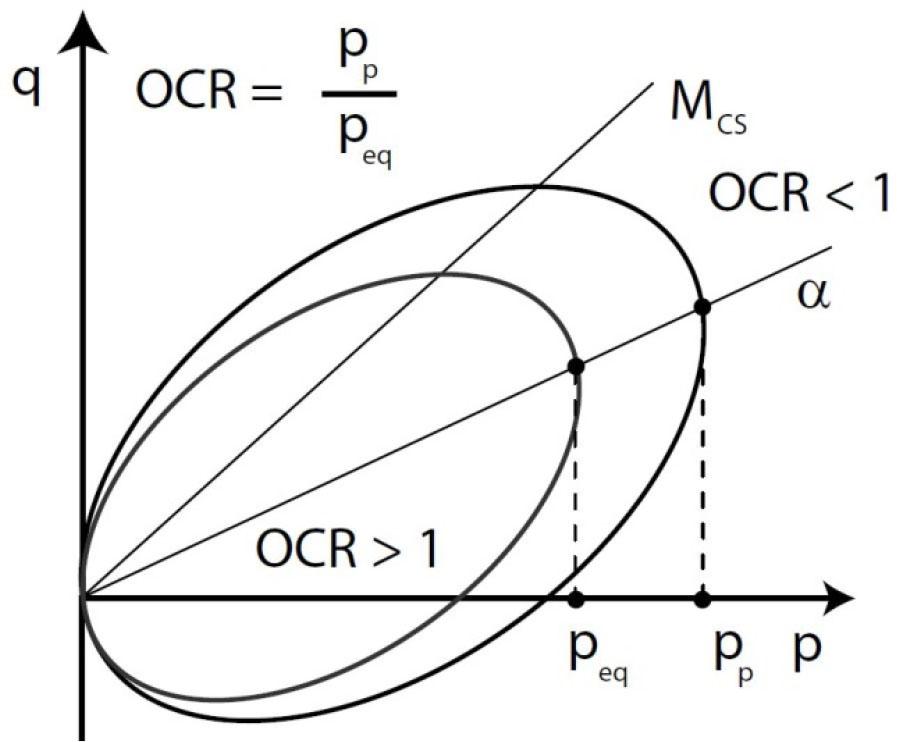
Figure 16
The Leoni model [39].
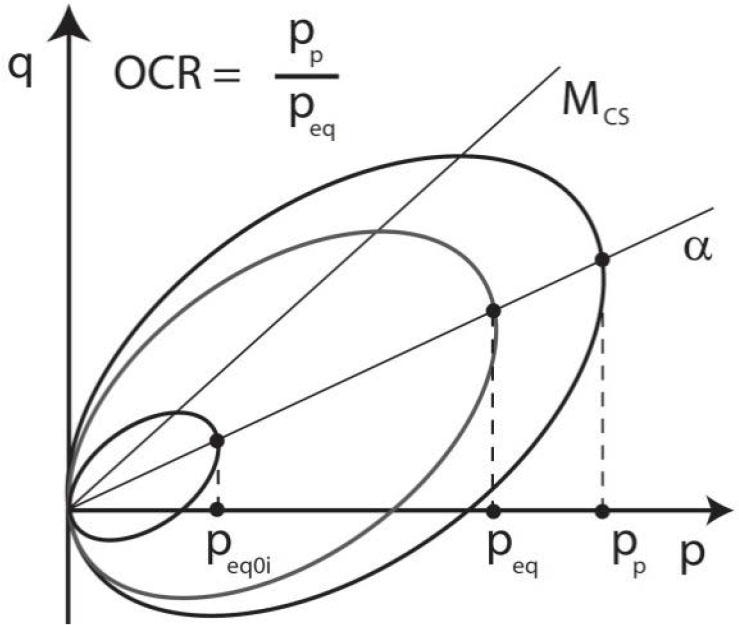
Figure 17
The Sivasithamparam et al.'s model [41].
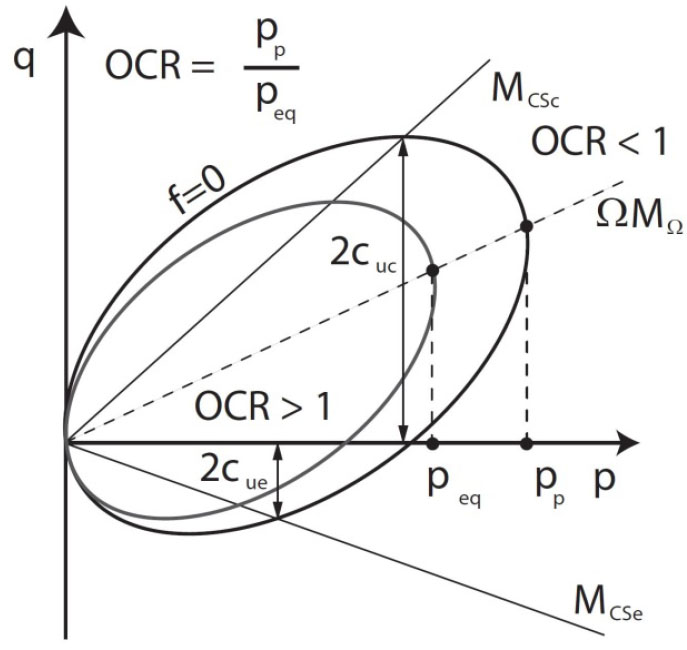
Figure 18
The Niemunis and Grandas-Tavera model [40]. MCSc and MCSe are the slopes of the CSL for triaxial compression and extension, respectively. MΩ denotes the slope of the CSL by the current Ω.