
Graph 1:

Graph 2:
Overview of the minimum wage in Slovenia by year (gross minimum wage in September from 2006 to 2024 inclusive) and factors that influenced the changes
| Year | Minimum Wage | Notes |
|---|---|---|
| 2006 | 538.53 | |
| 2007 | 566.53 | |
| 2008 | 589.19 | |
| 2009 | 597.43 | |
| 2010 | 734.25 | Minimum Wage Act adopted |
| 2011 | 748.10 | |
| 2012 | 763.06 | |
| 2013 | 783.66 | |
| 2014 | 789.15 | |
| 2015 | 790.73 | |
| 2016 | 790.73 | |
| 2017 | 804.96 | |
| 2018 | 842.79 | |
| 2019 | 886.63 | Preparation for legislative change |
| 2020 | 940.58 | Exclusion of supplements from the minimum wage |
| 2021 | 1024.24 | |
| 2022 | 1074.73 | High inflation |
| 2023 | 1203.36 | Significant growth due to price increase |
| 2024 | 1253.90 | Adjustment for inflation and costs |
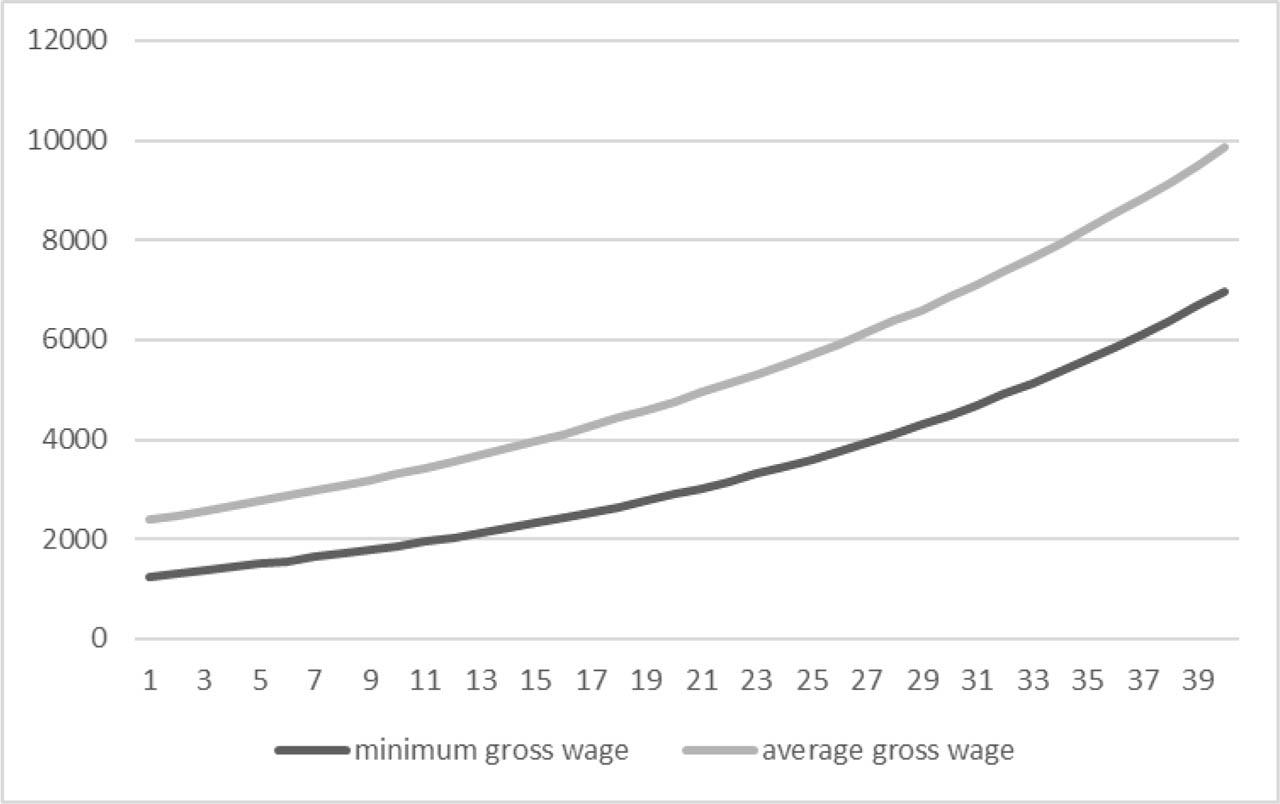
Comparison of the Minimum Wage, the Average Wage, and the Ratio between them
| Year | Minimum Gross Wage | Average Gross Wage | Average Net Wage | Ratio |
|---|---|---|---|---|
| 2006 | 538,53 | 1183 | 743 | 2,1967207 |
| 2007 | 566,53 | 1284 | 834 | 2,266429 |
| 2008 | 589,19 | 1391 | 894 | 2,3608683 |
| 2009 | 597,43 | 1440 | 933 | 2,4103242 |
| 2010 | 734,25 | 1494 | 973 | 2,0347293 |
| 2011 | 748,1 | 1524 | 990 | 2,0371608 |
| 2012 | 763,06 | 1525 | 991 | 1,9985322 |
| 2013 | 783,66 | 1523 | 1000 | 1,9434449 |
| 2014 | 789,15 | 1541 | 1008 | 1,952734 |
| 2015 | 790,73 | 1556 | 1010 | 1,9678019 |
| 2016 | 790,73 | 1584 | 1031 | 2,0032122 |
| 2017 | 804,96 | 1627 | 1061 | 2,0212184 |
| 2018 | 842,79 | 1682 | 1095 | 1,9957522 |
| 2019 | 886,63 | 1749 | 1133 | 1,972638 |
| 2020 | 940,58 | 1856 | 1212 | 1,9732505 |
| 2021 | 1024,24 | 1969 | 1277 | 1,922401 |
| 2022 | 1074,73 | 2023 | 1319 | 1,8823332 |
| 2023 | 1203,36 | 2221 | 1461 | 1,8456655 |
| 2024 | 1253,9 | 2389 | 1545 | 1,9052556 |