Figure 1:
Main findings of OLS and fixed effects
| (1) | (2) | |
|---|---|---|
| OLS | Fixed Effe~s | |
| Merchandise trade ~) | 0.0632 (0.0600) | 0.0746*** (0.0179) |
| Domestic credit to~o | −0.248*** (0.0232) | −0.0429** (0.0179) |
| Political Stabilit~ | −0.145** (0.0577) | 0.0725*** (0.0222) |
| lag_job_creation | 0.305*** (0.0343) | |
| Constant | 69.03*** (2.175) | 37.16*** (2.290) |
| Observations | 200 | 199 |
Variable Description
| No. | Variable | Description |
|---|---|---|
| 1 | Labor_force | Number of employed persons (in millions) in each country per year |
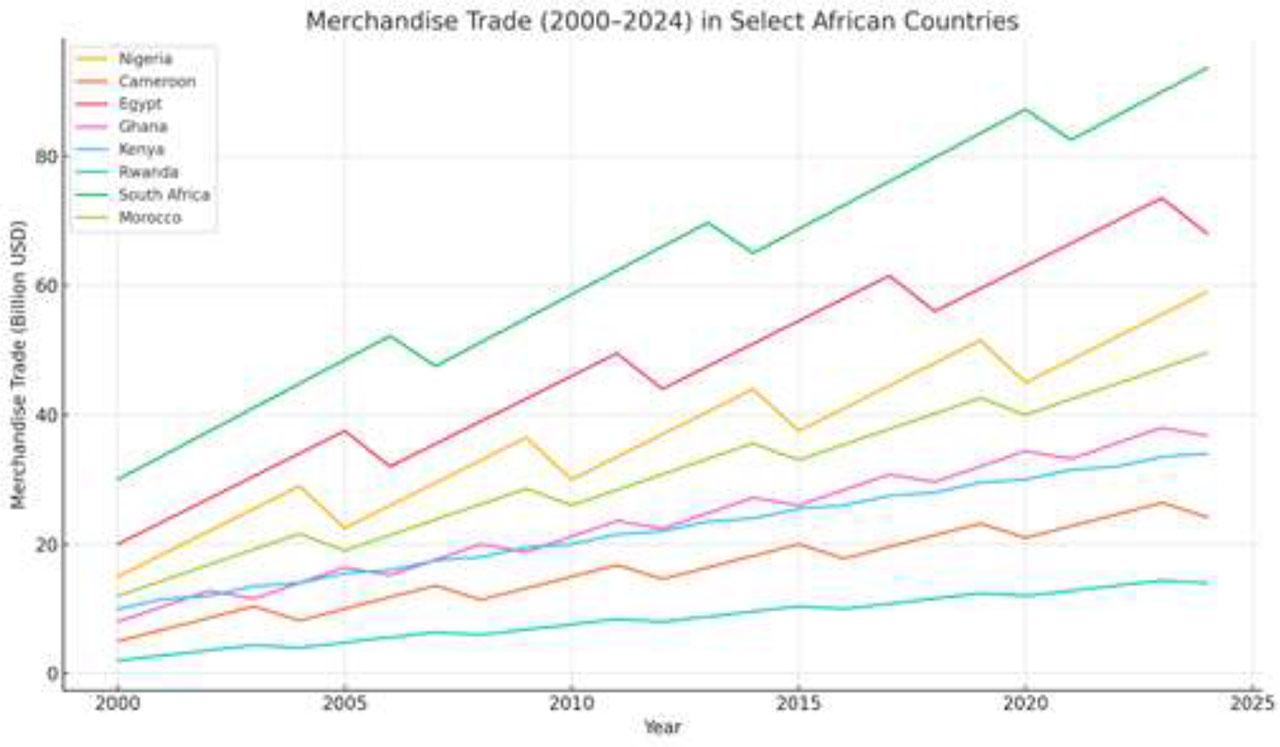
| 2 | Merch_trade | Sum of merchandise exports and imports as % of GDP |
| 3 | Credit_private | Domestic credit to private sector as % of GDP |
| 4 | Pol_Stability | Index measuring perceived likelihood of political instability and/or violence |
| 5 | GDP_pc_current | Real GDP per capita (constant 2015 US$) |
| 6 | Inflation | Annual percentage change in consumer prices |
| 7 | Job_creation | Proportion of working-age population engaged in the labor market |
| 8 | FDI | Foreign direct investment, net inflows (BoP, current US$) |
Descriptive statistics of the regression
| Variable | Obs | Mean | Std. dev. | Min | Max |
|---|---|---|---|---|---|
| job_creation | 200 | 58.30141 | 14.15568 | 36.798 | 80.282 |
| merch_trade | 200 | 40.12748 | 14.95618 | 12.71246 | 93.19966 |
| credit_pri~e | 200 | 38.12144 | 36.13675 | 7.248348 | 142.422 |
| pol_Stabil~y | 200 | 26.26943 | 15.1236 | 2.415459 | 52.83019 |