
Table 1:
Chemical composition of raw material
| Chemical composition % | Fire loss | SiO2 | Fe2O3 | Al2O3 | CaO | MgO | SO3 | K2O | Na2O | P2O5 | Ti |
|---|---|---|---|---|---|---|---|---|---|---|---|
| Bentonite | 14.16 | 55.94 | 3.14 | 13.57 | 5.91 | 1.74 | 0.41 | 2.19 | 2.47 | 0.15 | 0.33 |
| Glass waste | 2.67 | 70.26 | 0.99 | 0.44 | 11.79 | 1.68 | 0.21 | 0.52 | 11.43 | 0.01 | 0.02 |
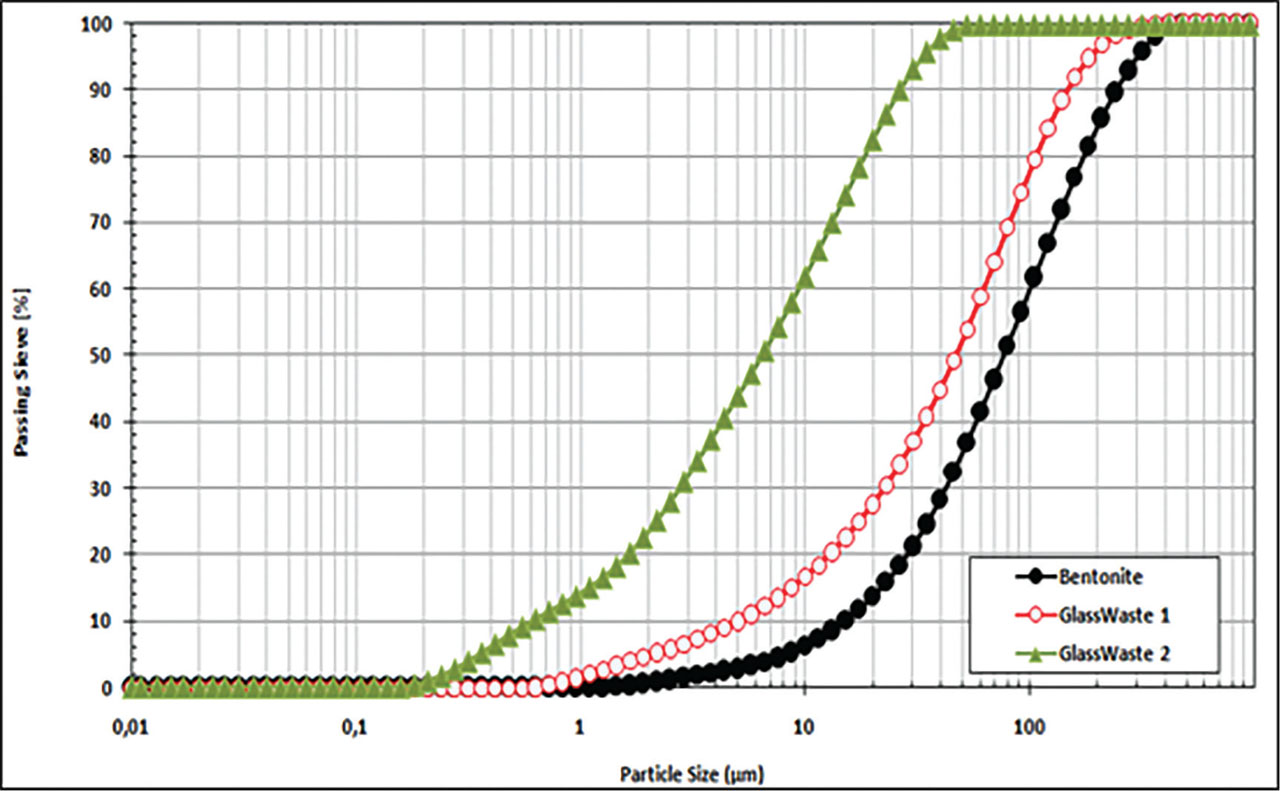
Figure 1:
Granulometric distribution of used materials (bentonite, Glass Waste 1 and Glass Waste 2).
Table 2:
Maximum diameter of raw material
| Diameter Max (μm) | D (0.1) | D (0.5) | D (0.9) |
|---|---|---|---|
| Bentonite | 17.2 | 84.454 | 278.142 |
| Glass Waste 1 | 0.536 | 3.919 | 142.64 |
| Glass Waste 2 | 5.735 | 53.713 | 168.7 |
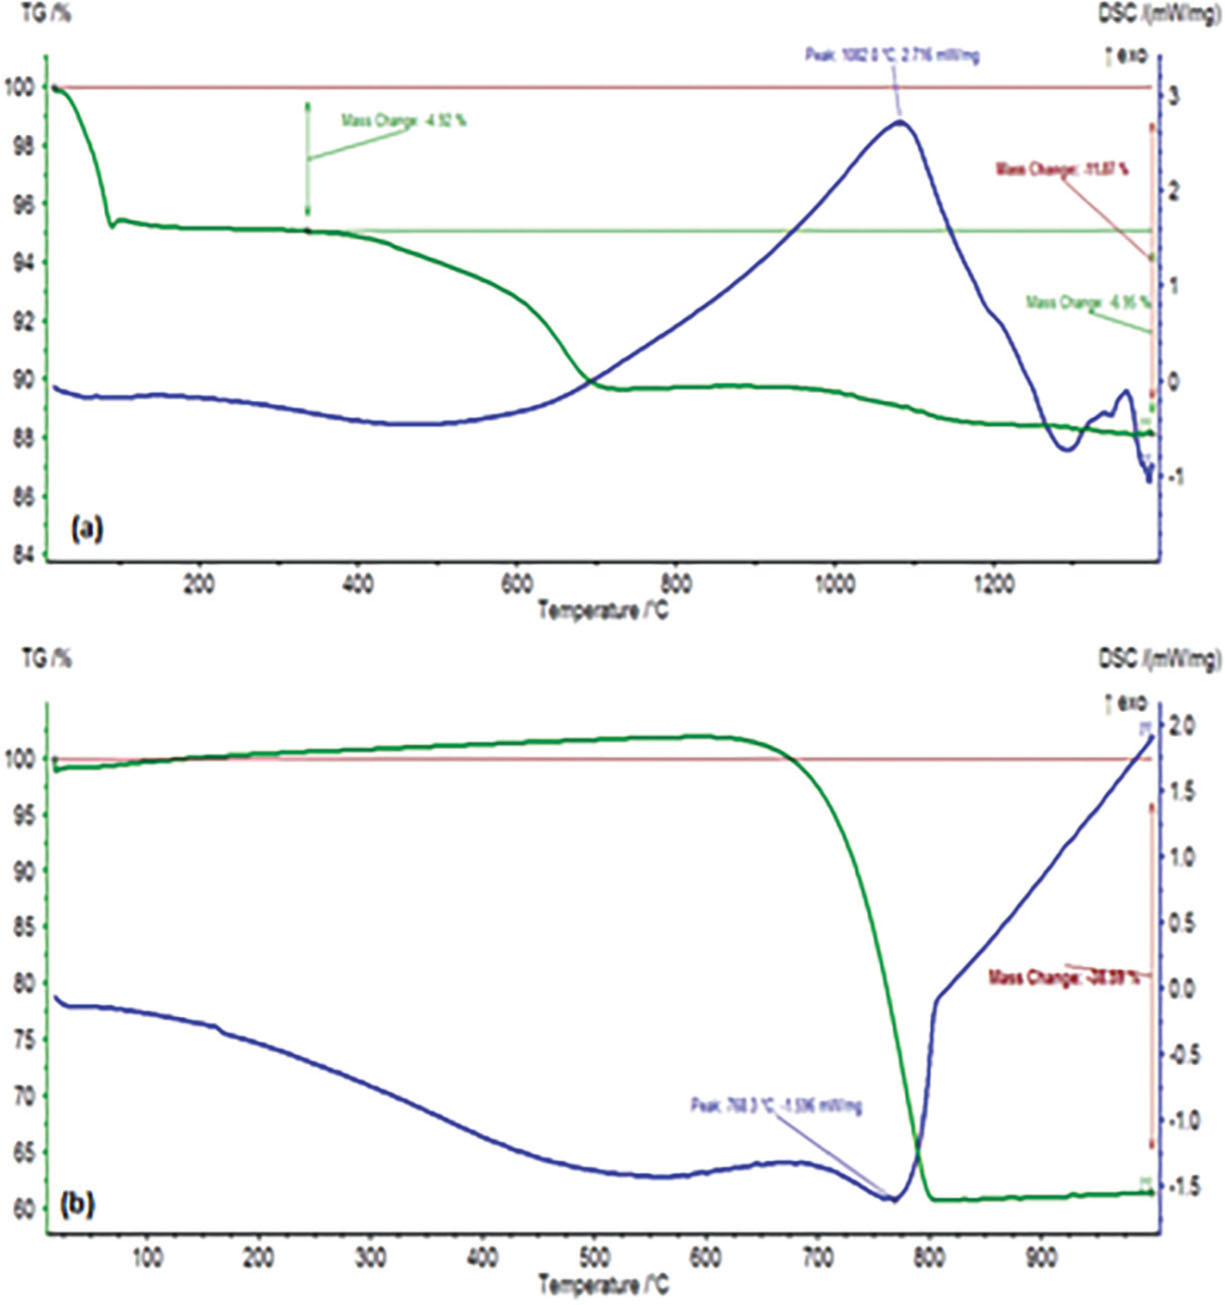
Figure 2:
Thermogravimetric Analysis and Differential Scanning Calorimetry Curves of raw materials (Bentonite and Glass Wastes).
Table 3:
Initial parameters of the prepared ceramic tiles.
| Symbol | Glass waste Type | Glass waste (% by Mass) | Bentonite (% by Mass) | Shaping Humidity (% by Mass) |
|---|---|---|---|---|
| GB30 | 1 | 70 | 30 | 6 |
| GB35 | 1 | 65 | 35 | 6 |
| GB40 | 1 | 60 | 40 | 6 |
| G′B30 | 2 | 70 | 30 | 6 |
| G′B35 | 2 | 65 | 35 | 6 |
| G′B40 | 2 | 60 | 40 | 6 |
| B100 | - | 00 | 100 | 8 |
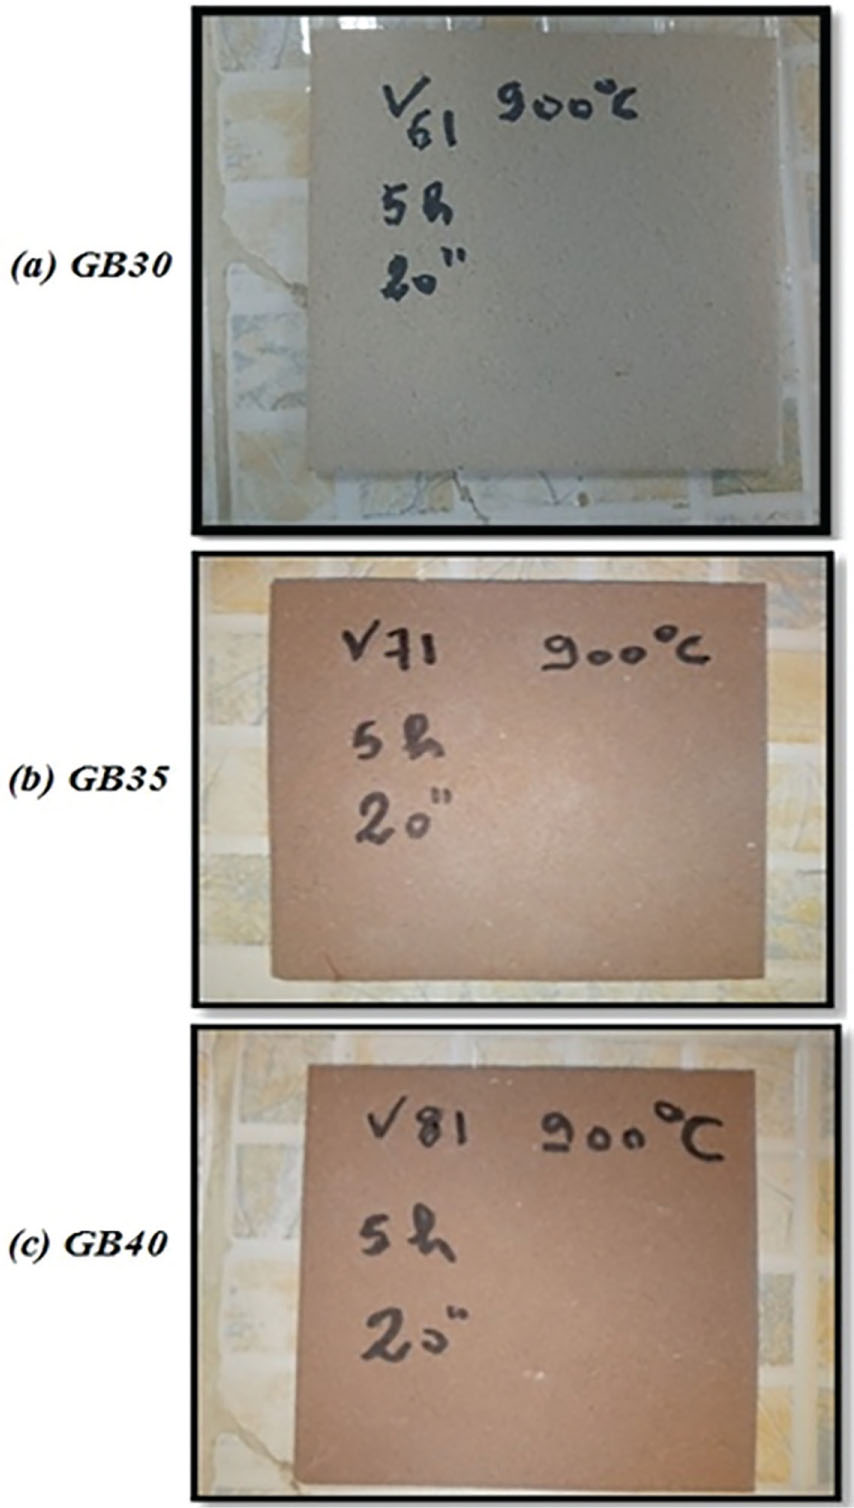
Figure 3:
Ceramic tiles obtained from 30% (a), 35% (b) and 40% (c) of bentonite content with Glass Waste 1 (GW1).
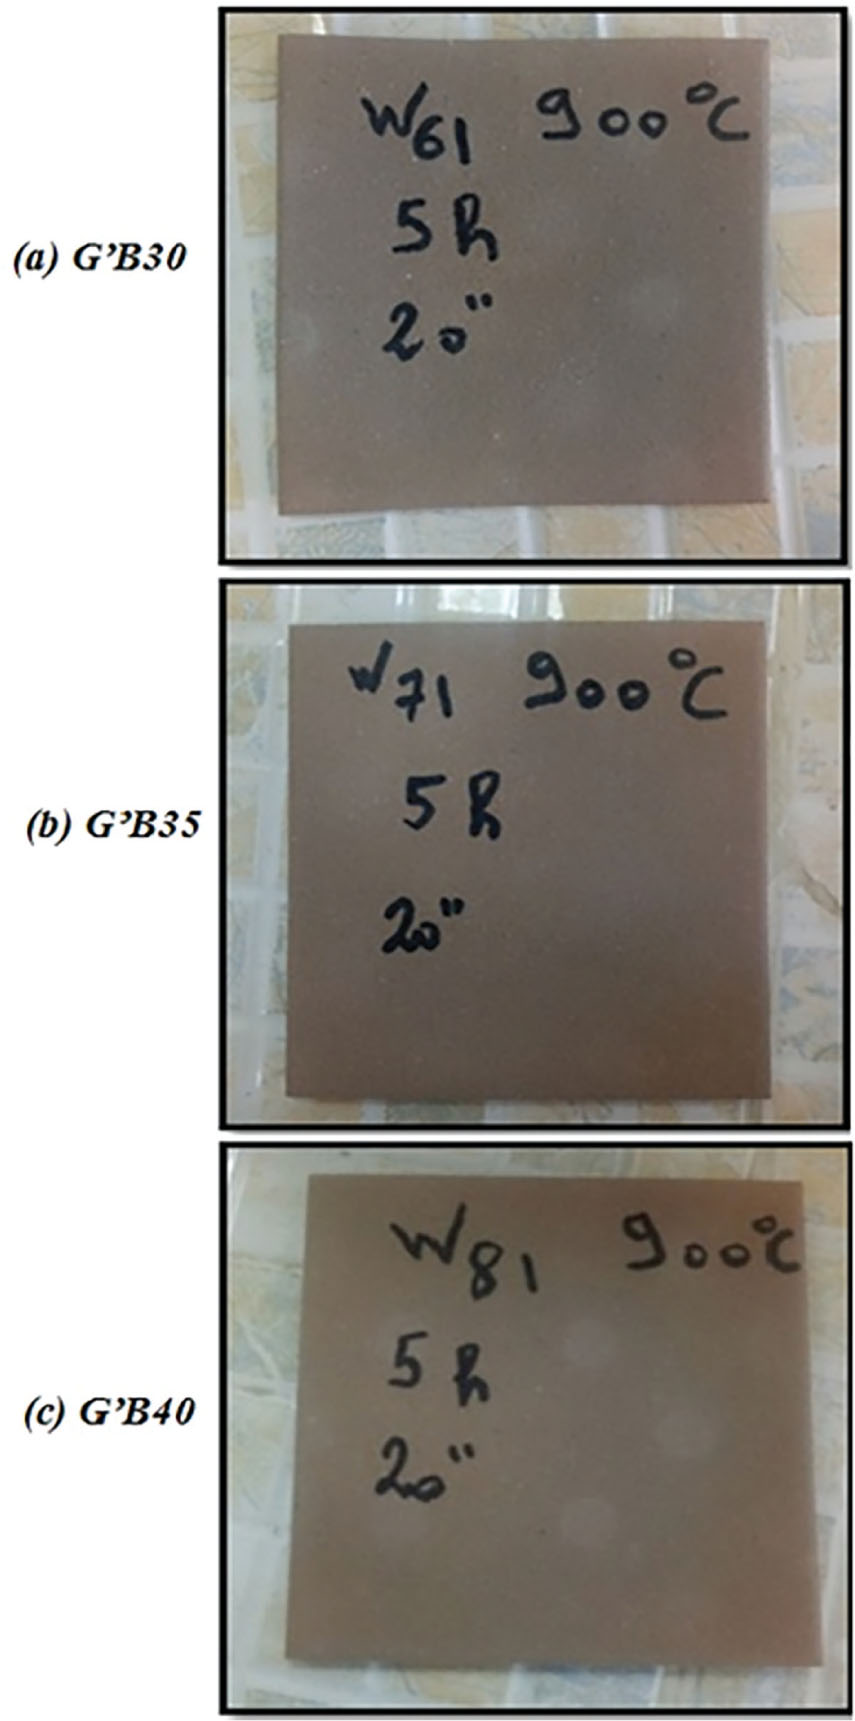
Figure 4:
Ceramic tiles obtained from 30% (a), 35% (b) and 40% (c) of bentonite content with Glass Waste 2 (GW2).
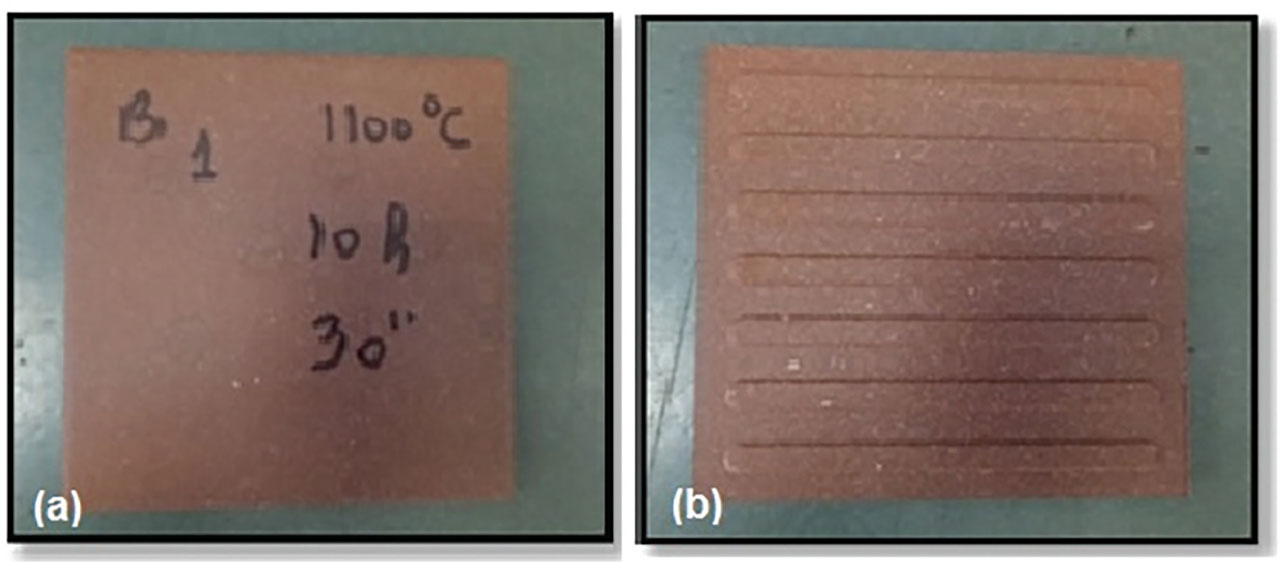
Figure 5:
Ceramic tile samples at 100% bentonite (B) content at 1100 °C: (a) Face 1 and (b) Face 2.
Table 4:
Properties of ceramic tile samples – Glass Waste 1 and bentonite (GB).
| Proprieties/tiles | GB30 | GB35 | GB40 | B100 |
|---|---|---|---|---|
| Humidity (%) | 6.83582 | 6.89445 | 6.57 | 11.7428 |
| Shrinking (%) | 3.916 | −7.182 | −5.8492 | −4.78 |
| Mass loss (%) | 15.417 | 4.475 | 4.78 | 8.4946 |
| Density (g/cm3) | 1.542 | 2.078 | 2.02 | 2.04 |
| Mass specific (g/cm3) | 2.33278 | 2.2003 | 2.3371 | 2.34 |
| Absorption (%) | 22.182 | 2.6598 | 6.57 | 6.18 |
| Porosity (%) | 33.904 | 5.525 | 13.3 | 12.62 |
| Resistance flexion (MPa) | 19.2444 | 32.6762 | 24.6616 | 14.2101 |
| Breaking strength (N) | 714 | 729 | 1062 | 500 |
| Hardness (HV) | 90 | 188 | 153 | 208 |
Table 5:
Properties of ceramic tile samples - Glass Waste 2 and bentonite (G’B)
| Properties/tiles | G’B30 | G’B35 | G’B40 | B100 |
|---|---|---|---|---|
| Humidity (%) | 6.1809 | 5.79 | 7.4779 | 11.7428 |
| Shrinking (%) | −7.08 | −6.097 | −5.335 | −4.78 |
| Mass loss (%) | 4.3195 | 4.64 | 5.042 | 8.4946 |
| Density (g/cm3) | 2.1325 | 2.09 | 2.065 | 2.04 |
| Mass specific (g/cm3) | 2.1605 | 2.29 | 2.36 | 2.34 |
| Absorption (%) | 6.5625 | 4.29 | 6.07 | 6.18 |
| Porosity (%) | 13.975 | 8.9625 | 12.53 | 12.62 |
| Resistance flexion (MPa) | 29.9578 | 28.844 | 31.734 | 14.2101 |
| Breaking strength (N) | 553 | 742 | 743 | 500 |
| Hardness (HV) | 159 | 186 | 167 | 208 |
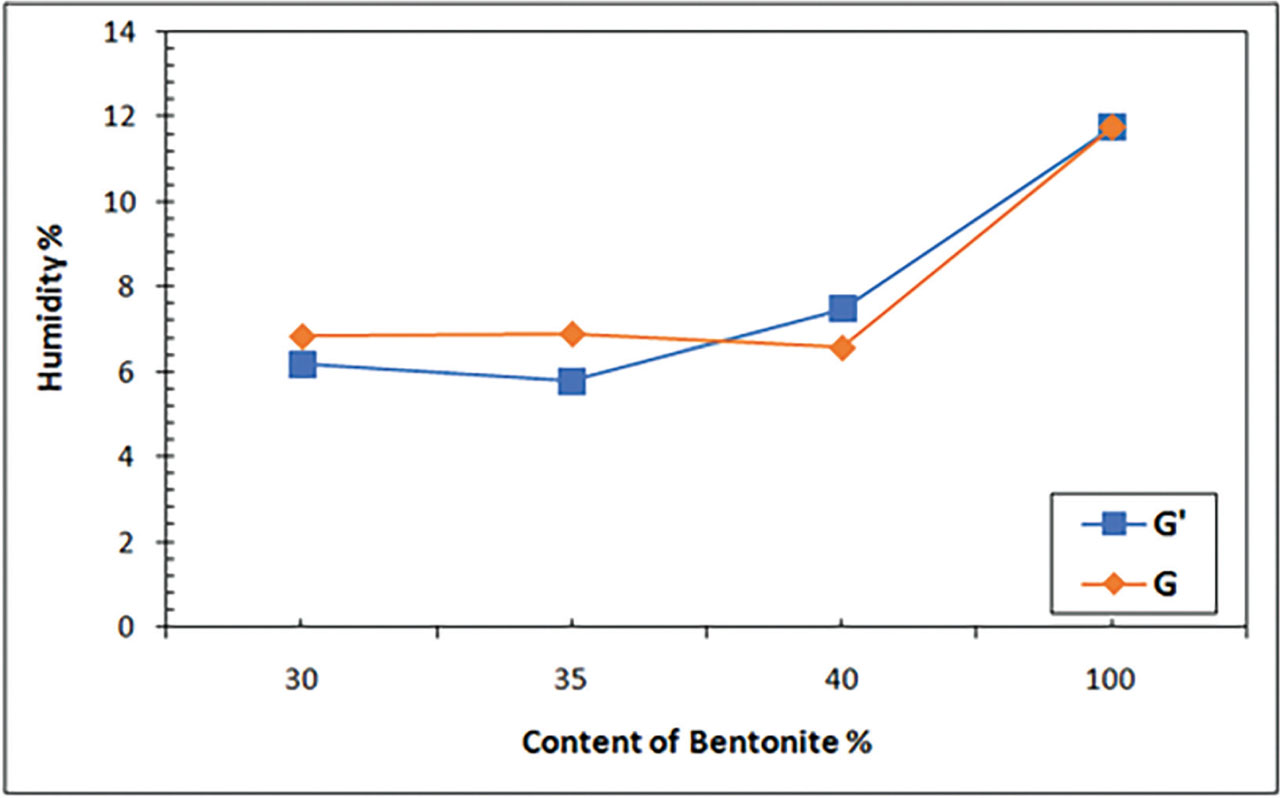
Figure 6:
Variation of humidity as a function of bentonite content (G: Glass Waste 1; G’: Glass Waste 2).
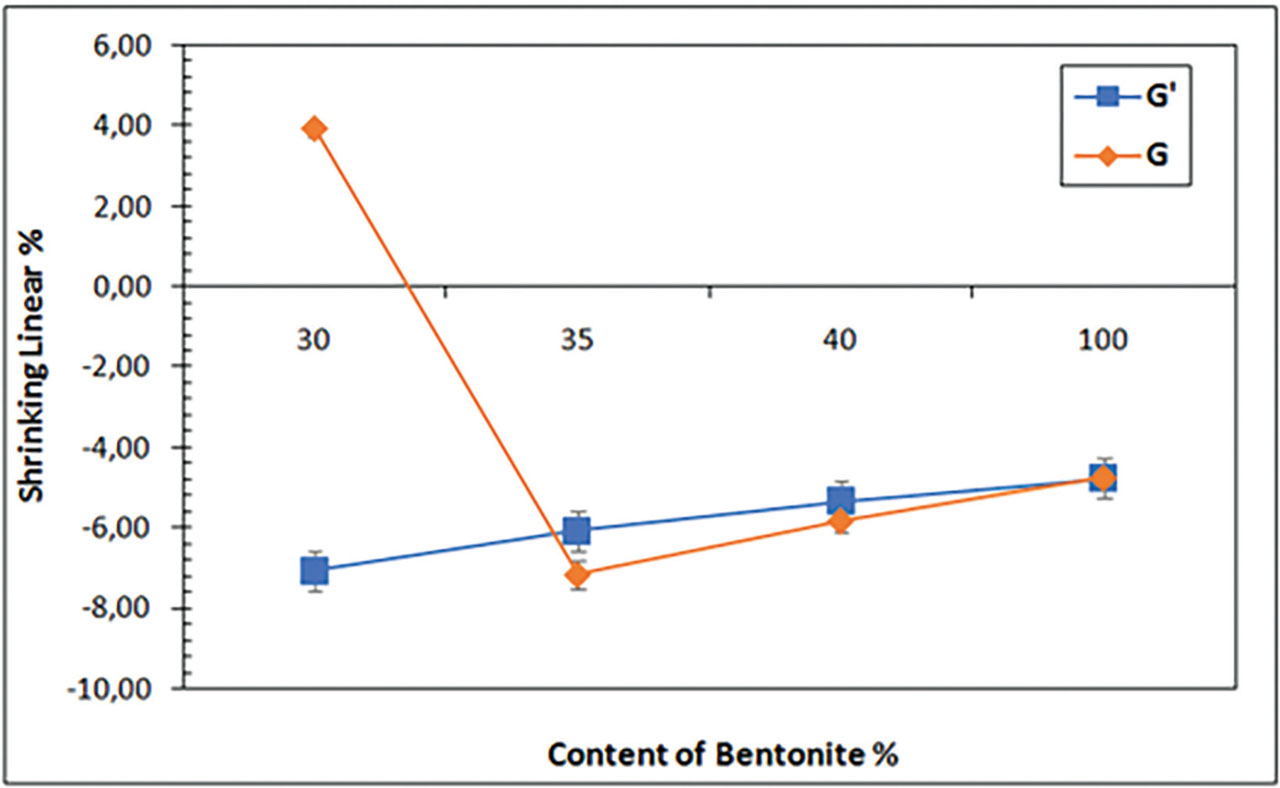
Figure 7:
Variation of shrinking as a function of bentonite content (G: Glass Waste 1; G’: Glass Waste 2).
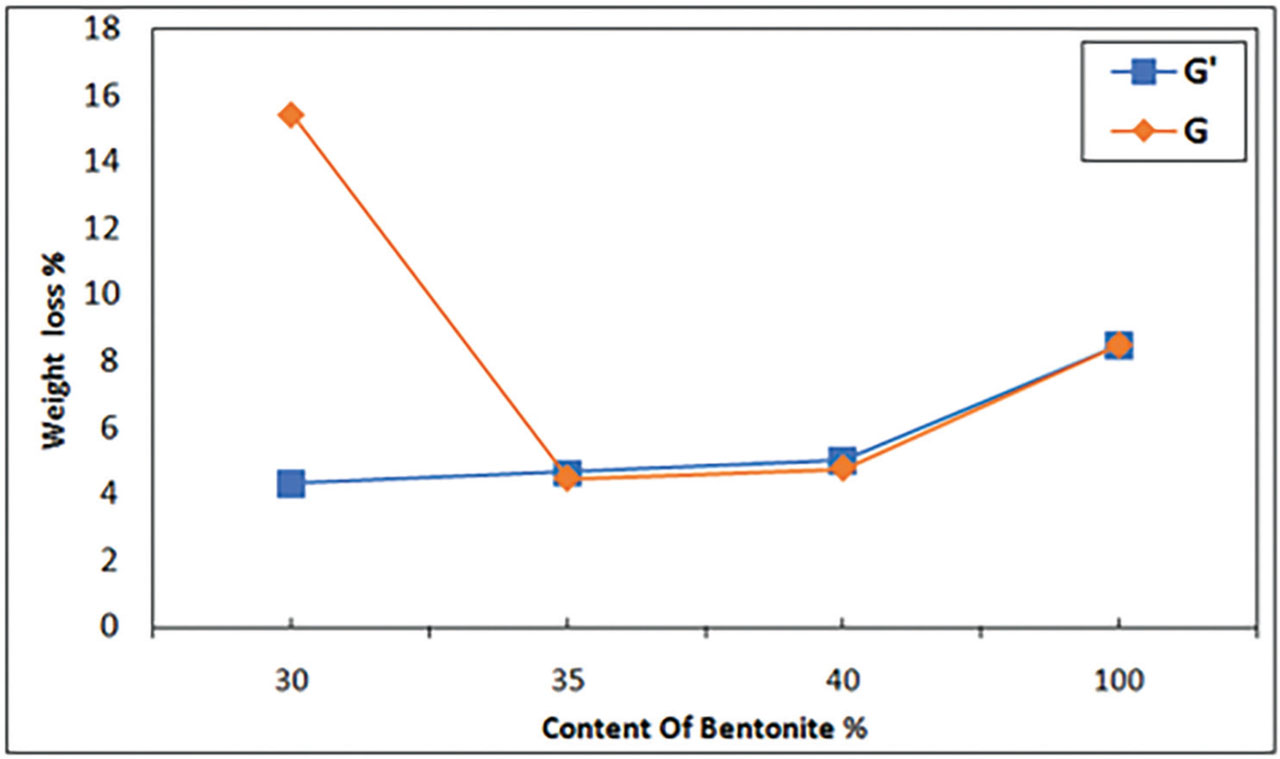
Figure 8:
Weight loss of elaborated ceramic tiles as a function of bentonite content (G: Glass Waste 1; G’: Glass Waste 2).
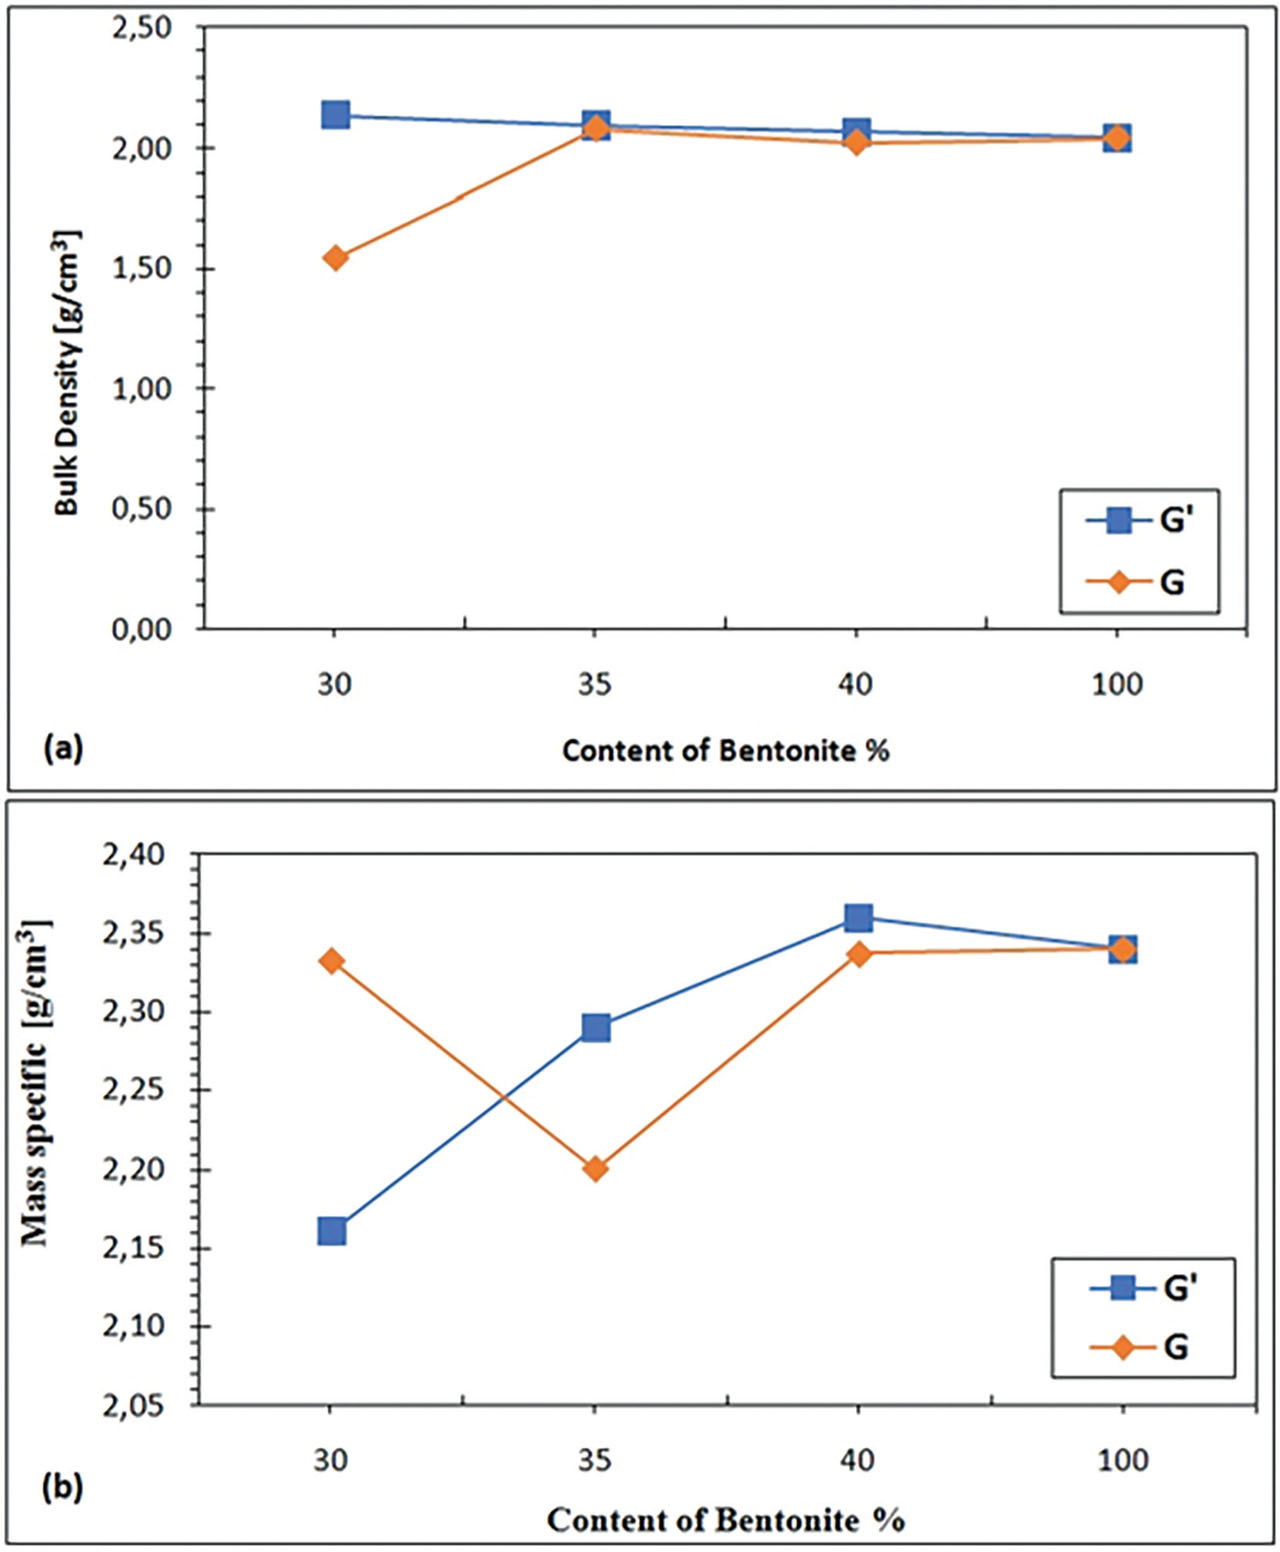
Figure 9:
Variation of bulk density (a) and specific mass (b) of elaborated ceramic tiles as a function of bentonite content (G: Glass Waste 1; G’: Glass Waste 2).
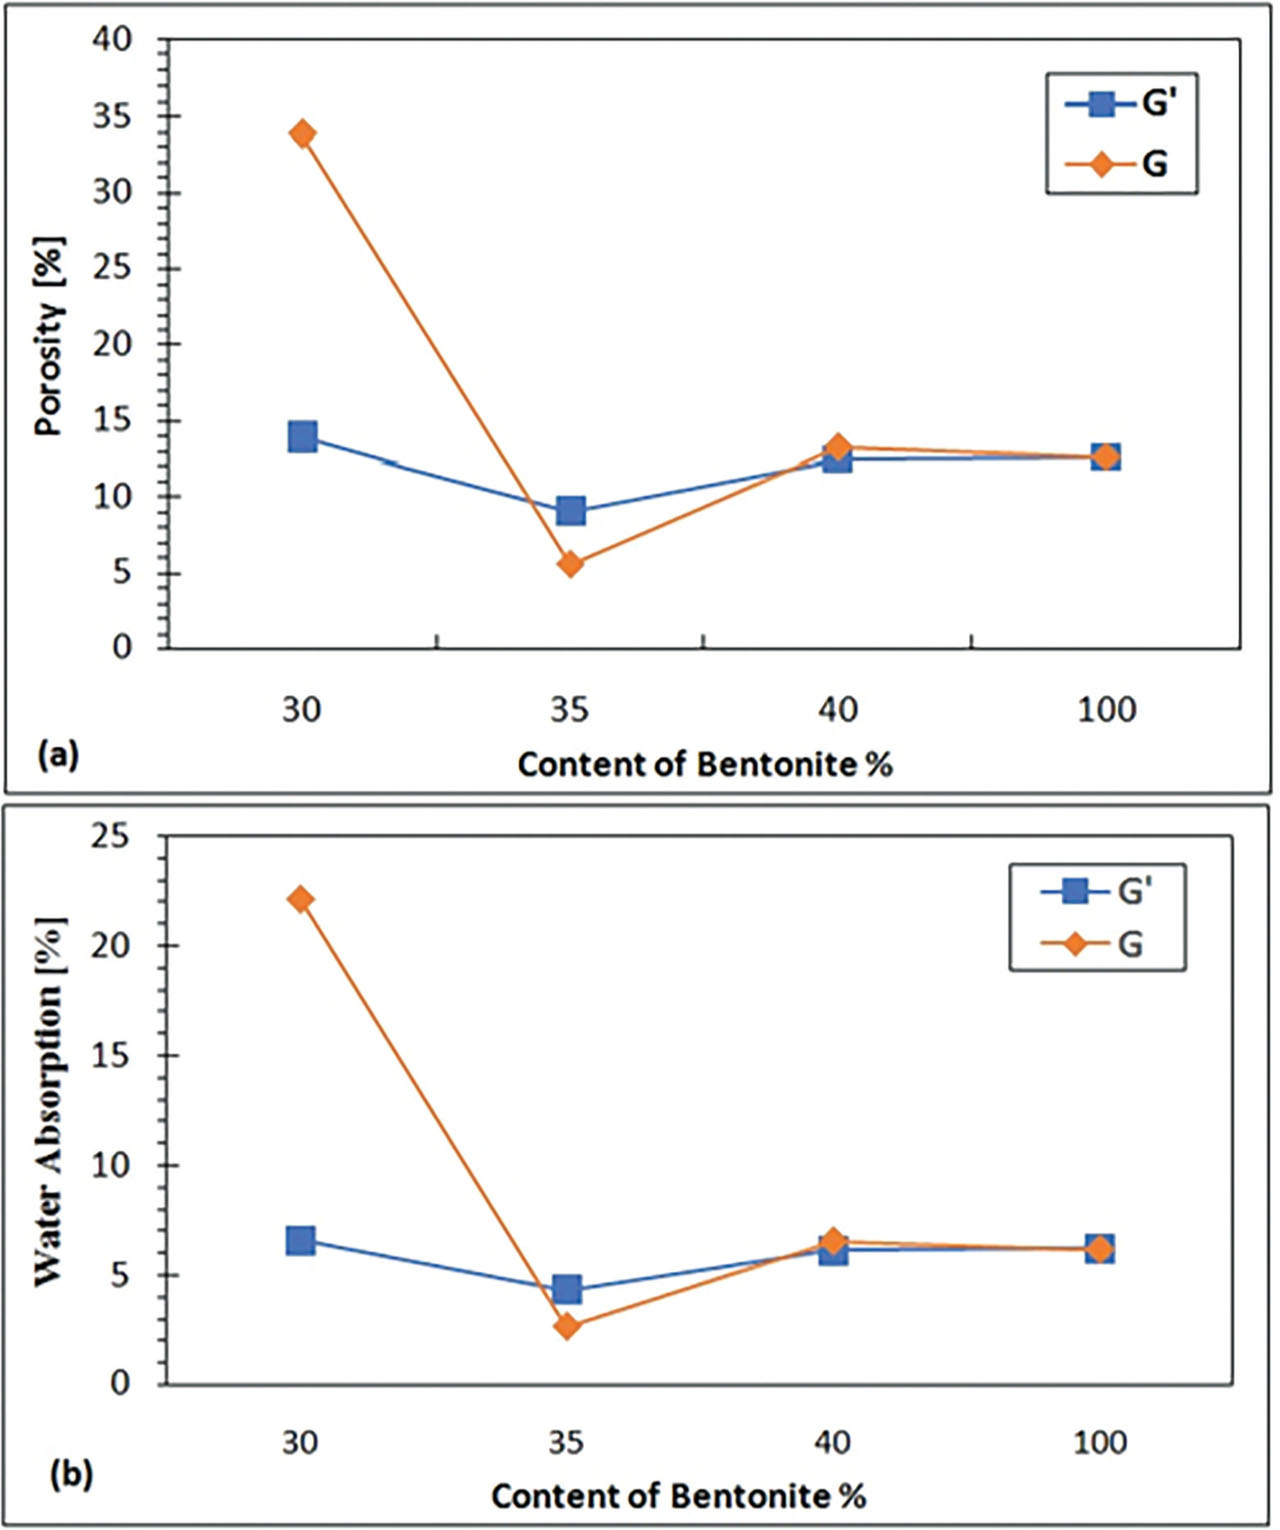
Figure 10:
Variation of porosity (a) and water absorption (b) of elaborated ceramic tiles as a function of bentonite content (G: Glass Waste 1; G’: Glass Waste 2).
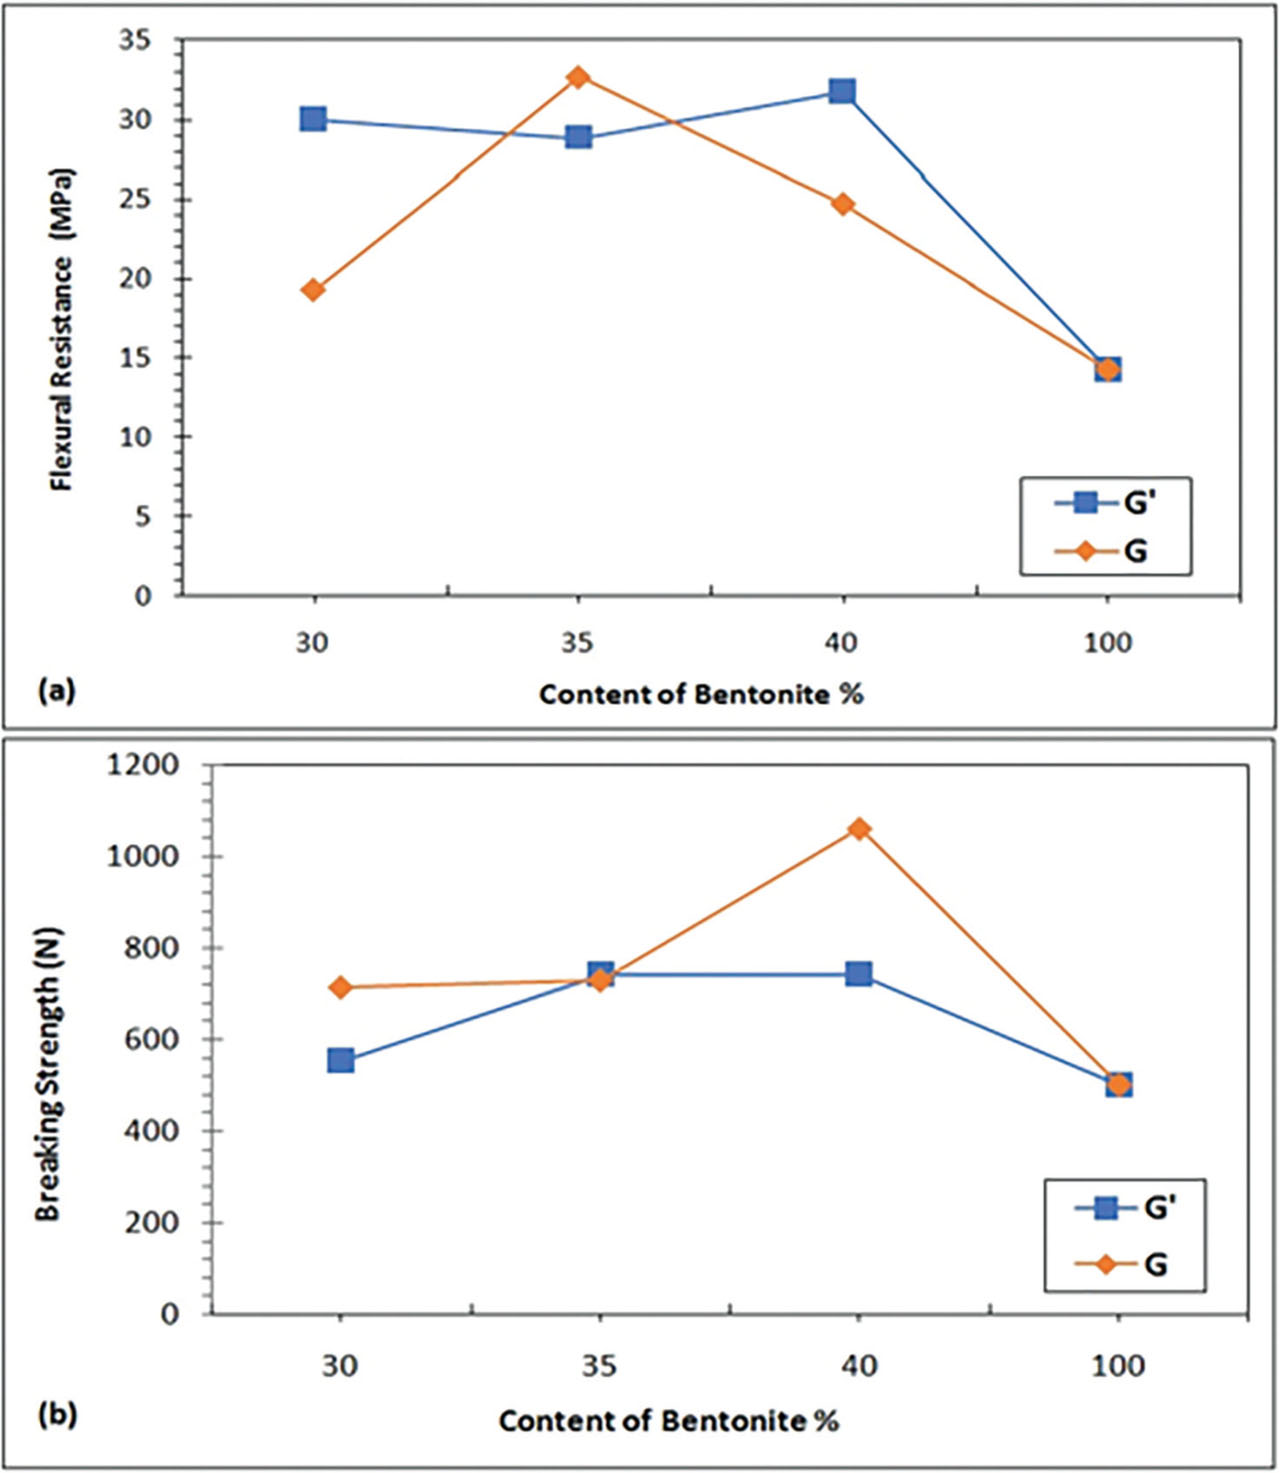
Figure 11:
Flexural (a) and breaking strength (b) of elaborated ceramic tiles as a function of bentonite content.
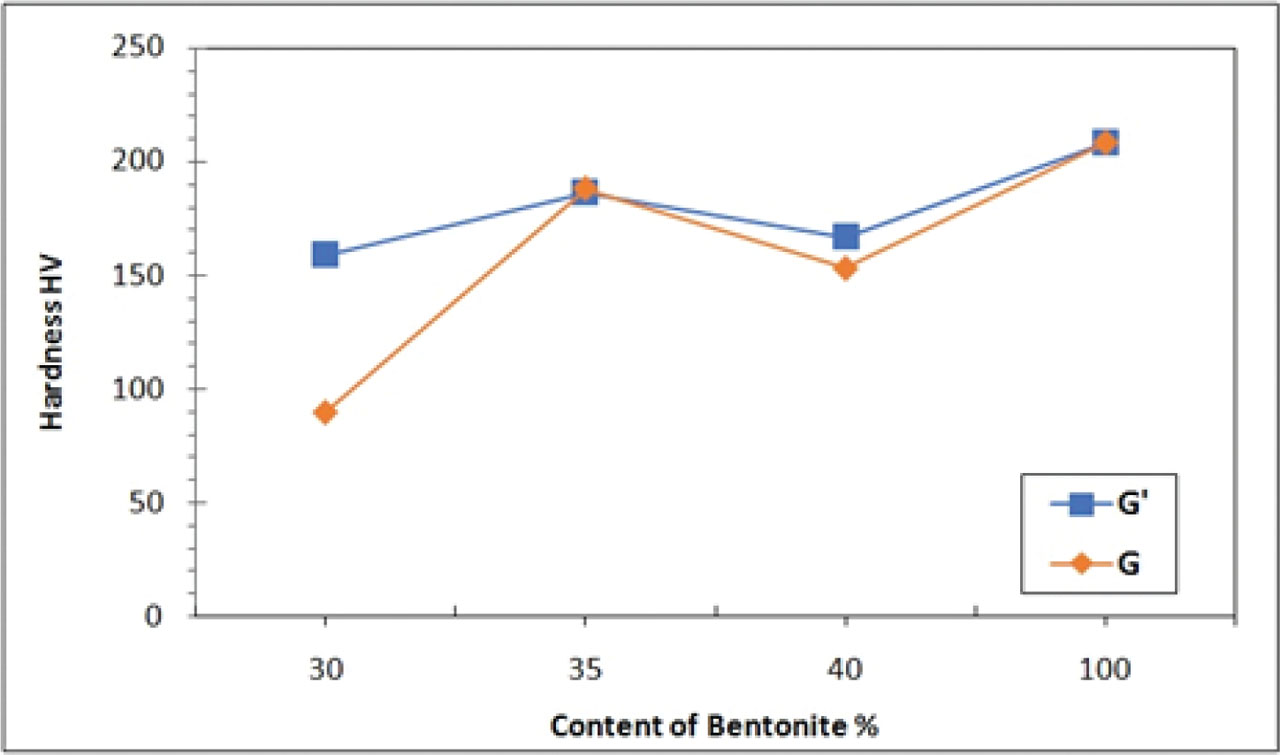
Figure 12:
Variation of hardness of ceramic samples as a function of bentonite content.
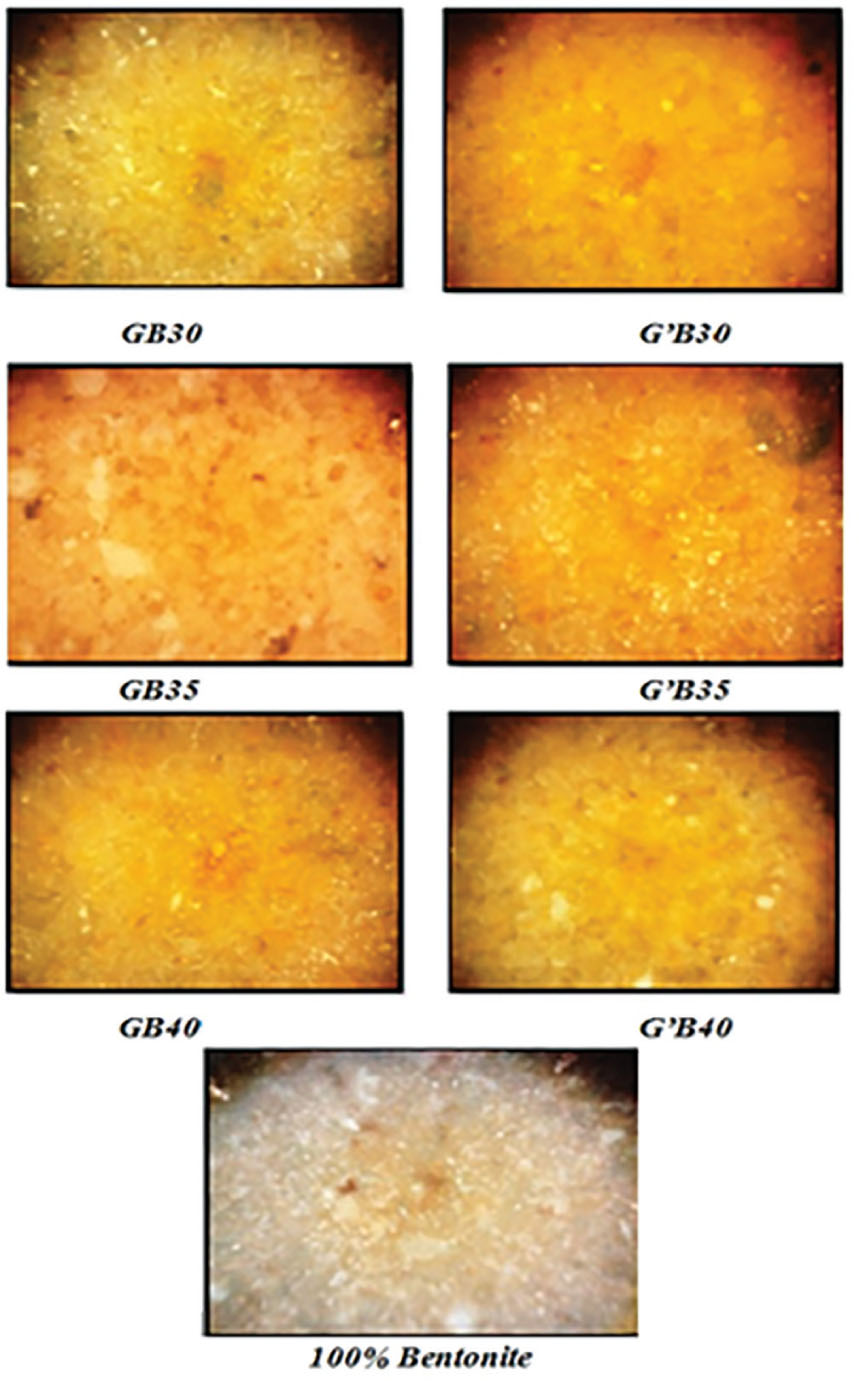
Figure 13:
Observation under microscope at 500 μm.