
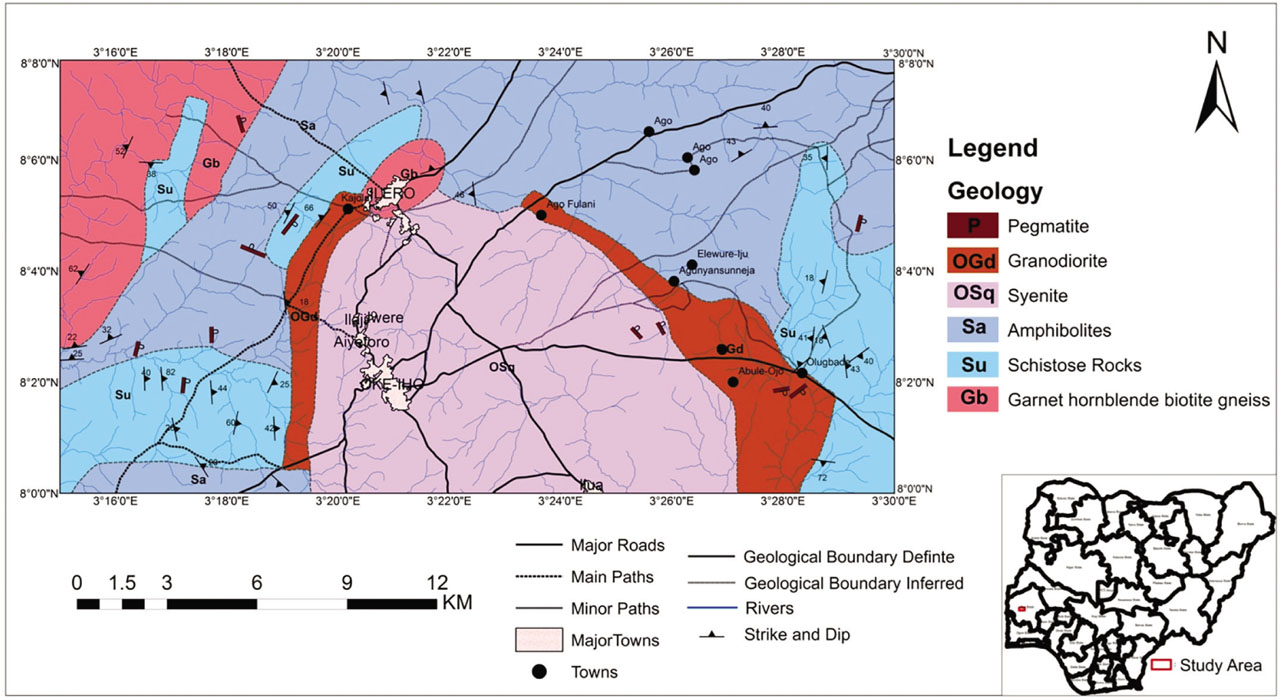
Figure 1:
Geological map of the study area.
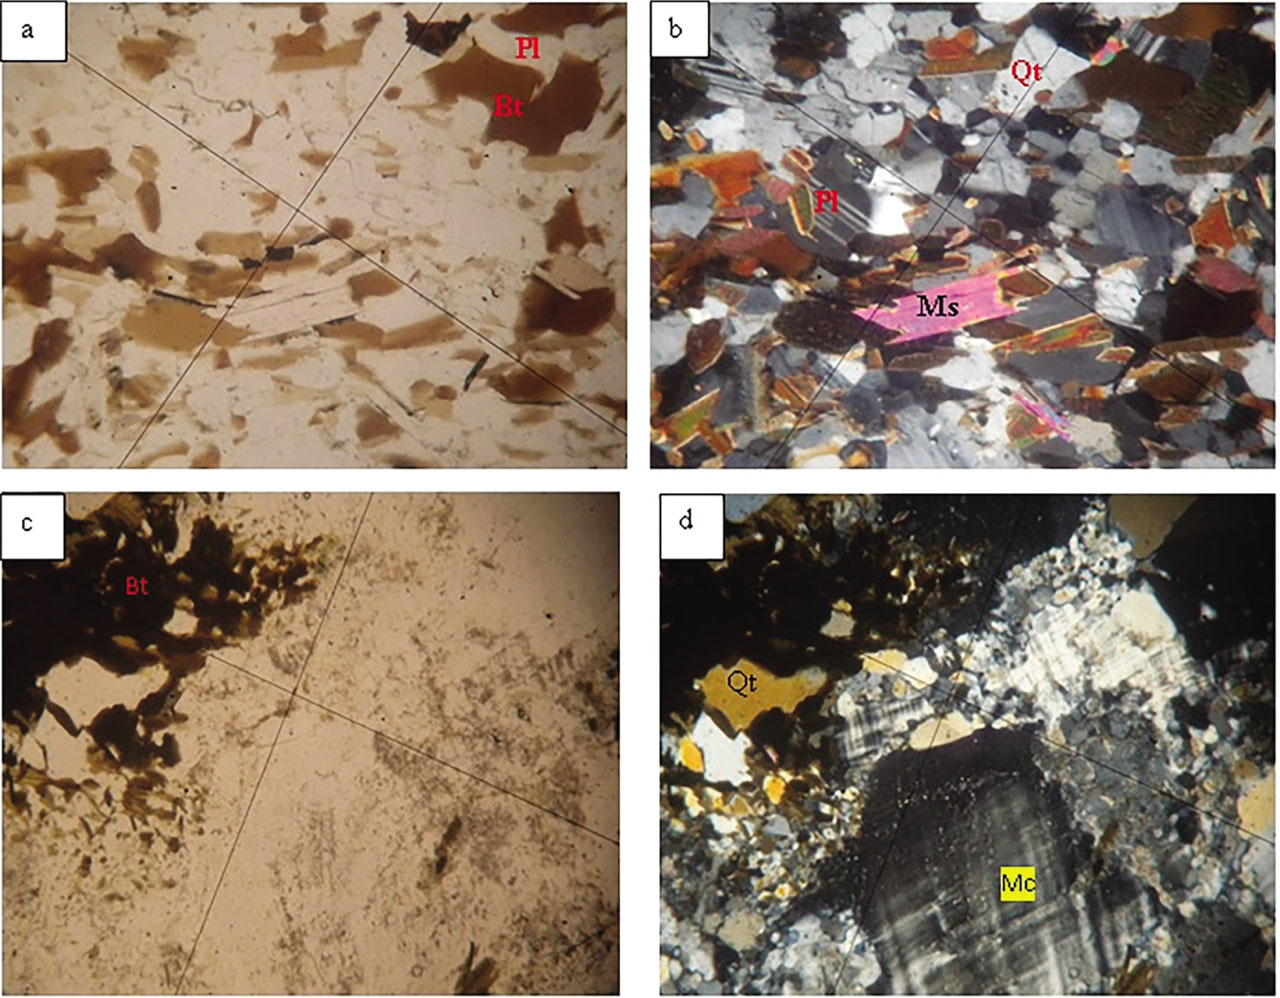
Figure 2:
a) Plane polar photomicrograph of the granodiorite reveals biotite (Bt) as the main mineral phase. b) Plagioclase (Pl), muscovite (Ms), and quartz (Qz) are identified as other major mineral phases under cross-polar. c) Biotite crystals forming mantle around large phenocrysts of feldspar are identified in plane polar. d) Porphyroclast of microcline shows evidence for grain size reduction in cross-polar. The magnification of photomicrographs is x40.
Table 1:
Modal mineralogy for the studied granitoids.
| Min/Sample Id | Pg1 | Pg2 | Pg3 | Sy1 | Sy2 | Sy3 | Sy4 | Sy5 | Sy6 | Sy7 |
|---|---|---|---|---|---|---|---|---|---|---|
| Quartz | 44 | 46 | 47 | 4 | 2 | 4 | 8 | 10 | 7 | 8 |
| Microcline | 13 | 7 | 12 | 42 | 43 | 42 | 41 | 44 | 45 | 42 |
| Plagioclase | 12 | 13 | 11 | 20 | 30 | 16 | 15 | 20 | 20 | 20 |
| Hornblende | 7 | 6 | 5 | 15 | 13 | 17 | 16 | 14 | 13 | 15 |
| Pyroxene | – | – | – | 3 | 2 | 5 | 6 | 6 | 5 | 4 |
| Biotite | 21 | 23 | 20 | 15 | 9 | 15 | 12 | 5 | 8 | 9 |
| Opaque | 3 | 5 | 5 | 1 | 1 | 1 | 2 | 1 | 2 | 2 |
| Garnet | – | – | – | 1 | 1 | 1 | 3 | 2 | 2 | 3 |
Table 2:
Cross, Iddings, Pirsson, and Washington (CIPW) normative mineralogy normative mineralogy for the studied granitoids.
| Norm | Pg1 | Pg2 | Pg3 | Sy1 | Sy2 | Sy3 | Sy4 | Sy5 | Sy6 | Sy7 |
|---|---|---|---|---|---|---|---|---|---|---|
| Q | 28.634 | 23.272 | 17.188 | 5.931 | 7.31 | 2.392 | 5.254 | 7.09 | 5.593 | 5.531 |
| C | 3.16 | 2.875 | 0 | 0 | 0 | 0 | 0 | 0 | 0 | 0 |
| Or | 19.798 | 19.088 | 34.513 | 30.967 | 41.073 | 38.413 | 35.99 | 39.891 | 40.718 | 39.95 |
| Ab | 17.008 | 22 | 15.4 | 8.462 | 23.354 | 24.201 | 15.823 | 21.154 | 19.293 | 18.193 |
| An | 11.78 | 14.029 | 14.774 | 9.258 | 7.74 | 5.428 | 7.644 | 6.414 | 7.152 | 6.81 |
| Di | 0 | 0 | 0 | 18.297 | 3.849 | 10.891 | 13.522 | 9.775 | 9.623 | 11.402 |
| Hy | 9.142 | 8.37 | 8.096 | 13.763 | 6.163 | 6.335 | 9.102 | 4.487 | 5.728 | 6.572 |
| Il | 0.235 | 0.193 | 0.15 | 0.257 | 0.193 | 0.193 | 0.278 | 0.193 | 0.171 | 0.214 |
| Hm | 7.381 | 6.411 | 5.65 | 7.481 | 5.94 | 6.451 | 7.801 | 6.07 | 6.08 | 6.301 |
| Tn | 0 | 0 | 0.993 | 2.786 | 2.108 | 2.844 | 1.776 | 2.255 | 2.627 | 2.399 |
| Ru | 1.007 | 0.879 | 0.457 | 0 | 0 | 0 | 0 | 0 | 0 | 0 |
| Ap | 0.64 | 1.587 | 0.734 | 1.113 | 0.9 | 1.137 | 1.042 | 0.829 | 1.161 | 1.184 |
| Sum | 98.784 | 98.704 | 97.955 | 98.315 | 98.629 | 98.284 | 98.233 | 98.158 | 98.145 | 98.556 |
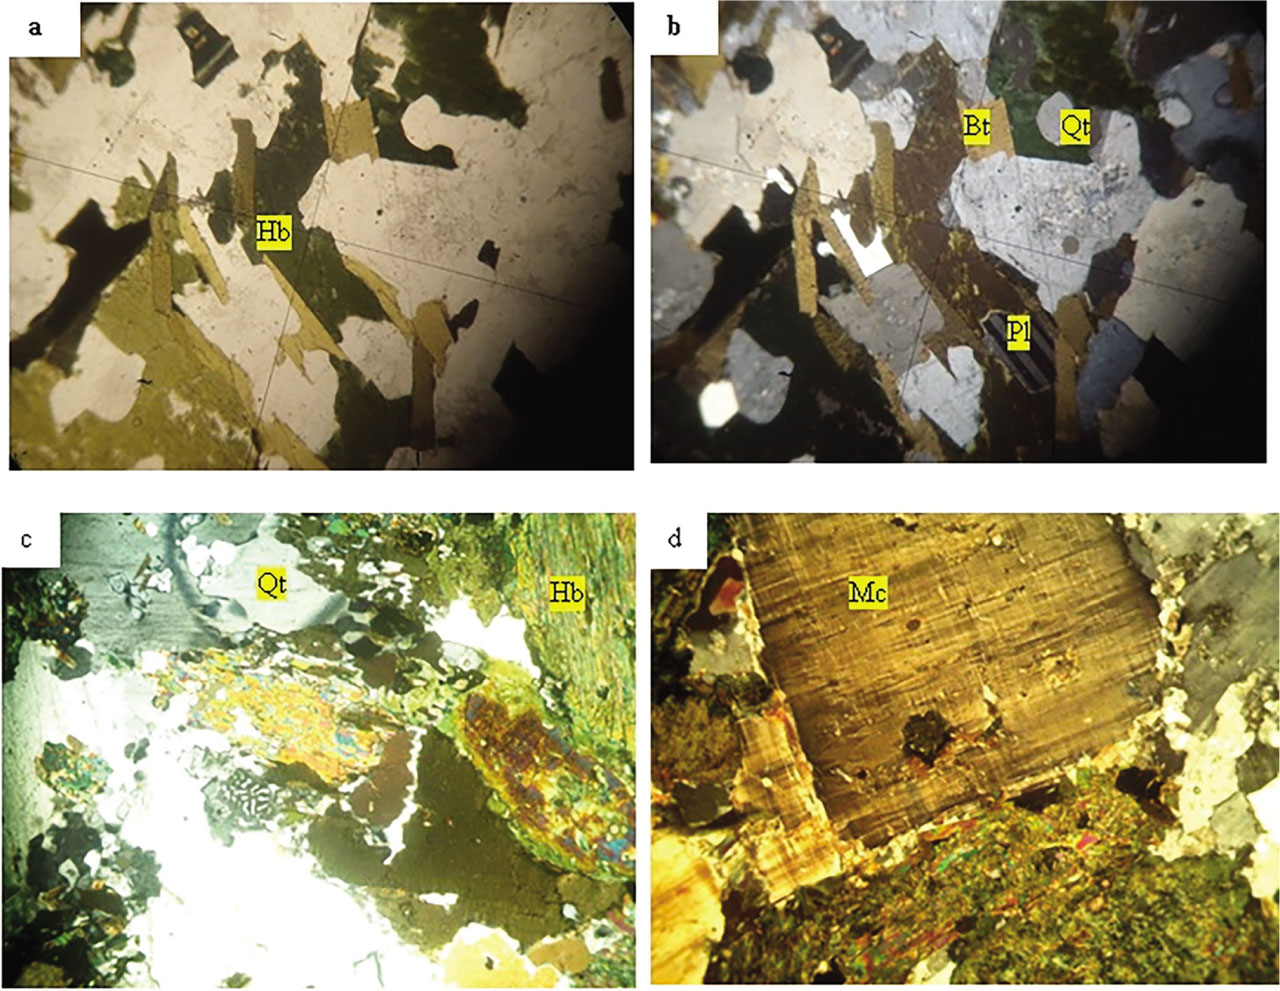
Figure 3:
Photomicrograph of syenite. a) Plane-polarised light reveals euhedral grains of biotite (Bt) around subhedral grains of hornblende (Hb). b) Cross-polar view reveals plagioclase (Pl) and quartz (Qt) as the main mineral phases. c) and d) reveal large hornblende and microcline grains. The magnification of photomicrographs is x40.
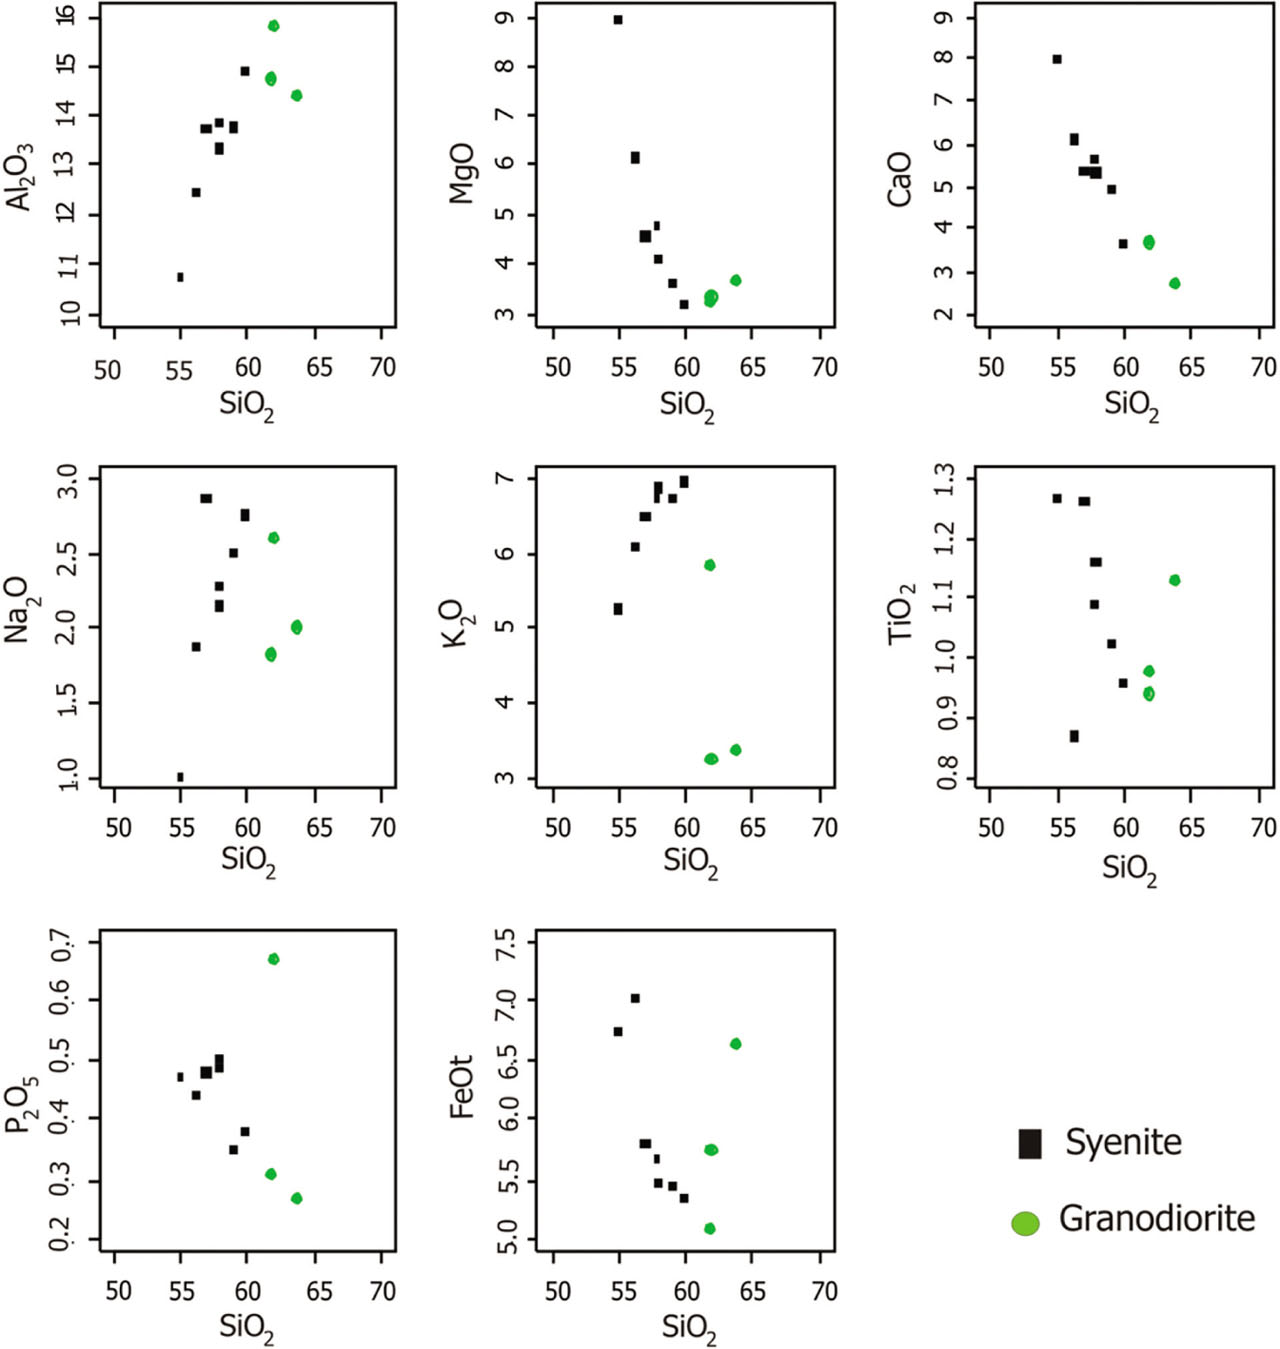
Figure 4:
Harker's plot of SiO2 vs. other oxides in wt. %.
Table 3:
Elemental concentrations of the studied granitoids. Granodiorite (Pg1–Pg3) and Syenite (Sy1–Sy7) (major oxides are in wt. % and trace element in ppm).
| Sample id | Pg1 | Pg2 | Pg3 | Av. | Sy1 | Sy2 | Sy3 | Sy4 | Sy5 | Sy6 | Sy7 | Av. | Ave* |
|---|---|---|---|---|---|---|---|---|---|---|---|---|---|
| SiO2 | 63.70 | 61.82 | 61.65 | 62.39 | 55.04 | 59.77 | 56.95 | 56.23 | 59.03 | 57.88 | 57.84 | 57.53 | 58.99 |
| Al2O3 | 14.41 | 15.79 | 14.73 | 14.98 | 10.71 | 14.90 | 13.73 | 12.47 | 13.77 | 13.83 | 13.35 | 13.25 | 13.77 |
| Fe2O3 | 7.38 | 6.41 | 5.65 | 6.48 | 7.48 | 5.94 | 6.45 | 7.80 | 6.07 | 6.08 | 6.30 | 6.59 | 6.56 |
| MgO | 3.67 | 3.36 | 3.25 | 3.43 | 8.93 | 3.19 | 4.57 | 6.17 | 3.62 | 4.09 | 4.76 | 5.05 | 4.56 |
| CaO | 2.73 | 3.71 | 3.67 | 3.37 | 8.02 | 3.66 | 5.36 | 6.13 | 4.93 | 5.33 | 5.67 | 5.59 | 4.92 |
| Na2O | 2.01 | 2.60 | 1.82 | 2.14 | 1.00 | 2.76 | 2.86 | 1.87 | 2.50 | 2.28 | 2.15 | 2.20 | 2.19 |
| K2O | 3.35 | 3.23 | 5.84 | 4.14 | 5.24 | 6.95 | 6.50 | 6.09 | 6.75 | 6.89 | 6.76 | 6.45 | 5.76 |
| TiO2 | 1.13 | 0.98 | 0.94 | 1.02 | 1.27 | 0.96 | 1.26 | 0.87 | 1.02 | 1.16 | 1.09 | 1.09 | 1.07 |
| P2O5 | 0.27 | 0.67 | 0.31 | 0.42 | 0.47 | 0.38 | 0.48 | 0.44 | 0.35 | 0.49 | 0.50 | 0.44 | 0.44 |
| MnO | 0.11 | 0.09 | 0.07 | 0.09 | 0.12 | 0.09 | 0.09 | 0.13 | 0.09 | 0.08 | 0.10 | 0.10 | 0.10 |
| Ba | 677.00 | 685.00 | 1629.00 | 997.00 | 1407.00 | 1313.00 | 1387.00 | 1370.00 | 1288.00 | 1402.00 | 1638.00 | 1400.71 | 1279.60 |
| Ni | 60.10 | 57.80 | 51.90 | 56.60 | 114.50 | 33.10 | 38.70 | 26.20 | 17.40 | 44.90 | 44.50 | 45.61 | 48.91 |
| Co | 22.00 | 18.90 | 18.90 | 19.93 | 34.10 | 16.20 | 22.10 | 23.30 | 18.70 | 19.50 | 21.30 | 22.17 | 21.50 |
| Nb | 20.50 | 16.60 | 21.60 | 19.57 | 21.10 | 38.90 | 55.80 | 22.10 | 50.20 | 39.10 | 31.40 | 36.94 | 31.73 |
| Rb | 150.50 | 144.00 | 250.70 | 181.73 | 221.40 | 341.90 | 324.70 | 247.00 | 388.00 | 351.70 | 329.00 | 314.81 | 274.89 |
| Sn | 3.00 | 3.00 | 4.00 | 3.33 | 6.00 | 9.00 | 11.00 | 5.00 | 5.00 | 6.00 | 6.00 | 6.86 | 5.80 |
| Sc | 13.00 | 12.00 | 13.00 | 12.67 | 21.00 | 11.00 | 11.00 | 16.00 | 11.00 | 9.00 | 13.00 | 13.14 | 13.00 |
| Sr | 219.00 | 293.80 | 387.00 | 299.93 | 338.10 | 449.90 | 461.80 | 403.10 | 402.20 | 450.70 | 472.40 | 425.46 | 387.80 |
| Ta | 1.20 | 1.20 | 1.00 | 1.13 | 0.90 | 1.70 | 2.50 | 1.50 | 3.30 | 2.40 | 1.80 | 2.01 | 1.75 |
| Th | 17.20 | 38.80 | 26.00 | 27.33 | 25.20 | 48.80 | 92.90 | 46.30 | 53.80 | 50.20 | 80.90 | 56.87 | 48.01 |
| U | 4.10 | 5.80 | 5.80 | 5.23 | 7.90 | 5.30 | 5.20 | 4.70 | 6.20 | 6.70 | 7.90 | 6.27 | 5.96 |
| V | 139.00 | 79.00 | 82.00 | 100.00 | 122.00 | 73.00 | 93.00 | 105.00 | 87.00 | 79.00 | 93.00 | 93.14 | 95.20 |
| W | 1.40 | 0.80 | 0.70 | 0.97 | 0.90 | 1.80 | 1.50 | 4.40 | 1.50 | 1.70 | 1.50 | 1.90 | 1.62 |
| Hf | 15.80 | 15.00 | 11.30 | 14.03 | 15.30 | 18.40 | 17.80 | 9.30 | 19.70 | 15.10 | 14.30 | 15.70 | 15.20 |
| Zr | 612.20 | 605.30 | 431.70 | 549.73 | 625.70 | 694.10 | 681.60 | 324.10 | 731.60 | 579.30 | 559.00 | 599.34 | 584.46 |
| Y | 69.40 | 67.40 | 22.50 | 53.10 | 29.00 | 33.70 | 47.60 | 37.60 | 59.70 | 34.70 | 36.50 | 39.83 | 43.81 |
| Cu | 16.40 | 13.90 | 46.50 | 25.60 | 104.10 | 34.80 | 45.70 | 23.70 | 6.60 | 35.30 | 37.30 | 41.07 | 36.43 |
| Pb | 3.90 | 5.40 | 12.60 | 7.30 | 11.20 | 34.30 | 62.50 | 16.30 | 10.40 | 4.80 | 6.30 | 20.83 | 16.77 |
| Zn | 104.00 | 95.00 | 73.00 | 90.67 | 25.00 | 57.00 | 35.00 | 22.00 | 34.00 | 55.00 | 49.00 | 39.57 | 54.90 |
| Au | 2.10 | 1.90 | 0.60 | 1.53 | 2.30 | 0.80 | 3.20 | 1.80 | 0.80 | 13.90 | 1.70 | 3.50 | 2.91 |
| La | 57.8 | 101.3 | 76.3 | 78.47 | 45.5 | 149.9 | 183.5 | 106.2 | 248.7 | 151.2 | 123.4 | 144.06 | 124.38 |
| Ce | 99.1 | 200.9 | 146.3 | 148.77 | 105.6 | 295.6 | 350.4 | 221 | 421.1 | 282.4 | 247 | 274.73 | 236.94 |
| Pr | 12.86 | 24.44 | 17 | 18.10 | 14.33 | 32.95 | 40.53 | 26.73 | 51.53 | 32.92 | 29.02 | 32.57 | 28.23 |
| Nd | 50.3 | 93.3 | 61.6 | 68.40 | 63.3 | 115.9 | 150.6 | 102.1 | 181.5 | 116.9 | 105.4 | 119.39 | 104.09 |
| Sm | 9.96 | 17.78 | 10.09 | 12.61 | 12.63 | 17.38 | 24.75 | 17.08 | 27.72 | 17.64 | 16.89 | 19.16 | 17.19 |
| Eu | 1.68 | 2.37 | 2.09 | 2.05 | 2.57 | 3.17 | 4.32 | 2.9 | 4.4 | 3.11 | 2.81 | 3.33 | 2.94 |
| Gd | 10.49 | 15.86 | 7.46 | 11.27 | 9.3 | 11.09 | 16.1 | 12.25 | 20.63 | 11.99 | 12.03 | 13.34 | 12.72 |
| Tb | 1.79 | 2.35 | 0.9 | 1.68 | 1.16 | 1.36 | 2.01 | 1.57 | 2.33 | 1.4 | 1.44 | 1.61 | 1.63 |
| Dy | 11.01 | 13.05 | 4.66 | 9.57 | 5.94 | 6.7 | 9.67 | 7.7 | 11.54 | 6.87 | 7.19 | 7.94 | 8.43 |
| Ho | 2.48 | 2.49 | 0.77 | 1.91 | 1.07 | 1.11 | 1.62 | 1.37 | 1.9 | 1.1 | 1.21 | 1.34 | 1.51 |
| Er | 7.27 | 7.16 | 2 | 5.48 | 2.92 | 3.12 | 4.2 | 3.54 | 4.98 | 3.13 | 3.16 | 3.58 | 4.15 |
| Tm | 1.01 | 1 | 0.32 | 0.78 | 0.4 | 0.44 | 0.58 | 0.5 | 0.68 | 0.42 | 0.42 | 0.49 | 0.58 |
| Yb | 6.16 | 6.15 | 1.95 | 4.75 | 2.61 | 2.88 | 3.65 | 2.98 | 4.18 | 2.6 | 2.62 | 3.07 | 3.58 |
| Lu | 0.9 | 0.85 | 0.28 | 0.68 | 0.38 | 0.43 | 0.51 | 0.45 | 0.61 | 0.38 | 0.4 | 0.45 | 0.52 |
| ASI | 1.21 | 1.09 | 0.92 | 1.07 | 0.49 | 0.8 | 0.64 | 0.6 | 0.68 | 0.66 | 0.63 | 0.64 | 0.77 |
| Zr/Hf | 38.75 | 40.35 | 38.20 | 39.10 | 40.90 | 37.72 | 38.29 | 34.85 | 37.14 | 38.36 | 39.09 | 38.05 | 38.37 |
| Nb/Ta | 17.08 | 13.83 | 21.60 | 17.51 | 23.44 | 22.88 | 22.32 | 14.73 | 15.21 | 16.29 | 17.44 | 18.90 | 18.48 |
| LREE | 242.2 | 456 | 320.84 | 339.66 | 253.23 | 625.99 | 770.2 | 488.26 | 955.58 | 616.16 | 536.55 | 606.57 | 526.50 |
| HREE | 30.62 | 33.05 | 10.88 | 24.85 | 14.48 | 16.04 | 22.24 | 18.11 | 26.22 | 15.9 | 16.44 | 18.49 | 20.40 |
| LREE/HREE | 7.91 | 13.80 | 29.49 | 17.06 | 17.49 | 39.03 | 34.63 | 26.96 | 36.44 | 38.75 | 32.64 | 32.28 | 27.71 |
| REE(tot) | 272.81 | 489.00 | 331.72 | 364.51 | 267.71 | 642.03 | 792.44 | 506.37 | 981.80 | 632.06 | 552.99 | 625.06 | 546.89 |
| (Eu/Eu*)N | 0.50 | 0.42 | 0.71 | 0.54 | 0.69 | 0.65 | 0.62 | 0.59 | 0.54 | 0.62 | 0.57 | 0.61 | 0.59 |
| (La/Yb)N | 6.33 | 11.11 | 26.38 | 14.60 | 11.75 | 35.09 | 33.89 | 24.03 | 40.11 | 39.21 | 31.75 | 30.83 | 25.96 |
[i] Av. Pg – Average for Granodiorite only
[ii] Av. Sy – Average for Syenite only
[iii] Ave* - Average for all the granitoid samples
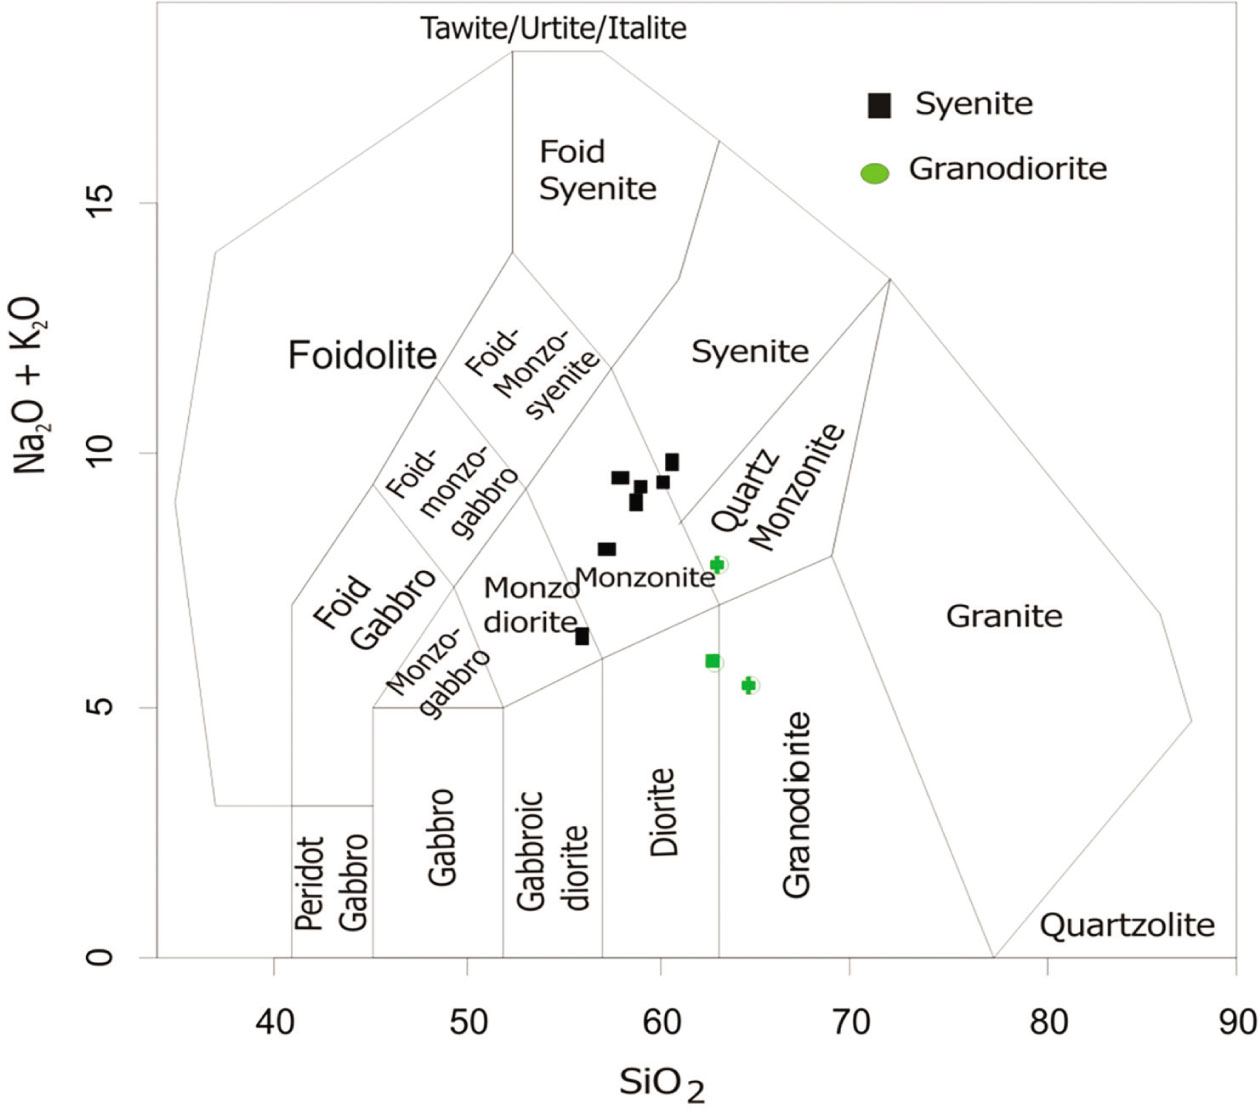
Figure 5:
TAS plot (after Middlemost [19]).
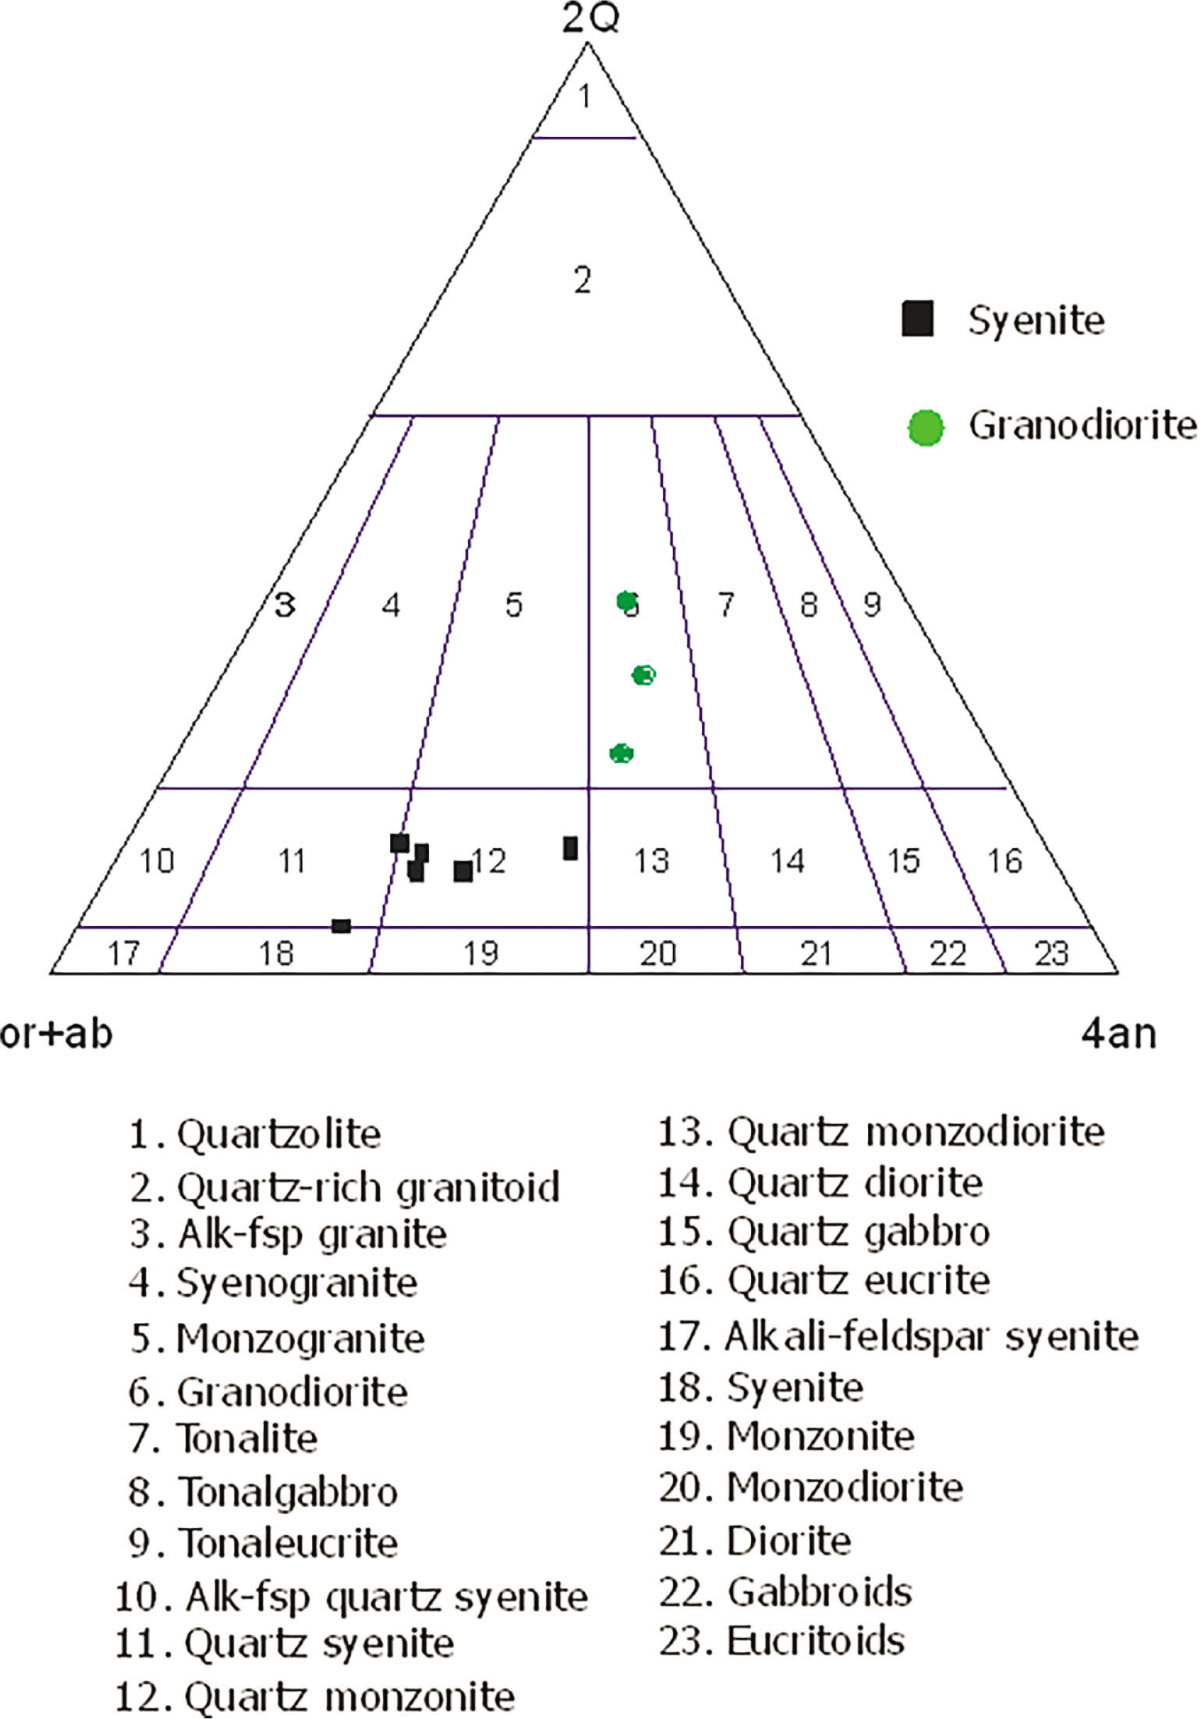
Figure 6:
An adapted QAP diagram using CIPW normative mineralogy [20].
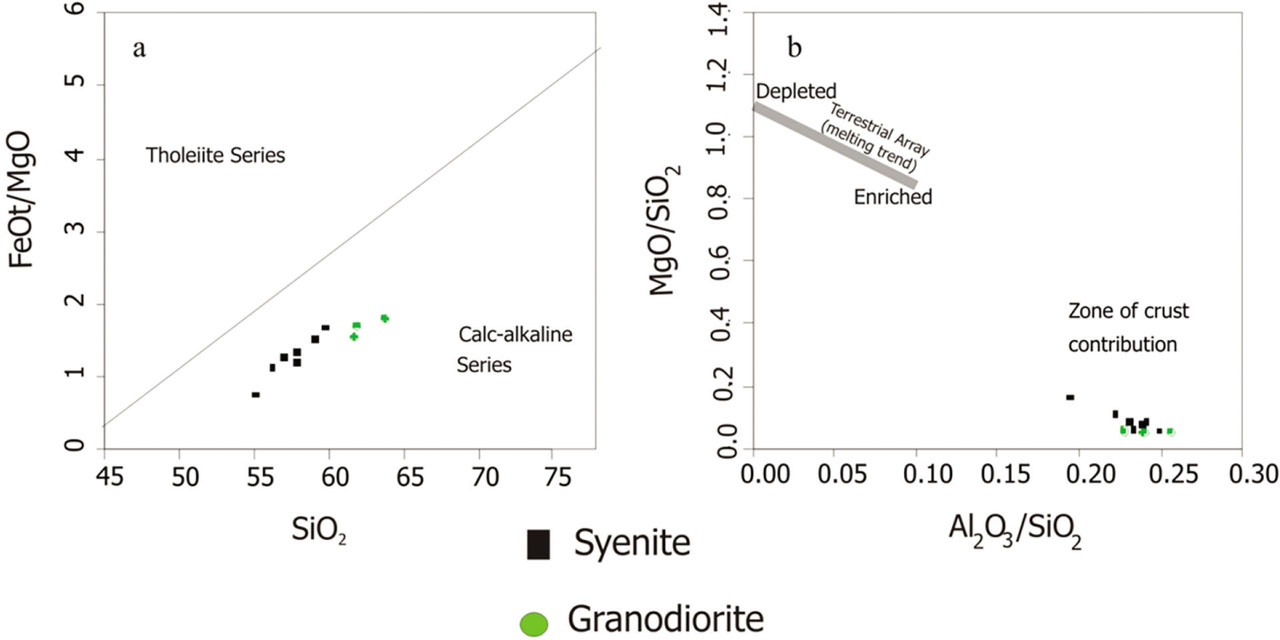
Figure 7:
a) Plot of SiO2 vs. FeO(tot) [24]. b) Plot of Al2O3 /SiO2 vs. MgO/SiO2 (adapted after Paulick et al. [25]).
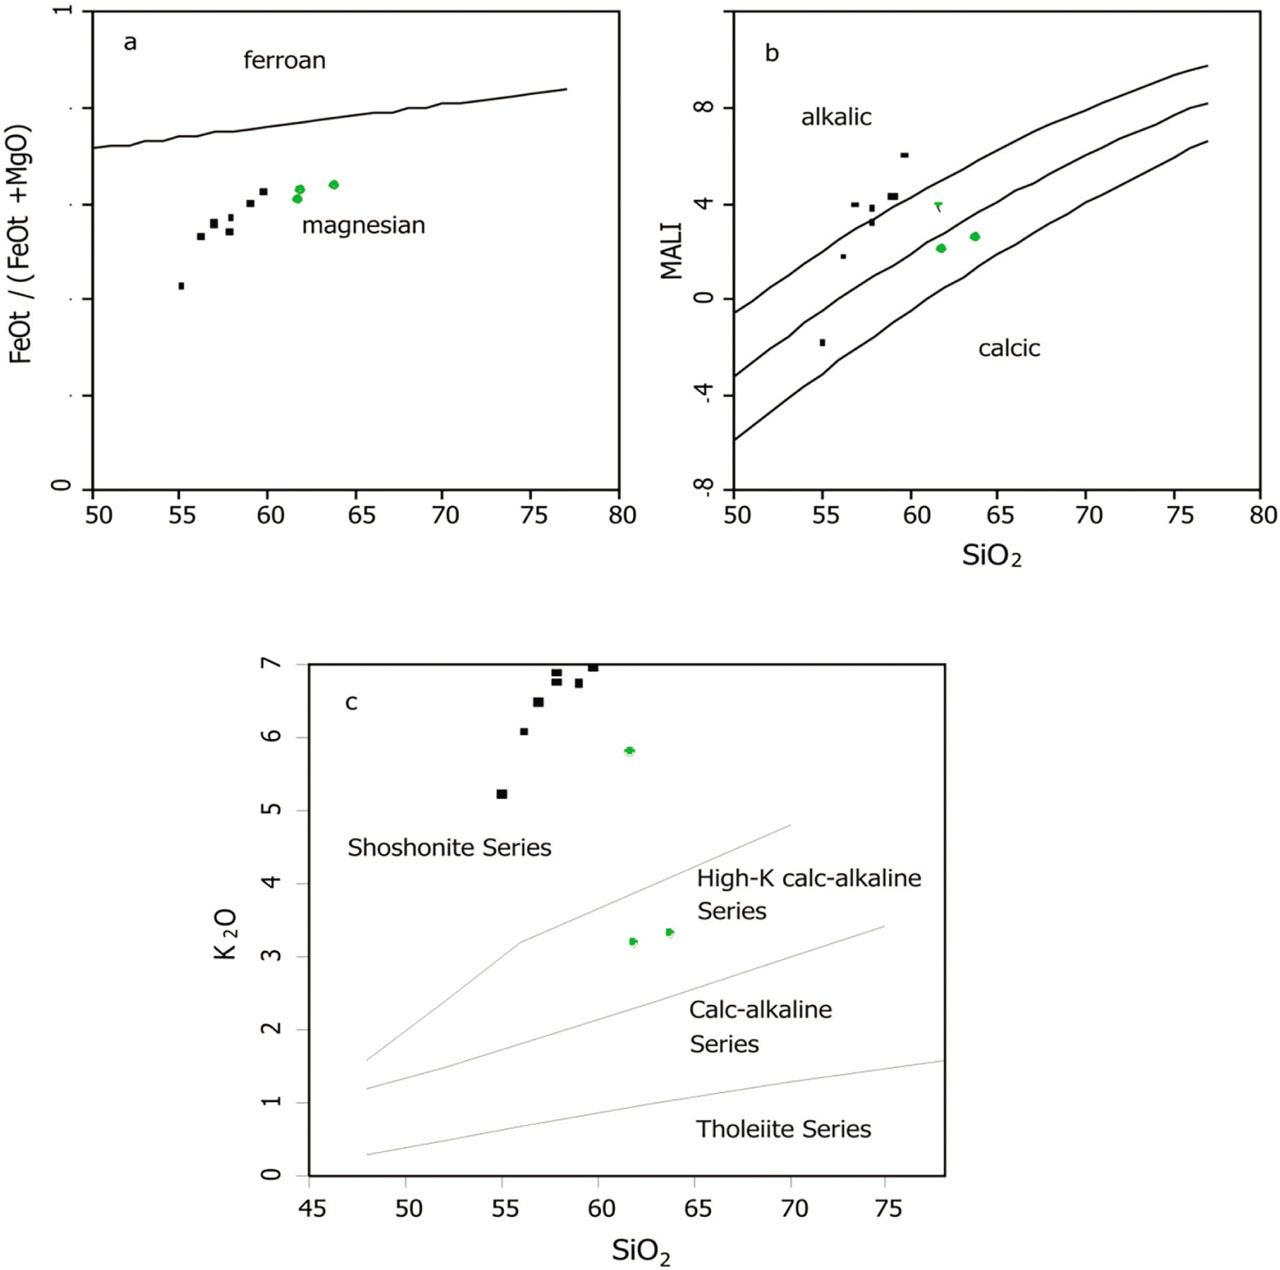
Figure 8:
a) SiO2 vs. (FeO+0.9Fe2O3)/(FeO+0.9Fe2O3+MgO) (after Frost & Frost [30]); b) SiO2 vs. Modified Alkali Lime Index (MALI) (Na2O+K2O-CaO) [10], and; c) SiO2 vs. K2O (after Peccerillo & Taylor [31]).
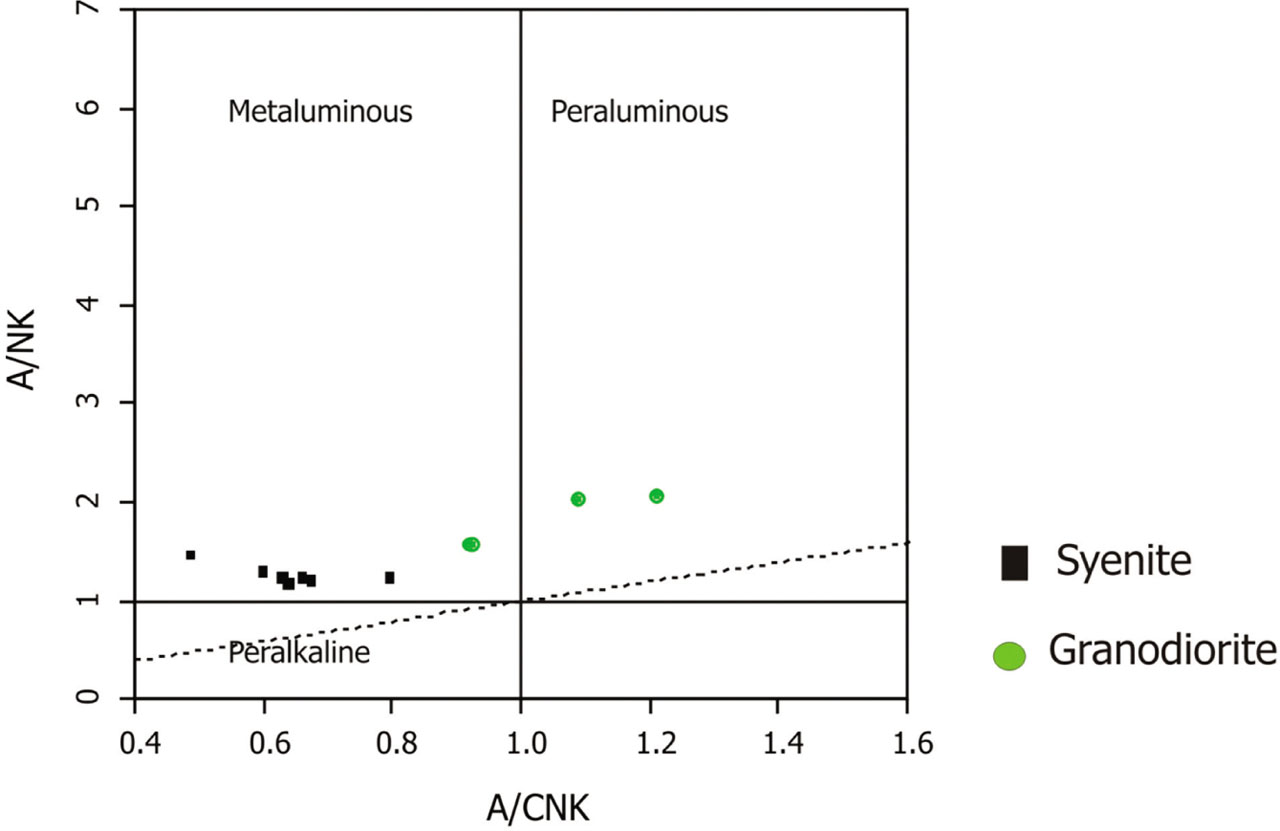
Figure 9:
A/CNK vs. A/NK plot (after Shand [32]).
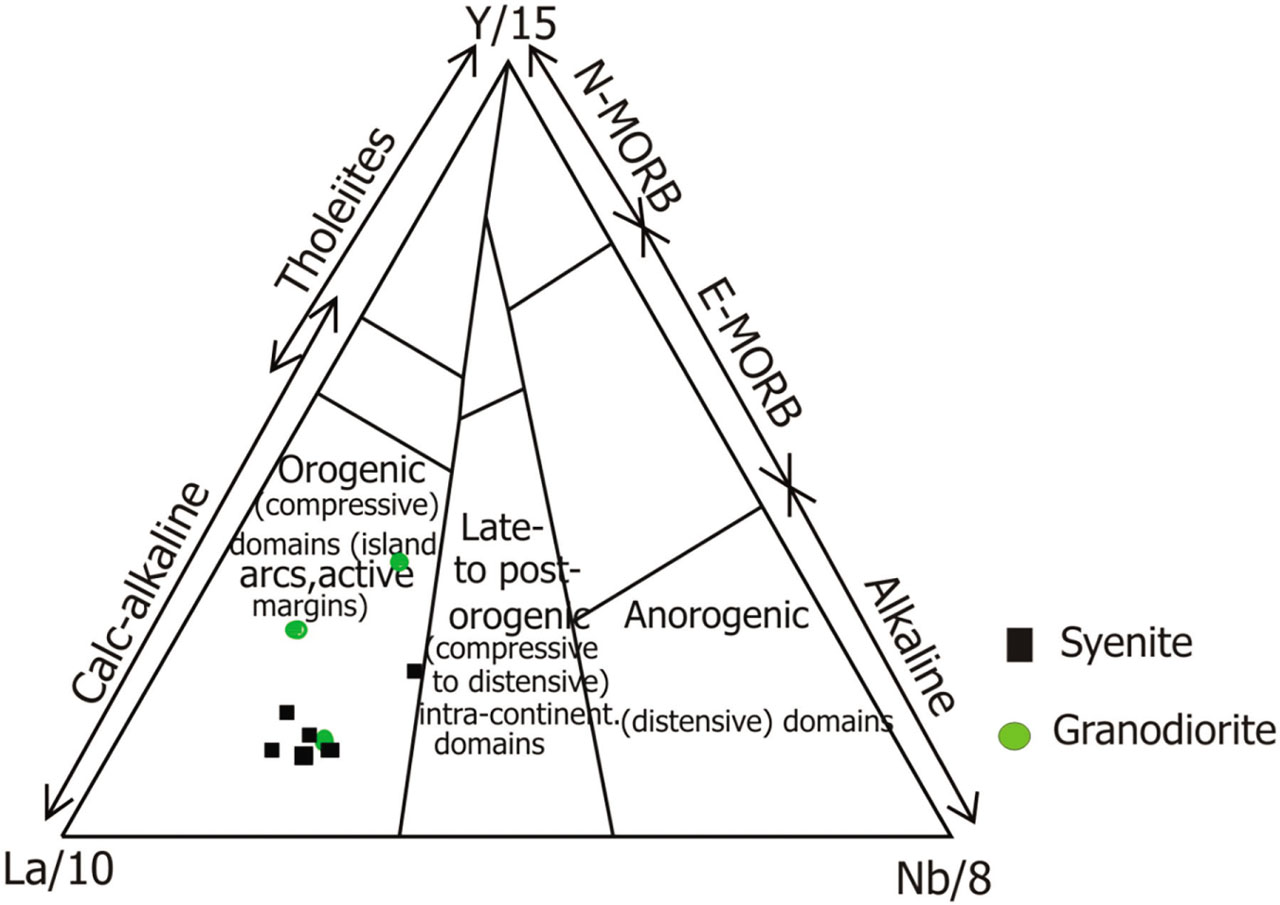
Figure 10:
The trilinear plot of La/10-Y/15-Nb/8 from Cabanis & Lecolle [33] describes geodynamic boundaries for the rocks of the study.
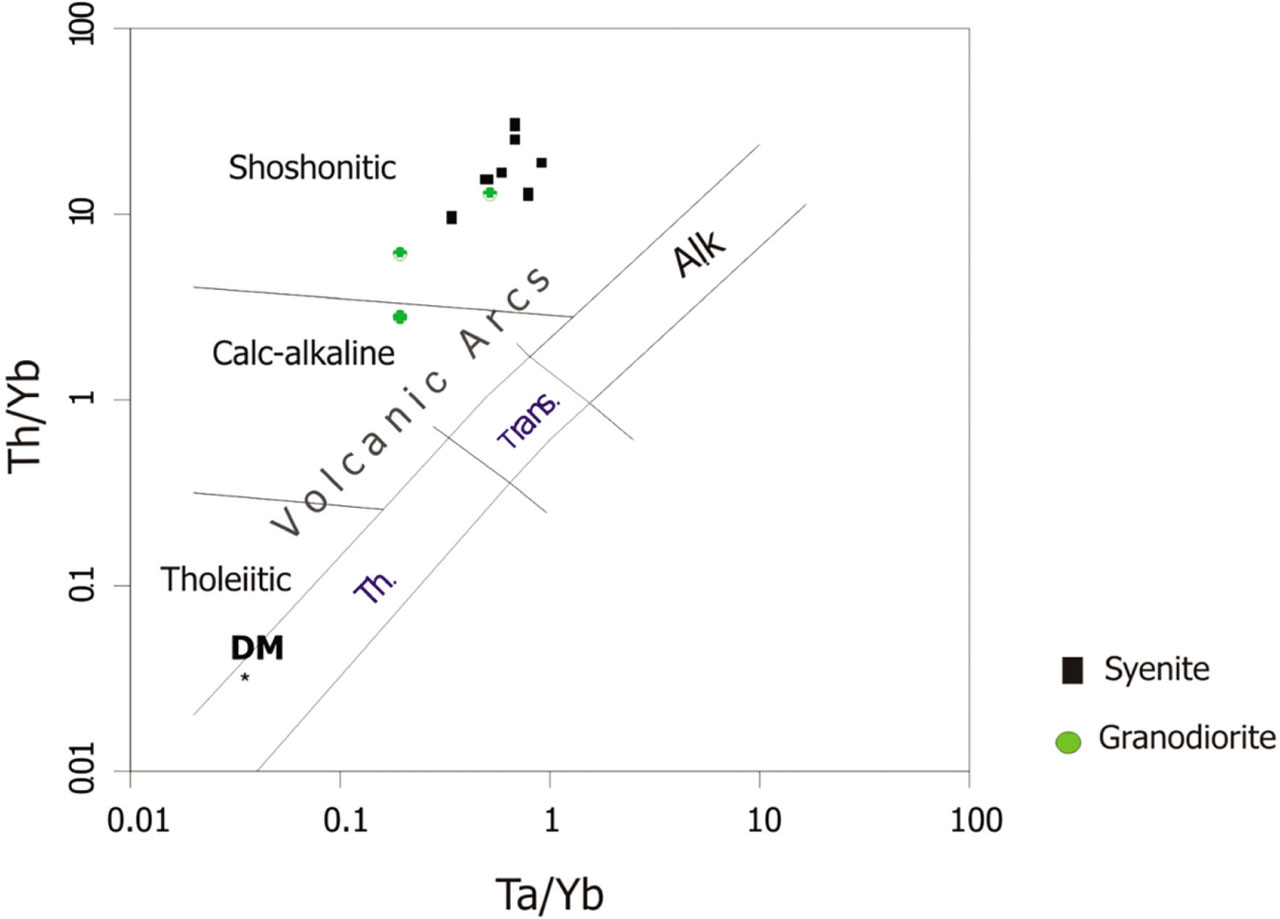
Figure 11:
Ta/Yb vs. Th/Yb diagram characterising magma from volcanic arcs [34].
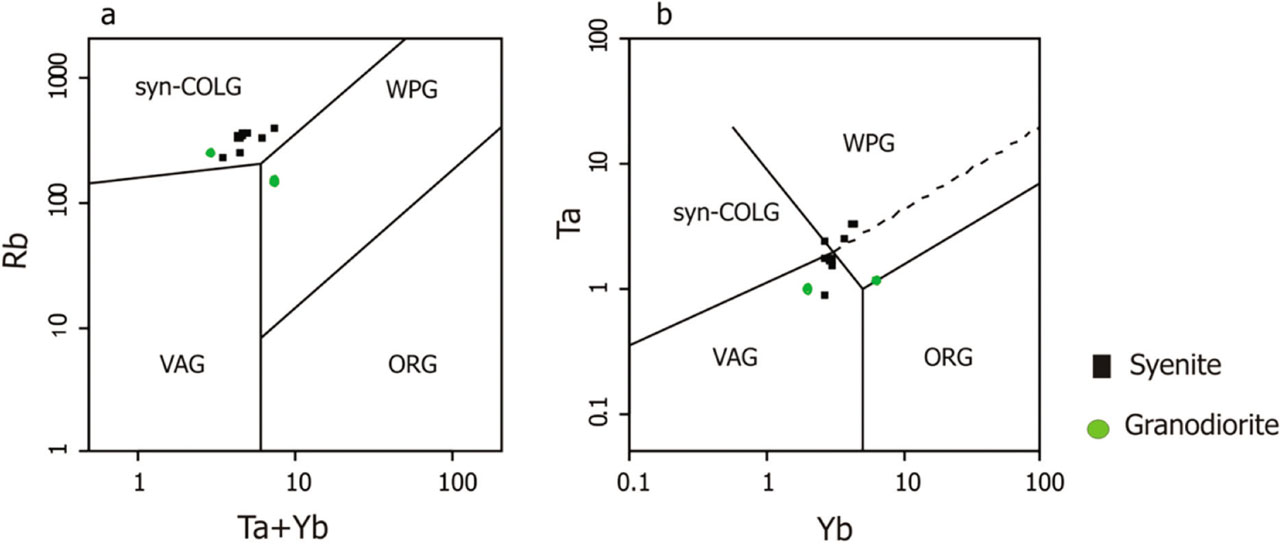
Figure 12:
Granite tectonic discrimination diagram suggests post-orogenic environment for the granitoid rocks of the study [12].
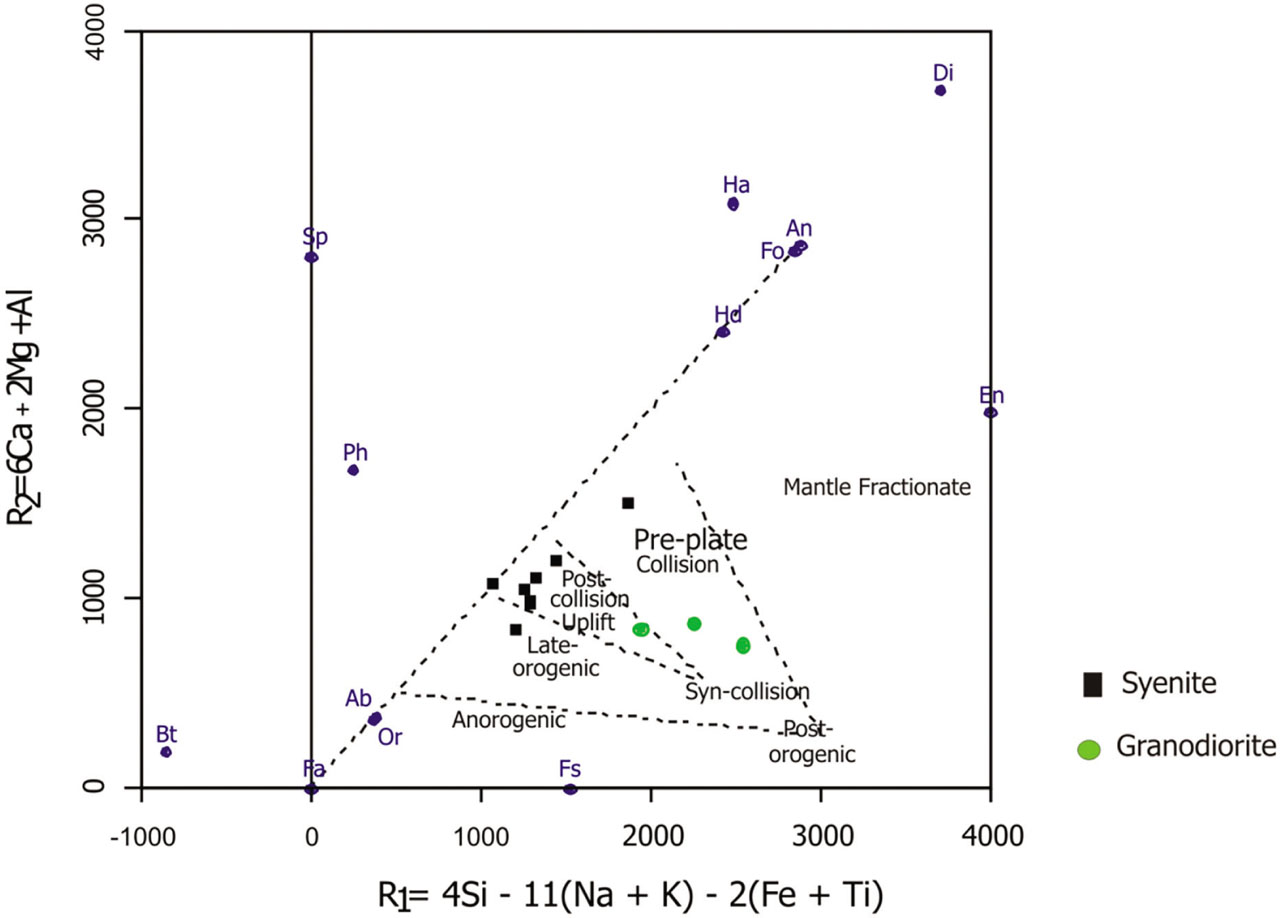
Figure 13:
R1 = (4Si – 11(Na + K) – 2(Fe + Ti) vs. R2 = (6Ca + 2Mg + Al) diagram discriminates geotectonic environment for rocks of the study (after Batchelor & Bowden [35]).
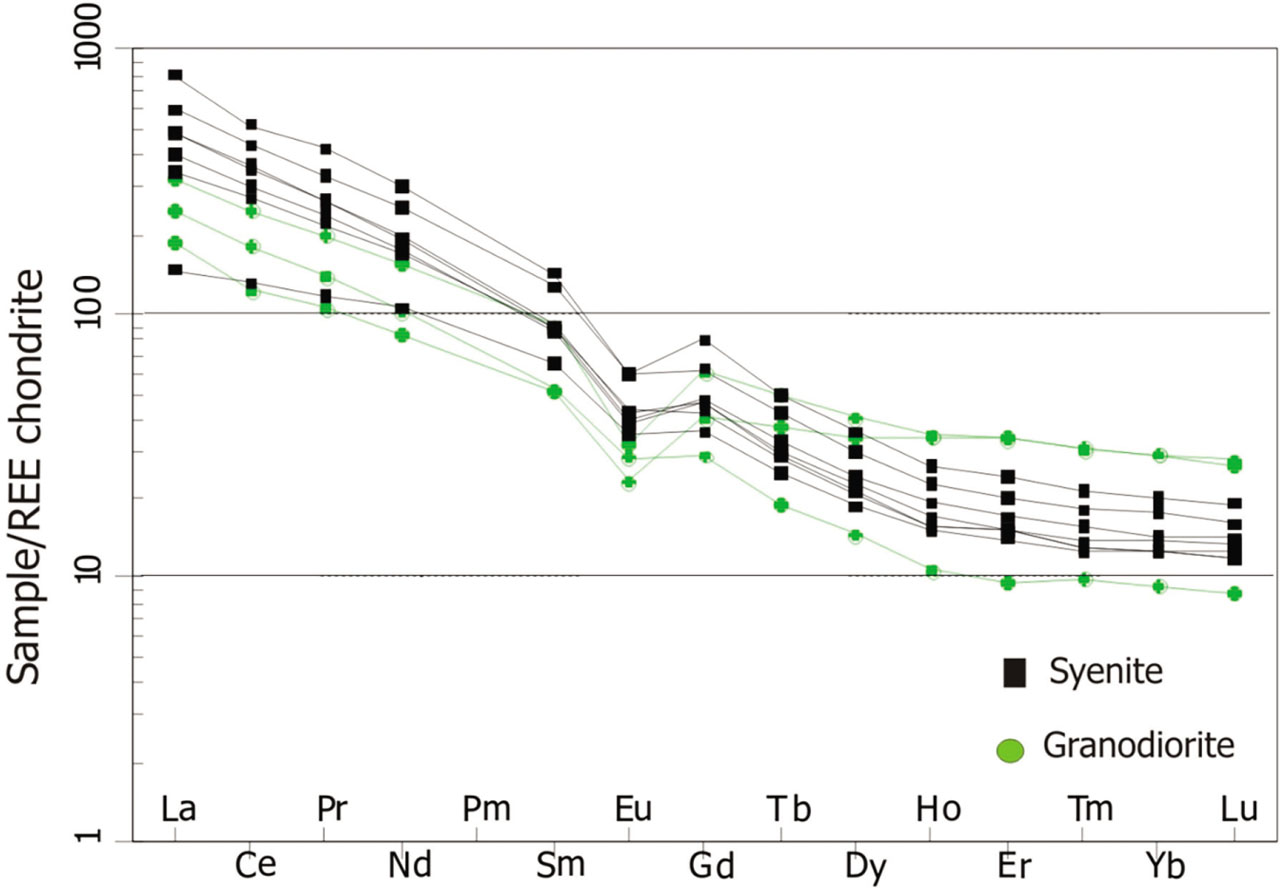
Figure 14:
REE plot normalised using Boynton's [39] chondrite values.
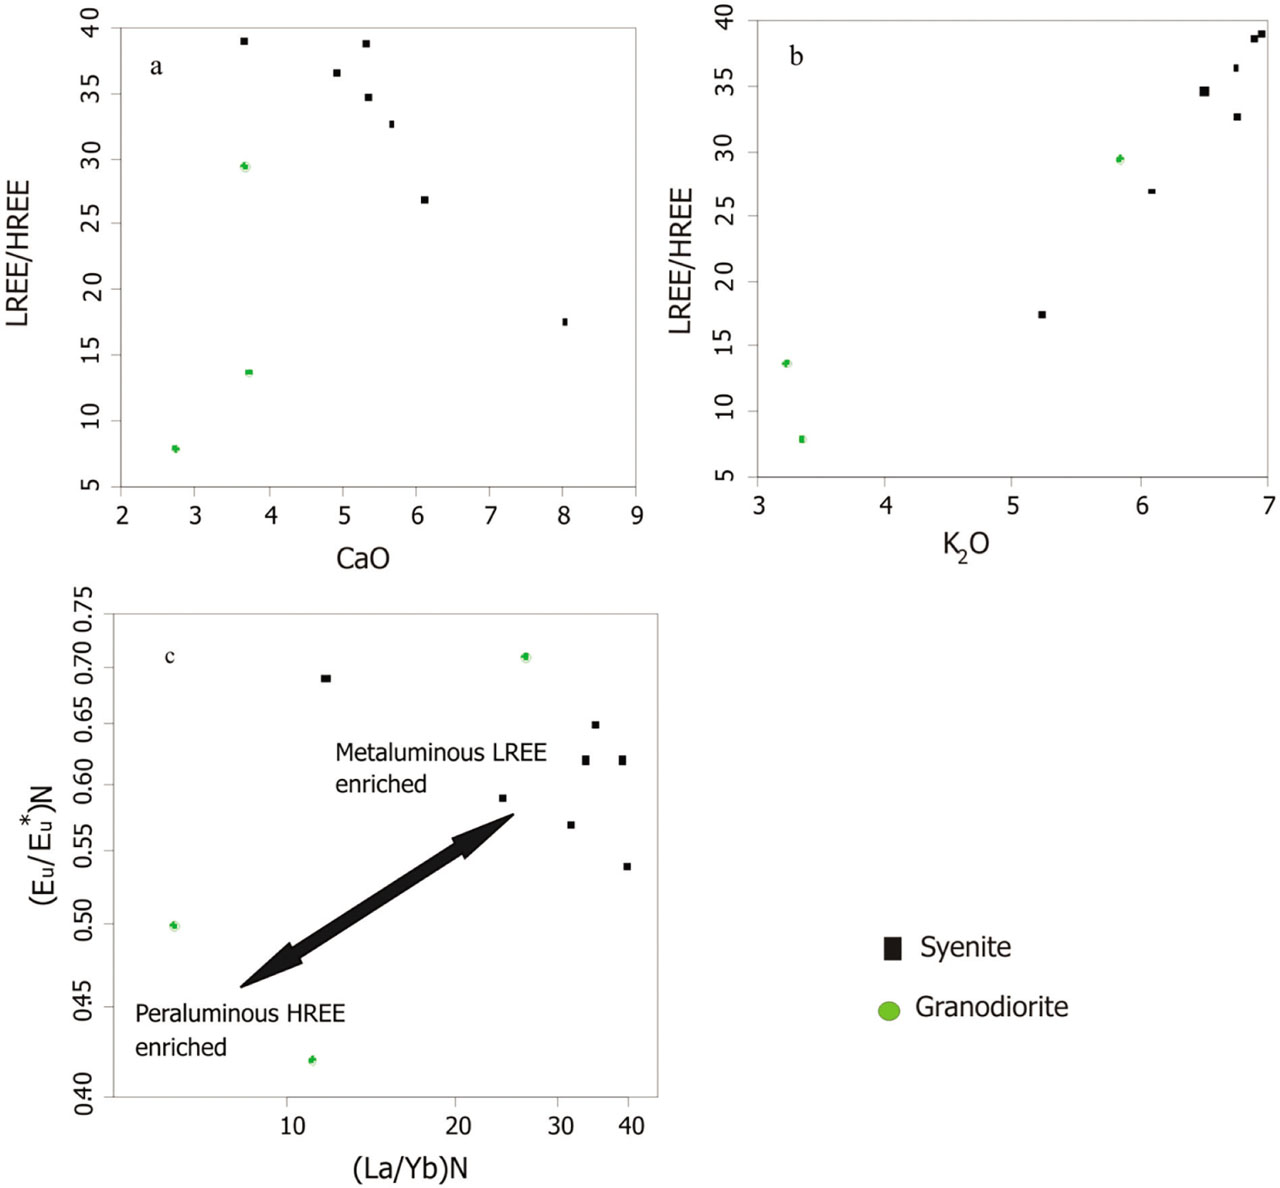
Figure 15:
a) CaO vs. LREE/HREE; b) K2O vs. LREE/HREE, and; c) (La/Yb)N vs. (Eu/Eu*)N.