
Table 1.
Demographic and baseline characteristics of the study population.
| Variables | Overall (n = 45) | Very high CV risk (n = 39) | High CV risk (n = 6) | p-value |
|---|---|---|---|---|
| Men, n (%) | 18 (40%) | 14 (36%) | 4 (67%) | 0.199 |
| Age, years (mean ± SD) | 57.4 ± 13.6 | 60.6 ± 10.9 | 36.8 ± 12.0 | <0.001 * |
| Weight, kg (mean ± SD) | 82.8 ± 15.7 | 83.5 ± 16.3 | 78.8 ± 11.7 | 0.508 |
| Body mass index, kg/m2 (mean ± SD) | 29.1 ± 5.2 | 29.6 ± 5.2 | 25.7 ± 4.5 | 0.084 |
| Current smoking, n (%) | 6 (13%) | 6 (15%) | 0 (0%) | 0.576 |
| ASCVD, n (%) | 28 (62%) | 28 (72%) | 0 (0%) | 0.002 * |
| Diabetes mellitus, n (%) | 22 (49%) | 22 (56%) | 0 (0%) | 0.022 * |
| Arterial hypertension, n (%) | 35 (78%) | 35 (90%) | 0 (0%) | <0.001 * |
| Obesity, n (%) | 19 (42%) | 19 (49%) | 0 (0%) | 0.032 * |
| Familial hypercholesterolemia, n (%) | 24 (53%) | 18 (46%) | 6 (100%) | 0.023 * |
Table 2.
Oral and injectable lipid-lowering medication at baseline (the moment when the PCSK9 inhibitor was initiated) and at follow-up assessment.
| Variables | Baseline (n = 45) | Follow-up (n = 45) | p-value |
|---|---|---|---|
| Oral lipid-lowering medication, n (%) | N/A | N/A | N/A |
| None | 8 (18%) | 6 (13%) | 0.754 |
| Any statin | 35 (78%) | 37 (82%) | 0.688 |
| High-dose atorvastatin | 14 (31%) | 12 (27%) | 0.625 |
| Moderate- or low-dose atorvastatin | 2 (4%) | 6 (13%) | 0.219 |
| High-dose rosuvastatin | 16 (36%) | 14 (31%) | 0.625 |
| Moderate- or low-dose rosuvastatin | 3 (7%) | 5 (11%) | 0.625 |
| Ezetimibe | 22 (49%) | 20 (44%) | 0.727 |
| Any statin plus ezetimibe | 20 (44%) | 18 (40%) | 0.625 |
| Injectable PCSK9 inhibitor, n (%) | N/A | N/A | N/A |
| Alirocumab 75 mg | 35 (78%) | 25 (56%) | 0.002 * |
| Alirocumab 150 mg | 1 (2%) | 11 (24%) | 0.002 * |
| Evolocumab 140 mg | 6 (13%) | 6 (13%) | 1.000 |
| Inclisiran 284 mg | 3 (7%) | 3 (7%) | 1.000 |
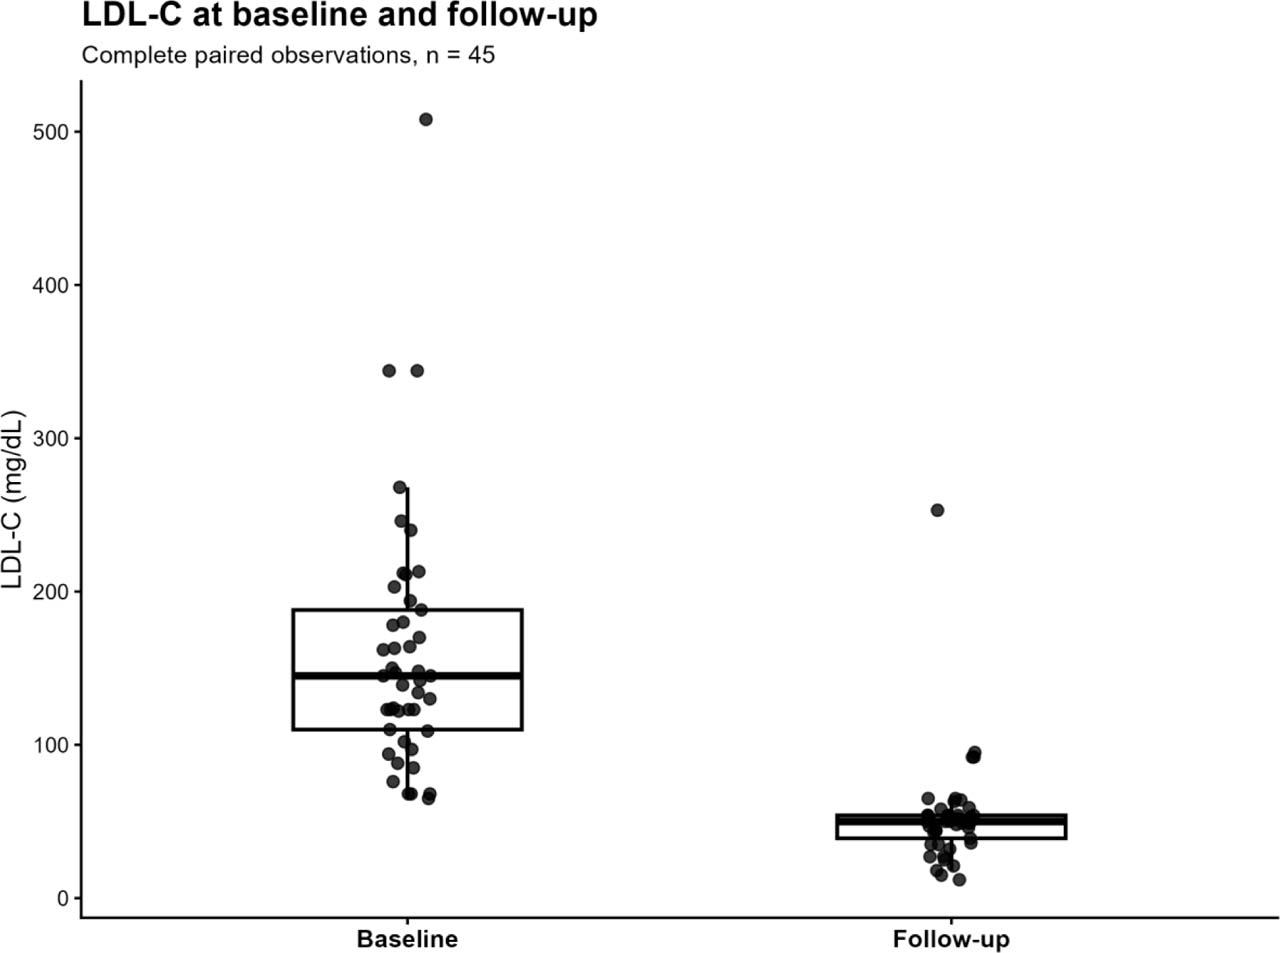
Figure 1.
LDL-C values at baseline (the moment when the PCSK9 inhibitor was initiated) and at the best achieved value at follow-up (first value at threshold or, for patients not reaching threshold, the lowest value).
Table 3.
Biochemical parameters at baseline and at follow-up.
| Variables | Baseline (n = 45) | Follow-up (n = 45) | p-value |
|---|---|---|---|
| Lipid profile | N/A | N/A | N/A |
| LDL-C, mg/dL | 145 (110; 188) | 50 (39; 54) | <0.001 * |
| Total cholesterol, mg/dL | 219 (186; 284) | 120 (110; 134) | <0.001 * |
| HDL-cholesterol, mg/dL | 48 (42; 56) | 48 (42; 55) | 0.920 |
| Triglycerides, mg/dL | 148 (105; 190) | 105 (74; 155) | <0.001 * |
| Transaminases | N/A | N/A | N/A |
| AST, IU/L | 26 (21; 34) | 25 (21; 31) | 0.907 |
| ALT, IU/L | 27 (18; 40) | 27 (20; 40) | 0.536 |
| Estimated glomerular filtration rate, mL/min/1.73 m2 | 84.5 ± 19.9 | 82.5 ± 20.8 | 0.342 |
| Fasting glycemia, mg/dL | 105 (91; 124) | 96.7 (88; 112) | 0.011 * |
| Total CK, IU/L (n = 19) | 97 (76; 124.5) | 97 (75; 123) | 0.955 |
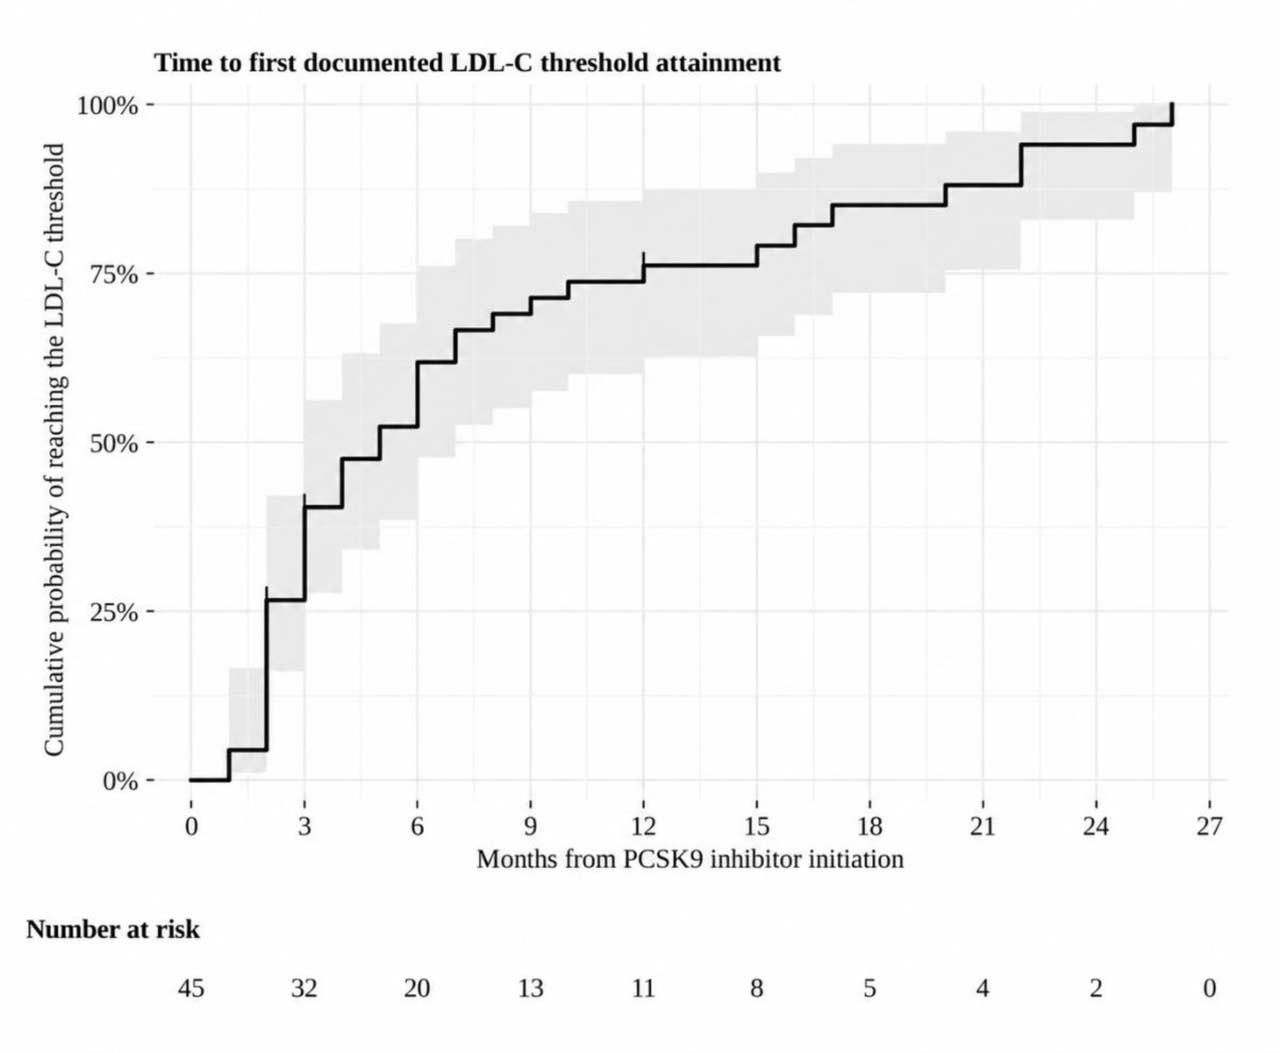
Figure 2.
Cumulative proportion of patients reaching first documented attainment of risk-specific absolute LDL-C threshold, described using Kaplan-Meier methods (n=45; four patients not reaching the threshold were censored at their last available follow-up). Shaded area: 95% confidence interval. Numbers at risk are shown below the plot. Threshold attainment at fixed time points is shown in Table 4.
Table 4.
LDL-cholesterol at standardized time points after initiation of the PCSK9 inhibitor and best achieved value.
| Variables | Baseline | At time point | p-value |
|---|---|---|---|
| 3 months (n = 42) | N/A | N/A | N/A |
| LDL-cholesterol, mg/dL | 140 (109; 186) | 62 (49; 82) | < 0.001 * |
| Below threshold, n (%) | – | 22 (52%) | – |
| 6 months (n = 38) | N/A | N/A | N/A |
| LDL-cholesterol, mg/dL | 148 (123; 201) | 54 (36; 108) | < 0.001 * |
| Below threshold, n (%) | – | 19 (50%) | – |
| 12 months (n = 34) | N/A | N/A | N/A |
| LDL-cholesterol, mg/dL | 146 (123; 201) | 76 (48; 97) | < 0.001 * |
| Below threshold, n (%) | – | 13 (38%) | – |
| 18 months (n = 28) | N/A | N/A | N/A |
| LDL-cholesterol, mg/dL | 148 (123; 206) | 62 (51; 80) | < 0.001 * |
| Below threshold, n (%) | – | 10 (36%) | – |
| 24 months (n = 23) | N/A | N/A | N/A |
| LDL-cholesterol, mg/dL | 142 (116; 187) | 63 (48; 76) | < 0.001 * |
| Below threshold, n (%) | – | 13 (57%) | – |
| Last follow-up † (n = 45) | N/A | N/A | N/A |
| LDL-cholesterol, mg/dL | 145 (110; 188) | 60 (48; 92) | < 0.001 * |
| Below threshold, n (%) | – | 19 (42%) | – |
| Best achieved ‡ (n = 45) | N/A | N/A | N/A |
| LDL-cholesterol, mg/dL | 145 (110; 188) | 50 (39; 54) | < 0.001 * |
| Below threshold, n (%) | – | 41 (91%) | – |
Values are median (Q1; Q3) unless otherwise stated. n = number of patients with an available LDL-cholesterol value at each time point; LDL = low-density lipoprotein; PCSK9 = proprotein convertase subtilisin/kexin type 9. Risk-specific absolute LDL-cholesterol threshold: < 55 mg/dL for very high and < 70 mg/dL for high cardiovascular risk. Of the 7 missing 6-month values, 6 were not available in the records and 1 was not yet due at the end of data collection.
Table 5.
Linear regression analysis of predictors of the percentage LDL-C reduction.
| Predictor | β (95% CI) | F (1, 38) | p-value | ηp2 |
|---|---|---|---|---|
| Baseline LDL-C, per 1 mg/dL | 0.09 (−0.003 to 0.19) | 3.86 | 0.057 | 0.092 |
| Age, per 1 year | 0.64 (−0.05 to 1.32) | 3.54 | 0.068 | 0.085 |
| Diabetes mellitus | −13.17 (−30.98 to 4.64) | 2.24 | 0.143 | 0.056 |
| Male sex | 6.72 (−10.27 to 23.72) | 0.64 | 0.428 | 0.017 |
| High-intensity statin at follow-up | −6.28 (−21.20 to 8.64) | 0.73 | 0.400 | 0.019 |
| Ezetimibe at follow-up | 5.15 (−11.25 to 21.55) | 0.40 | 0.529 | 0.011 |