
Table 1.
QT-prolonging medications in the study population (n=277)
| Drug category | Drug (n) | CredibleMeds risk class |
|---|---|---|
| Macrolides | Azithromycin (68) | Known |
| Fluoroquinolones | Levofloxacin (6); Ciprofloxacin (4); Ofloxacin (4) | Known / Possible |
| Antimalarials | Hydroxychloroquine (5) | Known |
| Antiarrhythmics | Disopyramide (2); Amiodarone (2) | Known |
| Antifungals | Fluconazole (1) | Known |
| Beta-blockers | Various (22) | Conditional |
| Loop diuretics | Furosemide (21) | Conditional |
| H2 antagonists | Famotidine (29) | Conditional |
| SSRIs | Fluoxetine (6) | Conditional |
| Thiazides | Hydrochlorothiazide (4); Indapamide (2) | Conditional |
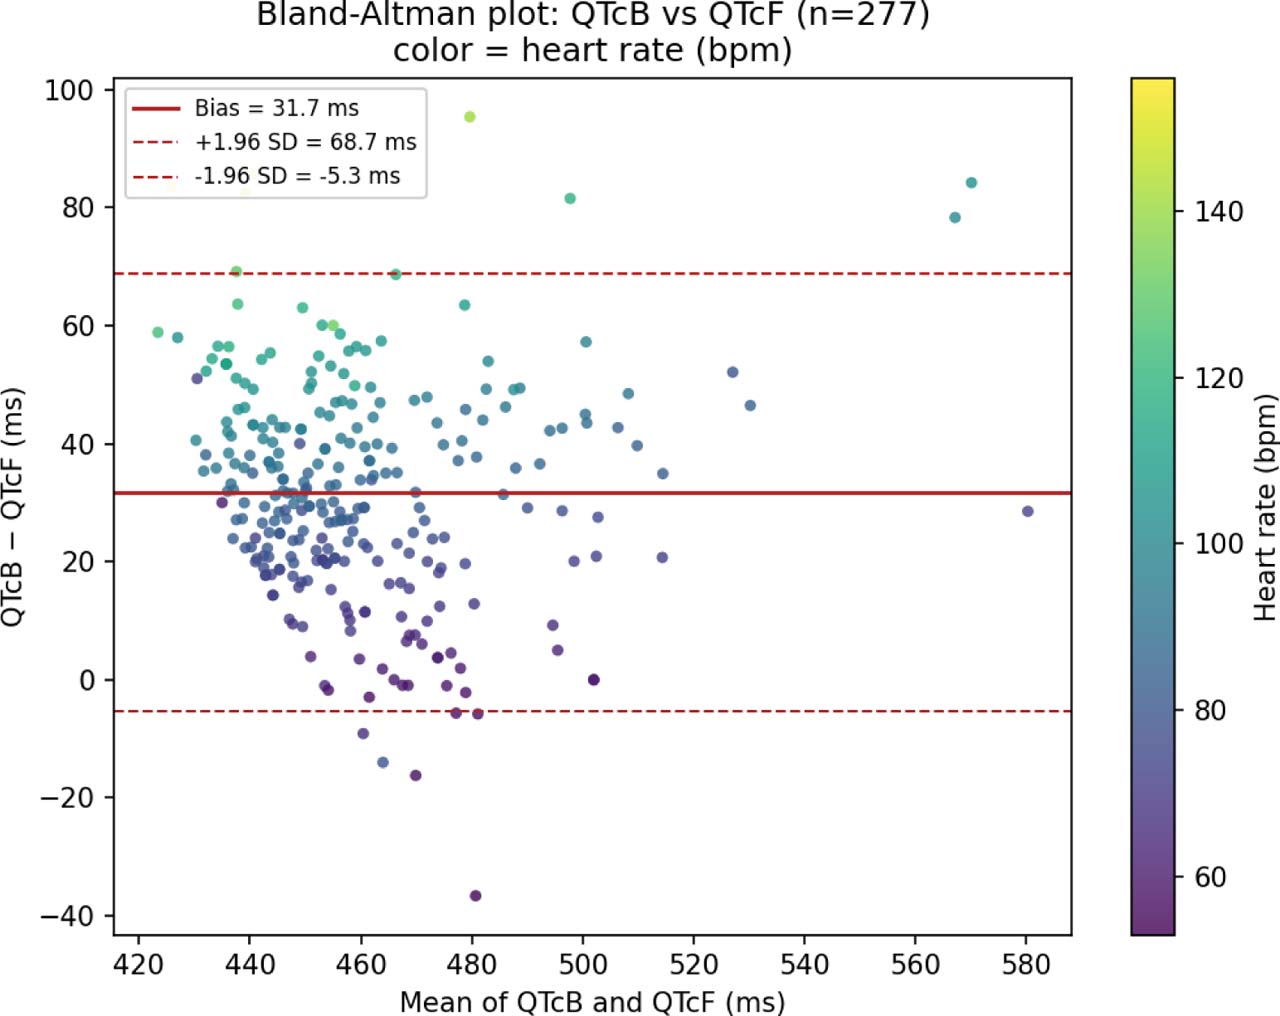
Figure 1.
Bland-Altman plot comparing QTcB and QTcF corrections (n=277). Mean bias +31.7 ms (SD 18.9 ms; 95% limits of agreement: −5.3 to +68.7 ms). Point color indicates heart rate (bpm); the discrepancy between formulas increased markedly with heart rate (r=0.92, p<0.001), confirming heart-rate-dependent overcorrection by Bazett's formula.
Table 2.
Univariate analysis: variables associated with QTcF-confirmed QT prolongation
| Variable | Isolated QTcB (n=199) | QTcF-confirmed (n=78) | p-value |
|---|---|---|---|
| Age (years) | 57.8 ±17.2 | 62.9 ±11.9 | 0.005 |
| Female sex | 112 (56.3%) | 38 (48.7%) | 0.32 |
| Hypertension | 75 (37.7%) | 46 (59.0%) | 0.002 |
| Ischemic stroke | 14 (7.1%) | 13 (16.7%) | 0.03 |
| Dyslipidemia | 39 (19.6%) | 24 (30.8%) | 0.07 |
| Beta-blocker use | 8 (4.5%) | 14 (18.0%) | <0.001 |
| Hydroxychloroquine | 2 (1.0%) | 3 (3.9%) | 0.28 |
| Creatinine clearance (ml/min) | 82.5 ±33.3 | 72.5 ±34.8 | 0.02 |
| Serum potassium (mmol/L) | 3.9 ±0.6 | 4.0 ±0.7 | 0.42 |
| Serum calcium (mmol/L) | 2.2 ±0.2 | 2.2 ±0.4 | 0.13 |
| Fasting glucose (mmol/L) | 10.8 ±7.7 | 12.2 ±8.1 | 0.07 |
[i] Age was compared using Welch's t-test (unequal variances); serum calcium and fasting glucose were compared using the Mann-Whitney U test given their skewed distributions; all other continuous variables were compared using Student's t-test and categorical variables using the chi-square or Fisher's exact test, as appropriate.
Table 3.
Multivariable logistic regression for QTcF-confirmed QT prolongation — complete-case analysis (n=96: 33 QTcF-confirmed, 63 isolated QTcB)
| Variable | OR | 95% CI | p-value |
|---|---|---|---|
| Serum bicarbonate (mmol/L) | 1.121 | 0.991–1.268 | 0.069 |
| Hypertension | 2.522 | 0.875–7.275 | 0.087 |
| Ischemic stroke | 1.598 | 0.303–8.438 | 0.581 |
| Beta-blocker use | 4.661 | 0.460–47.272 | 0.193 |
| Age (years) | 0.998 | 0.963–1.034 | 0.924 |
| Creatinine clearance (ml/min) | 0.996 | 0.981–1.012 | 0.642 |