
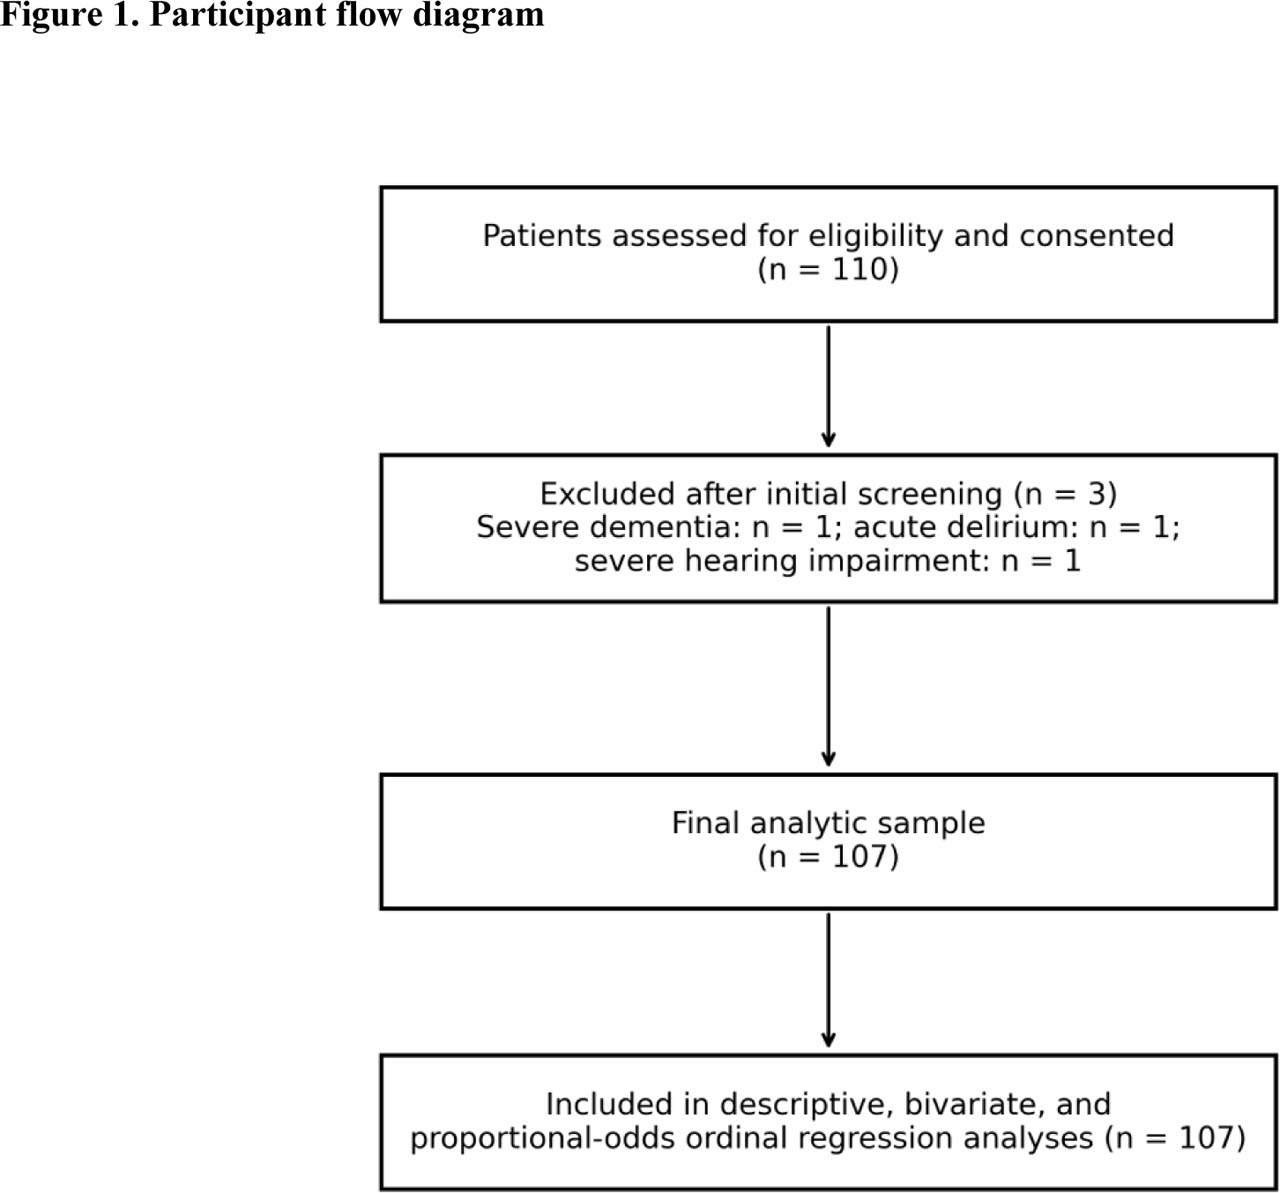
Figure 1.
Participant flow from eligibility assessment to final analytic sample.
Table 1.
Participant characteristics (n=107)
| Variable | Value |
|---|---|
| Age (years), mean ± SD | 67.6 ± 6.2 |
| Age category – 60 to 65 years, n (%) | 43 (40) |
| Age category – 66 to 70 years, n (%) | 26 (24) |
| Age category – Above 70 years, n (%) | 38 (36) |
| Female sex, n (%) | 59 (55) |
| Education (years), mean ± SD | 12.1 ± 3.1 |
| HF duration (months), median (min, max) | 34 (2, 46) |
| HF phenotype – HFpEF, n (%) | 81 (76) |
| HF phenotype – HFrEF, n (%) | 18 (17) |
| HF phenotype – HFmrEF, n (%) | 8 (8) |
| ACCI category – Moderate (3 to 4), n (%) | 79 (74) |
| ACCI category – High (≥5), n (%) | 28 (26) |
| Polypharmacy category – Non-polypharmacy (<5 medications), n (%) | 5 (5) |
| Polypharmacy category – Polypharmacy (5 to 9 medications), n (%) | 77 (72) |
| Polypharmacy category – Hyperpolypharmacy (≥10 medications), n (%) | 25 (23) |
| PIM burden – None (0 PIMs), n (%) | 8 (8) |
| PIM burden – Mild (1 PIM), n (%) | 21 (20) |
| PIM burden – Moderate (2 PIMs), n (%) | 36 (34) |
| PIM burden – Severe (≥3 PIMs), n (%) | 42 (39) |
| Cognitive category – Normal (MoCA-INA 26 to 30), n (%) | 13 (12) |
| Cognitive category – MCI (MoCA-INA 18 to 25), n (%) | 83 (78) |
| Cognitive category – Mild to moderate dementia (MoCA-INA 10 to 17), n (%) | 11 (10) |
[i] Abbreviations: ACCI, Age-Adjusted Charlson Comorbidity Index; HF, heart failure; HFpEF, heart failure with preserved ejection fraction; HFmrEF, heart failure with mildly reduced ejection fraction; HFrEF, heart failure with reduced ejection fraction; MCI, mild cognitive impairment; MoCA-INA, Montreal Cognitive Assessment–Indonesian version; PIM, potentially inappropriate medication; SD, standard deviation.
Table 2.
MoCA-INA domain scores (n=107)
| Domain (maximum score) | Mean ± SD |
|---|---|
| Visuospatial/executive (0 to 5) | 3.13 ± 1.12 |
| Naming (0 to 3) | 2.98 ± 0.14 |
| Attention (0 to 6) | 4.58 ± 1.24 |
| Language (0 to 3) | 2.19 ± 0.92 |
| Abstraction (0 to 2) | 1.28 ± 0.70 |
| Delayed recall (0 to 5) | 1.87 ± 1.39 |
| Orientation (0 to 6) | 5.78 ± 0.63 |
| Total MoCA-INA (0 to 30) | 21.97 ± 3.31 |
Table 3.
Fully adjusted proportional-odds ordinal logistic regression, Model 3 (n=107)
| Predictor | aOR | 95% CI | p-value |
|---|---|---|---|
| Polypharmacy category (per-level increase) | 2.88 | 0.82 to 10.08 | 0.10 |
| PIM burden (per-level increase) | 1.70 | 0.91 to 3.20 | 0.10 |
| Age (per 1-year increase) | 1.09 | 1.00 to 1.19 | 0.06 |
| Female sex (vs male) | 1.20 | 0.42 to 3.45 | 0.74 |
| Education (per 1-year increase) | 0.82 | 0.68 to 0.99 | 0.04 |
| HF duration (per 1-month increase) | 1.00 | 0.96 to 1.04 | 0.98 |
| High ACCI (≥5) vs moderate | 2.71 | 0.76 to 9.60 | 0.12 |
| HFrEF vs HFpEF | 6.10 | 1.25 to 29.87 | 0.03 |
| HFmrEF vs HFpEF | 2.24 | 0.31 to 16.01 | 0.42 |
[i] Higher aOR values indicate higher odds of a worse cognitive category. Model fit: AIC=134.7; BIC=164.1; McFadden R2=0.234; Nagelkerke R2=0.368. Abbreviations: ACCI, Age-Adjusted Charlson Comorbidity Index; AIC, Akaike information criterion; aOR, adjusted odds ratio; BIC, Bayesian information criterion; CI, confidence interval; HF, heart failure; HFpEF, heart failure with preserved ejection fraction; HFmrEF, heart failure with mildly reduced ejection fraction; HFrEF, heart failure with reduced ejection fraction; PIM, potentially inappropriate medication.
Table 4A.
Cognitive category by polypharmacy strata
| Category | n | Normal, n (%) | MCI, n (%) | Dementia, n (%) | MoCA-INA median (min, max) |
|---|---|---|---|---|---|
| Non-polypharmacy (<5 medications)a | 5 | 4 (80) | 1 (20) | 0 (0) | 26 (20, 27) |
| Polypharmacy (5 to 9 medications) | 77 | 8 (10) | 62 (81) | 7 (9) | 23 (10, 28) |
| Hyperpolypharmacy (≥10 medications) | 25 | 1 (4) | 20 (80) | 4 (16) | 22 (15, 26) |
Table 4B.
Cognitive category by Beers-2023 PIM burden strata
| Category | n | Normal, n (%) | MCI, n (%) | Dementia, n (%) | MoCA-INA median (min, max) |
|---|---|---|---|---|---|
| None (0 PIMs) | 8 | 4 (50) | 4 (50) | 0 (0) | 25 (21, 27) |
| Mild (1 PIM) | 21 | 4 (19) | 16 (76) | 1 (5) | 23 (12, 28) |
| Moderate (2 PIMs) | 36 | 4 (11) | 26 (72) | 6 (17) | 23 (10, 28) |
| Severe (≥3 PIMs) | 42 | 1 (2) | 37 (88) | 4 (10) | 22 (15, 26) |
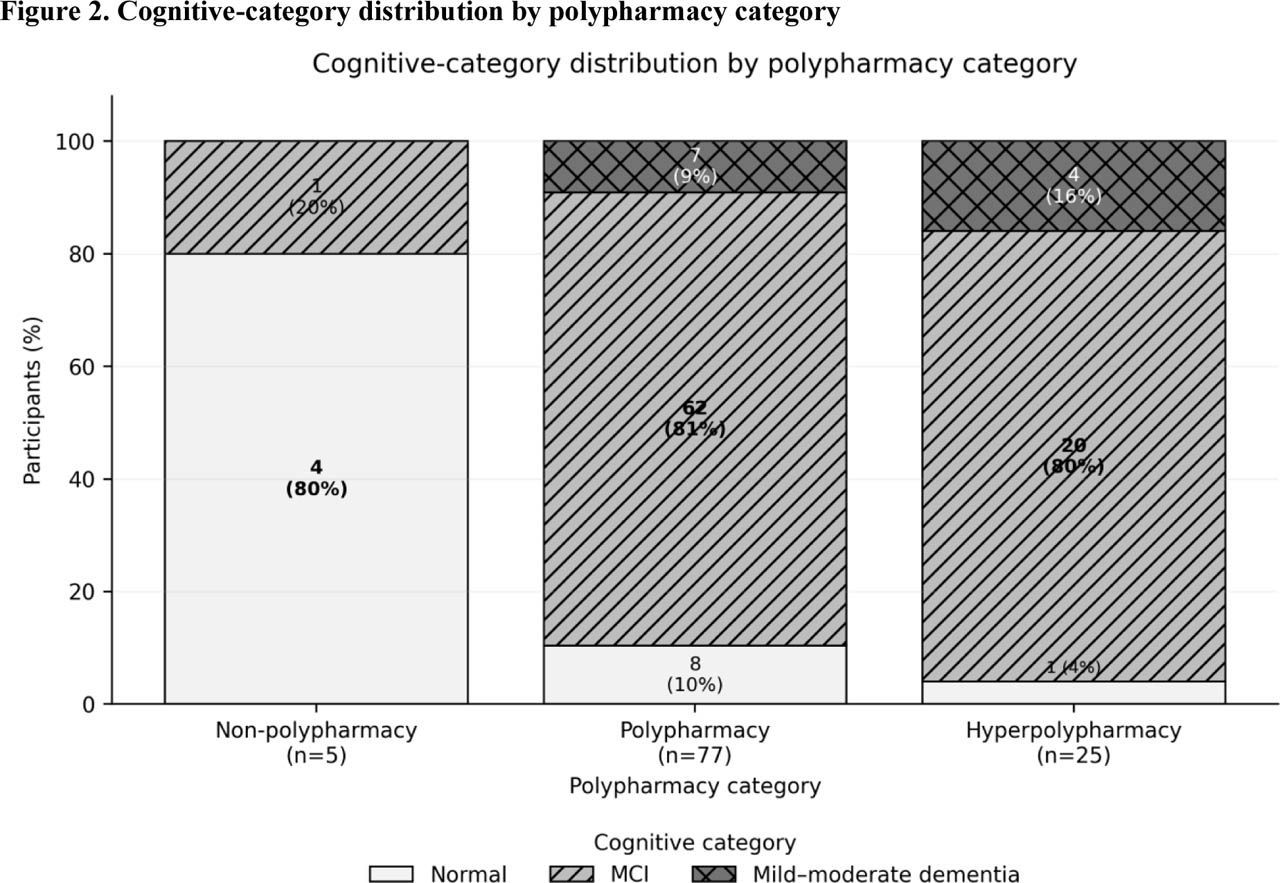
Figure 2.
Stacked bars use both direct labels and hatch patterns so categories remain distinguishable without color.
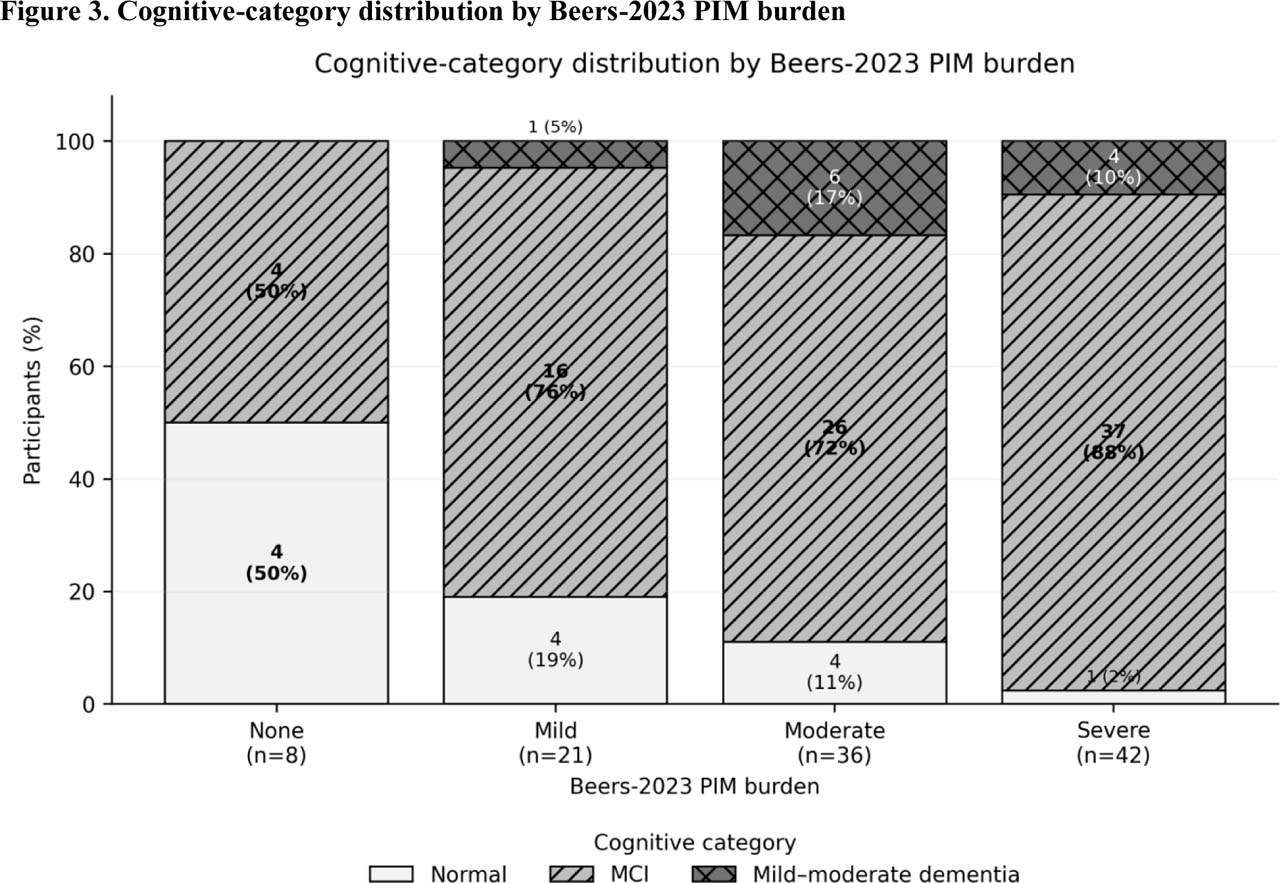
Figure 3.
Stacked bars use both direct labels and hatch patterns so categories remain distinguishable without color.
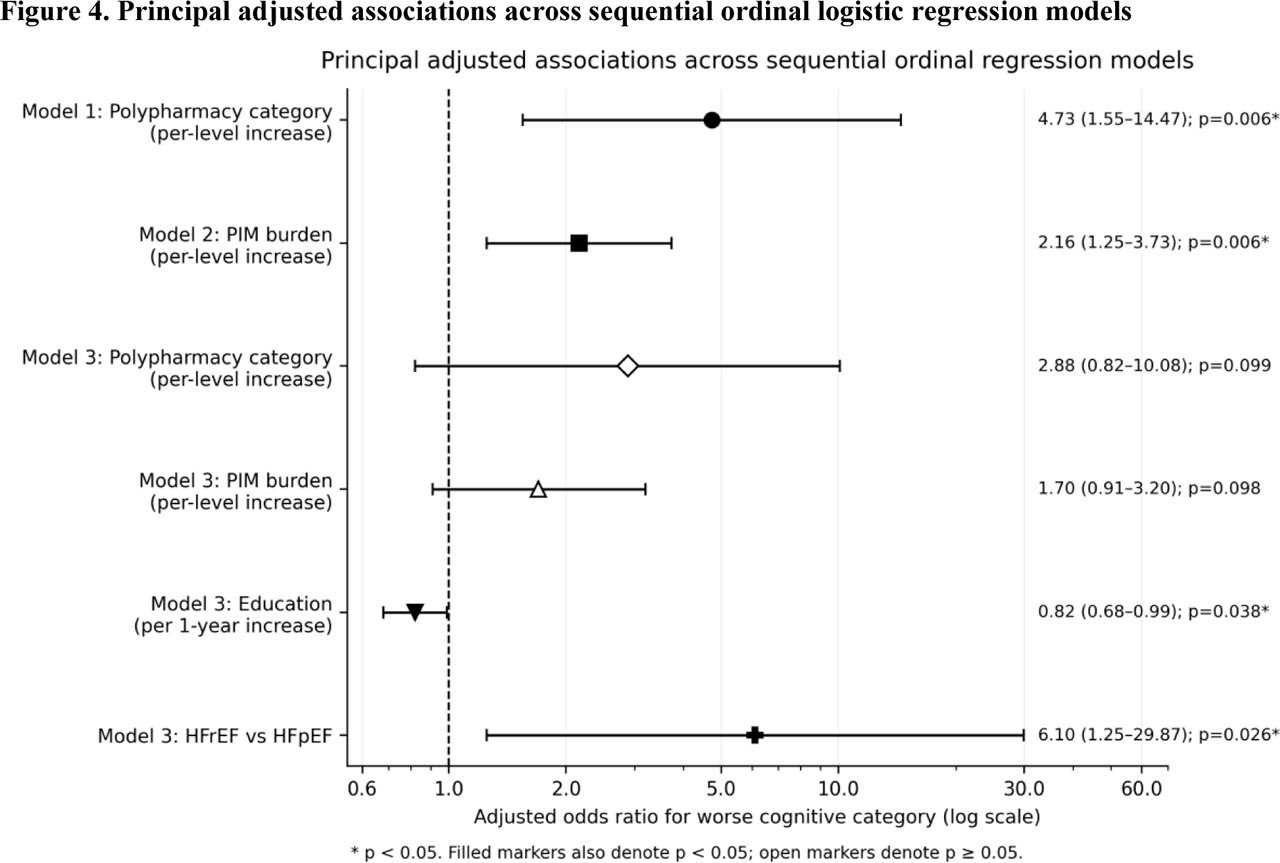
Figure 4.
Forest plot of selected adjusted odds ratios and 95% confidence intervals on a logarithmic scale. An asterisk and filled marker indicate p<0.05; exact estimates are printed next to each point.