
Table 1.
General characteristics of the patients.
| Variable | Results (121 patients) |
|---|---|
| Age, mean (SD) | 52.9 (12.4) |
| Sex, M (%) | 69 (57%) |
| Urban environment (%) | 83 (68.6%) |
| Smokers (%) | 38% |
| BMI, median (Q1-Q3) | 29.3 (27.11 – 32.19) |
| Age at diagnosis, median (Q1-Q3) | 34 (23 – 47) |
| Year of diagnosis, median (Q1-Q3) | 2010 (1997 – 2017) |
| Year of histopathological diagnosis, median (Q1-Q3) | 2018 (2011 – 2022) |
Table 2.
Comorbidities.
| Comorbidity | Prevalence |
|---|---|
| Obesity (%) | 55 (45.5%) |
| Arterial hypertension (%) | 50 (41.3%) |
| Diabetes mellitus (%) | 23 (19%) |
| HBV (%) | 7 (5.8%) |
| HCV (%) | 0 (0%) |
| HIV (%) | 1 (0.8%) |
| TB (%) | 15 (12.4%) |
| CKD (%) | 3 (2.5%) |
| COPD (%) | 1 (0.8%) |
| HF (%) | 0 (0%) |
| Chronic venous insufficiency (%) | 1 (0.8%) |
| Stroke (%) | 1 (0.8%) |
| Hepatic steatosis (%) | 89 (73.6%) |
| Malignancies (%) | 2 (1.7%) |
| Comorbidities (%) | 102 (84.3%) |
| Scalp involvement (%) | 97 (80.2%) |
| Genital involvement (%) | 42 (34.7%) |
| Nail involvement (%) | 61 (50.4%) |
| Psoriatic arthritis (%) | 62 (51.2%) |
| Positive familial history (%) | 30 (24.8%) |
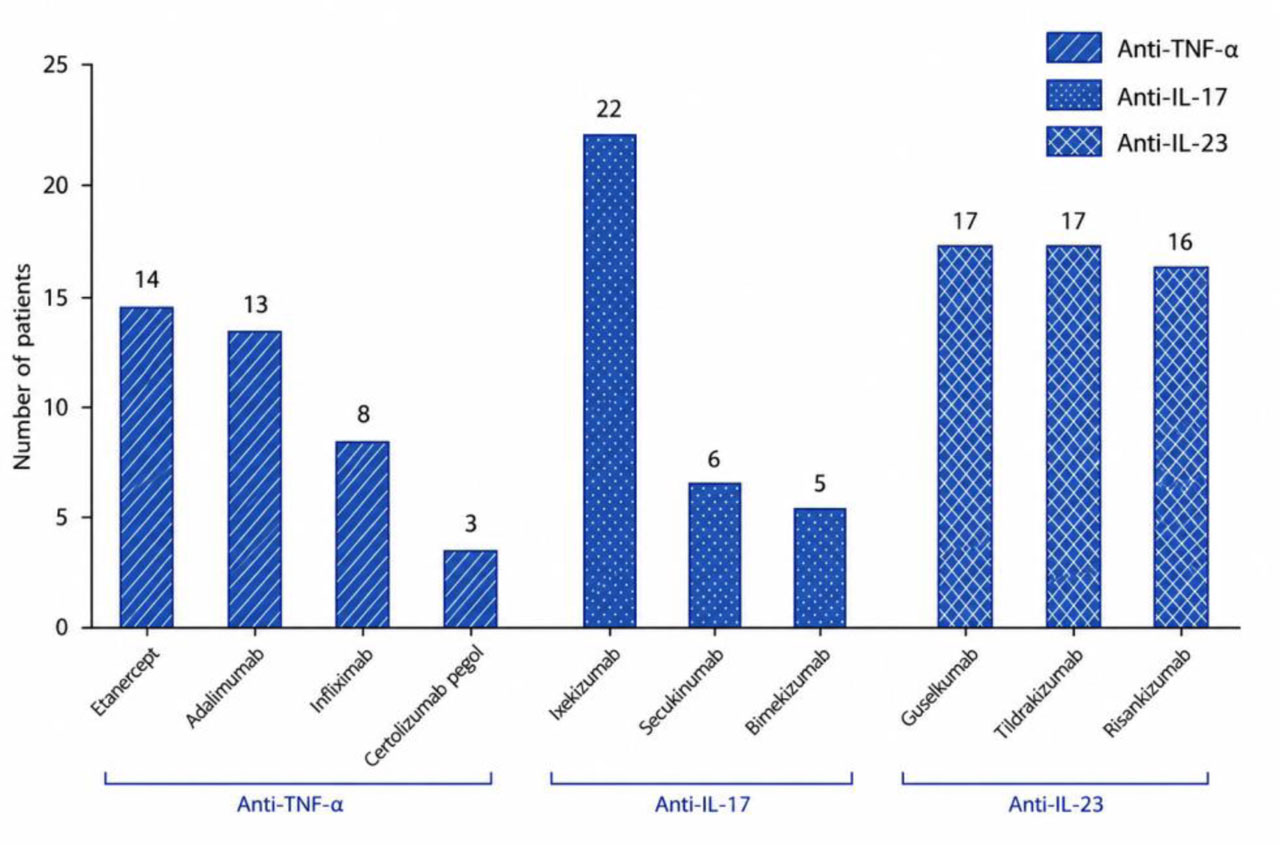
Figure 1.
Distribution of biologic therapies in the study population
Table 3.
Characteristics of the treatment.
| Variable | Results (121 patients) |
|---|---|
| Classic therapy* (years), median (Q1-Q3) | 3 (0–7) |
| Initiation of biologic therapy (year), median (Q1-Q3) | 2022 (2015–2023) |
| Time between diagnosis and initiation of biologic therapy (years), median (Q1-Q3) | 10 (4–20) |
| Total length of biologic therapy (years), median (Q1-Q3) | 3 (2–10) |
| Adalimumab | 13 (10.7%) |
| Infliximab | 8 (6.6%) |
| Etanercept | 14 (11.6%) |
| Certolizumab pegol | 3 (2.5%) |
| Ixekizumab | 22 (18.2%) |
| Secukinumab | 6 (5.0%) |
| Bimekizumab | 5 (4.1%) |
| Guselkumab | 17 (14.0%) |
| Risankizumab | 16 (13.2%) |
| Tildrakizumab | 17 (14.0%) |
| Number of biologic therapies, median (Q1-Q3) | 1 (1–1) |
| Switch of biologic therapy (%) | 18 (14.8%) |
| Length of first biologic therapy (years), median (Q1-Q3) | 3 (2–9.5) |
| Length of second biologic therapy (years), median (Q1-Q3) | 0 (0–0) |
| PASI_i, median (Q1-Q3) | 18.9 (15–22.3) |
| PASI_6 months, median (Q1-Q3) | 6 (1.45–12) |
| PASI_12 months, median (Q1-Q3) | 1.6 (0–6) |
| PASI switch 1**, median (Q1-Q3) | 17.2 (7.5–23.2) |
| PASI switch 2**, median (Q1-Q3) | 13 (5.4–15.8) |
| PASI_2025, median (Q1-Q3) | 0 (0–0) |
| DLQI_i, median (Q1-Q3) | 20 (17–24) |
| DLQI_6 months, median (Q1-Q3) | 8 (2–12) |
| DLQI_12 months, median (Q1-Q3) | 2 (0–6) |
| DLQI switch 1**, median (Q1-Q3) | 25 (17.8–32) |
| DLQI switch 2**, median (Q1-Q3) | 28 (23.1–30.9) |
| DLQI_2025, median (Q1-Q3) | 0 (0–0) |
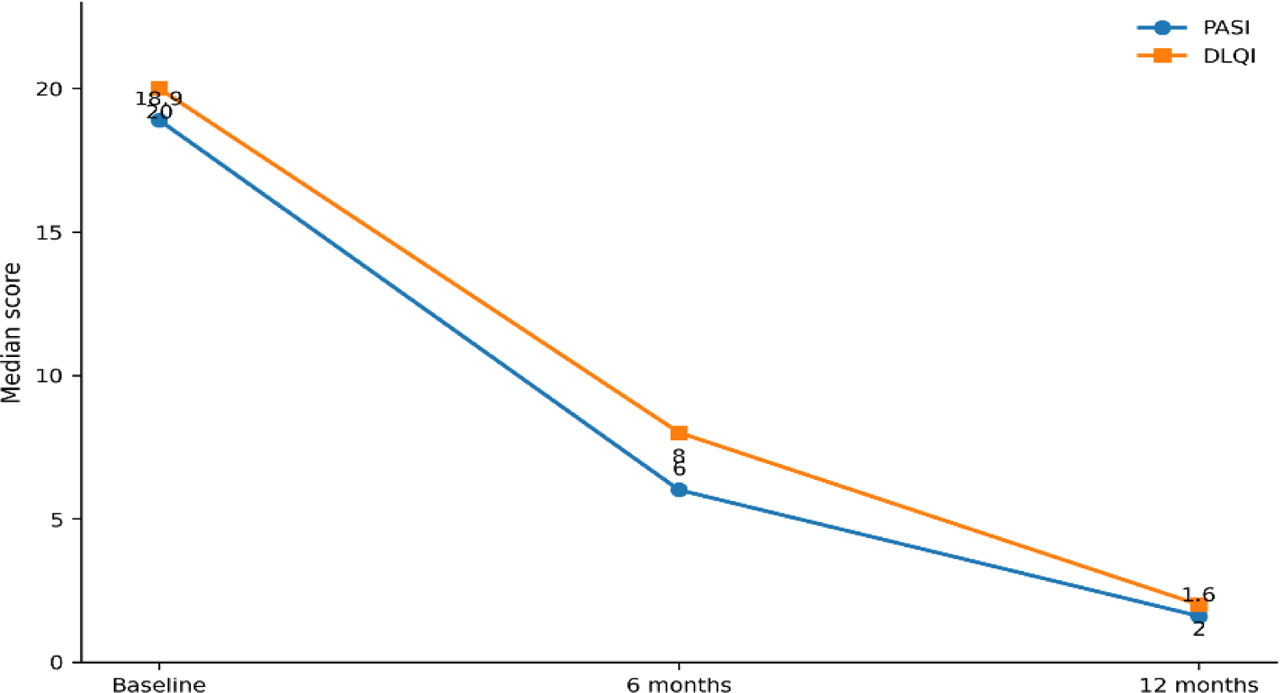
Figure 2.
Evolution of median PASI and DLQI scores during biologic therapy
Table 4.
Evolution of PASI and DLQI scores.
| Comparison | Md | z | p |
|---|---|---|---|
| PASI_6 months vs PASI_i | 7.43 versus 19.36 | −9.50 | <0.001 |
| PASI_12 months vs PASI_6 months | 3.07 versus 7.43 | −8.61 | <0.001 |
| PASI_2025 vs PASI_12 months | 0.83 versus 3.07 | −6.76 | <0.001 |
| DLQI_6 months vs DLQI_i | 7.85 versus 20.18 | −9.55 | <0.001 |
| DLQI_12 months vs DLQI_6 months | 3.15 versus 7.85 | −8.57 | <0.001 |
| DLQI_2025 vs DLQI_12 months | 0.40 versus 3.15 | −6.93 | <0.001 |
[i] DLQI – Dermatology Life Quality Index score; DLQI_i – initial DLQI from the moment of initiation of biologic therapy; Md – median of differences; p – statistical significance; PASI – Psoriasis Area and Severity Index score; PASI_i - initial PASI score from the moment of initiation of biologic therapy; z - standardized test statistic value.
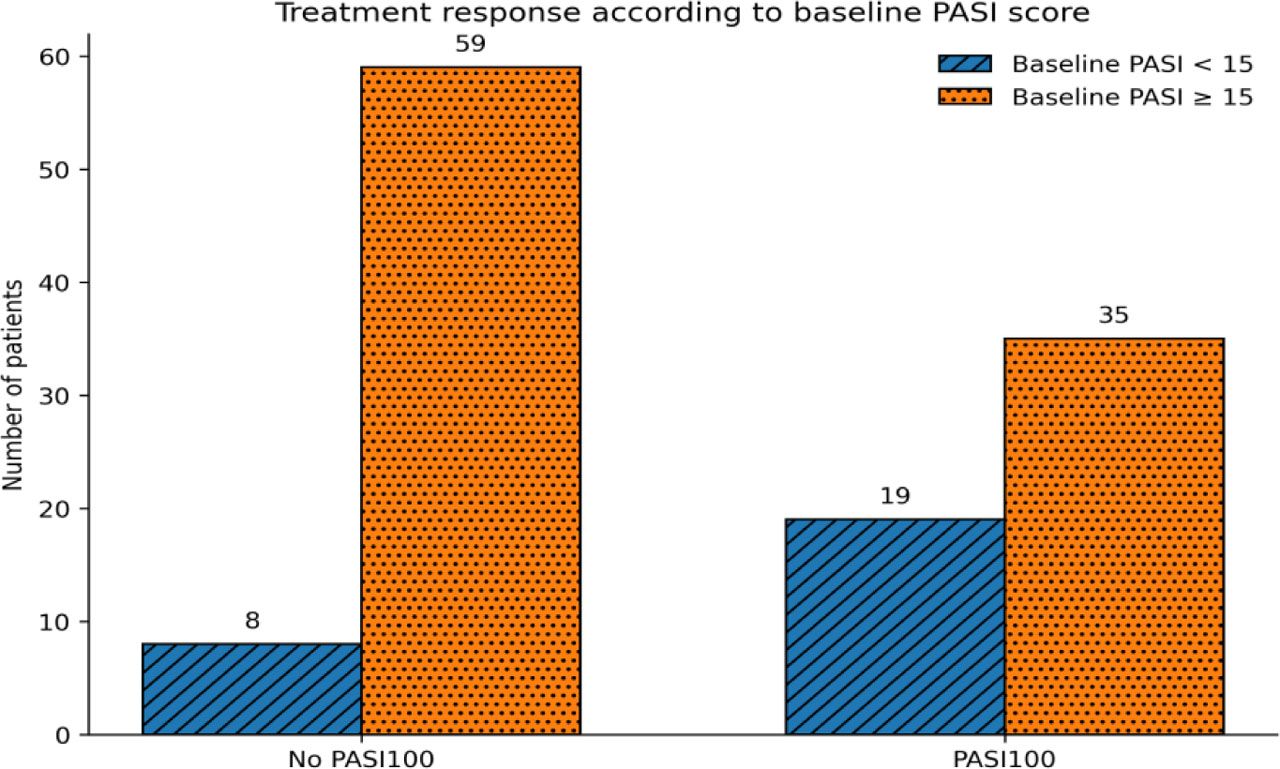
Figure 3.
Treatment response according to baseline PASI score
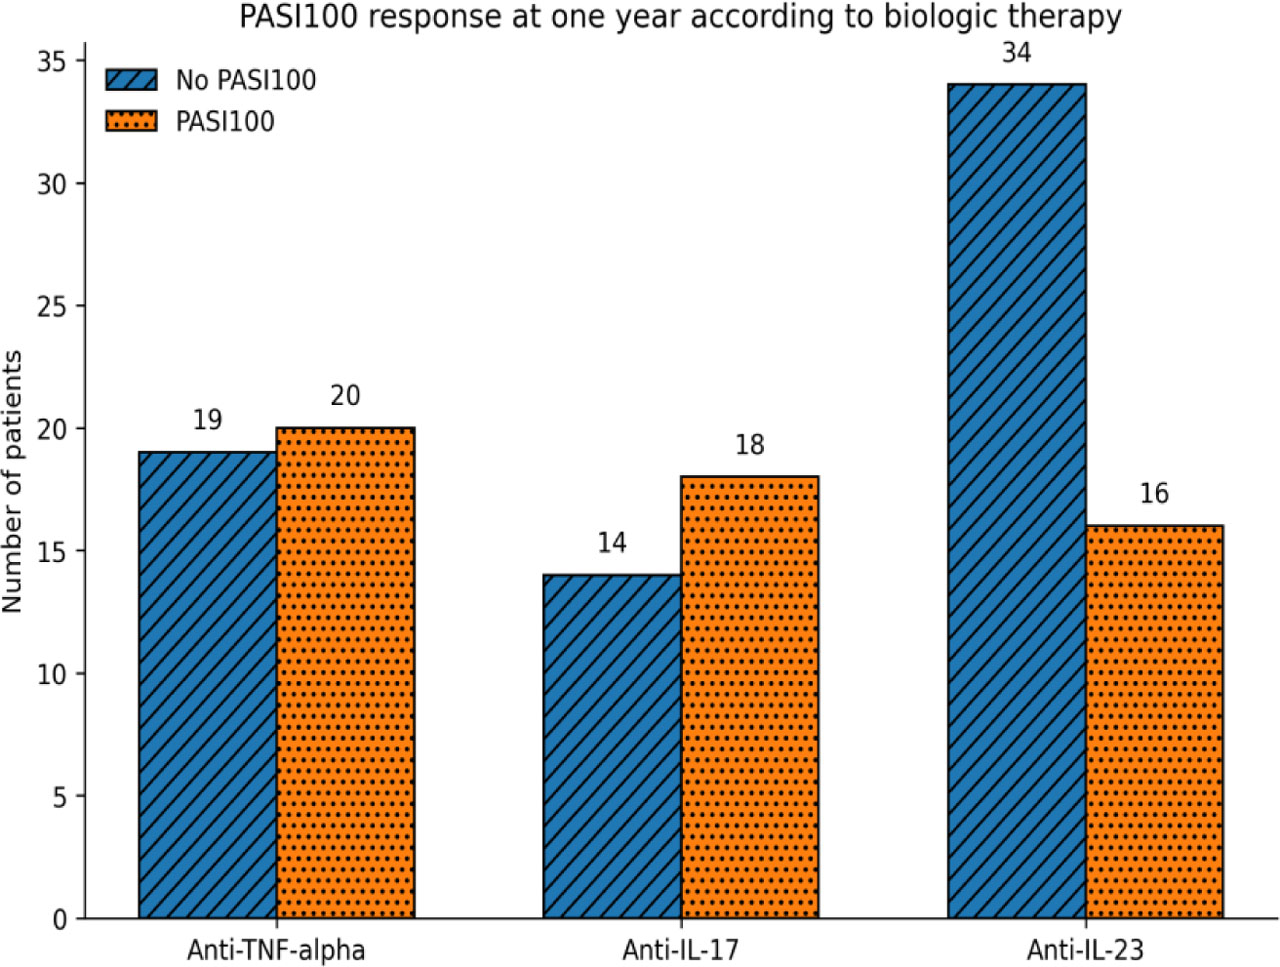
Figure 4.
PASI 100 response at one year according to biologic therapy