

Figure 1,2, 3.
MRI brain showed multiple bilateral infarcts in supratentorial and bilateral cerebral hemispheres watershed infarcts.
Table 1
Serial blood counts of the patient
| Hb | TLC | ANC | ALC | PLT | EOS | AEC |
|---|---|---|---|---|---|---|
| 10.4 | 27.82 | 8.59 | 1.95 | 230 | 15.89 | 57.1% |
| 9.4 | 22.94 | 6.78 | 1.88 | 175 | 13.16 | 57.40% |
| 10.2 | 18.43 | 16.39 | 0.94 | 284 | 0.03 | 0.20% |
| 9.20 | 12.06 | 10.95 | 0.57 | 231 | 0.03 | 0.20% |

Figure 4.
Bone marrow showing hypereosinophila.
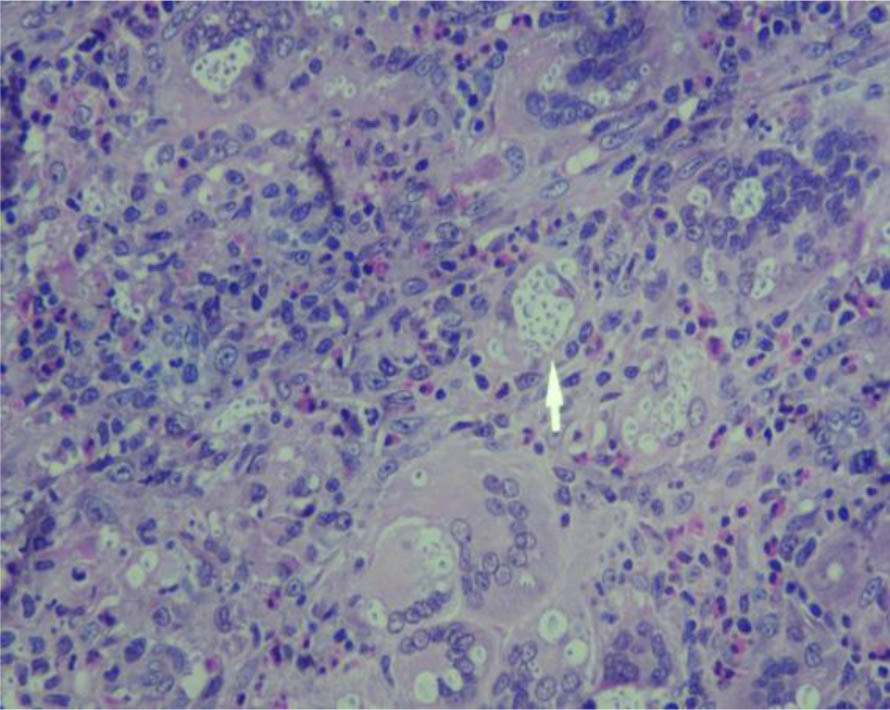
Figure 5.
showing fungal hyphae on lymph node biopsy.
Table 2
Serial blood counts of patient with ANCA associated vasculitis
| Hb | TLC | ANC | ALC | MCV | MCH | PLT | AEC | Eo % |
|---|---|---|---|---|---|---|---|---|
| 6.9 | 13.01 | 7.29 | 1.25 | 88.6 | 27.2 | 267 | 3.59 | 27.6% |
| 7.6 | 12.43 | 8.16 | 1.43 | 87 | 28 | 278 | 2.14 | 17.2% |
| 7.4 | 11.90 | 8.21 | 1.32 | 89.6 | 29.6 | 260 | 1.76 | 14.8% |
| 7.6 | 12.07 | 8.04 | 1.58 | 88.0 | 28.5 | 304 | 1.78 | 14.7% |
| 6.7 | 7.48 | 6.09 | 0.93 | 97.8 | 29.5 | 343 | 0.00 | 0 % |

Figure 6, 7.
Nerve biopsy showing infiltration of lymphocytes and eosinophils of vessel wall.