
Female gender, low serum albumin, and lymphopenia are independent risk factors for mortality in hemodialysis patients.
PNI <41.45 increases mortality risk by 34.2 times.
NLR ≥4.2 and SII ≥703 are strong prognostic markers for predicting mortality.
This study is a unique single-center, real-world cohort study.
Hematological indices (NLR, SII, PNI) are powerful tools for predicting mortality.
Female patients have a higher mortality risk, likely related to nutritional and metabolic differences.
Simple, inexpensive biomarkers can provide valuable information about mortality risk in clinical practice.
Chronic Kidney Disease (CKD) is characterized by an estimated glomerular filtration rate (eGFR) of below 60 mL/min/1.73 m2 for a duration exceeding three months or the presence of kidney damage markers such as albuminuria, urine sediment abnormalities, and acid-base and electrolyte disturbances [1]. The period when CKD patients’ eGFR falls below 15ml/min/1.73m2 is called End-Stage Kidney Disease (ESKD). Patients in this stage are managed through methods such as dialysis, kidney transplantation, or conservative treatment. In ESKD patients, factors such as advanced age, ischemic heart disease, congestive heart failure, and malnutrition have been found to be associated with a poor prognosis [2]. Approximately 2% of CKD patients progress to the ESKD stage. However, this rate remains low due to the higher mortality associated with cardiovascular events [3]. The main causes of mortality in ESKD patients include myocardial infarction and fatal arrhythmias, with cardiovascular events accounting for 44.2% of all causes of death [4].
Hypertension is the most common finding in CKD, with its prevalence ranging from 60% to 90% depending on the stage and etiology of the disease. Hypertension is an important independent risk factor for cardiovascular disease, progression to ESKD, and mortality [5]. Sarcopenia is another independent risk factor that increases mortality in ESKD patients, and its prevalence significantly rises in dialysis-dependent patients [6]. Chronic Kidney Disease is also a significant risk factor for venous and arterial thromboembolism [7]. In ESKD patients admitted to the intensive care unit due to sepsis, the likelihood of mortality is higher compared to patients without ESKD [8]. Sudden cardiac death (SCD) is responsible for about 25% of all fatalities among ESKD patients, and dialysis-induced disturbances in calcium concentrations contribute to the increased risk of cardiovascular mortality, vascular calcification and SCD [9].
Hemodialysis patients have numerous non-traditional cardiovascular risk factors, including left ventricular hypertrophy, coronary artery disease, rapid electrolyte shifts, QT dispersion, and hyperphosphatemia [10]. In previous studies, hyperphosphatemia, persistent inflammation, and malnutrition have been shown to worsen prognosis [11,12,13]. Hematological indices such as the Neutrophil-to-Lymphocyte Ratio (NLR), the Systemic Immune-Inflammation Index (SII), and the Prognostic Nutritional Index (PNI) have been investigated as prognostic markers in chronic kidney disease and hemodialysis cohorts [12,13,14].
However, most of the available data come from large multicenter studies and meta-analyses [11,12,13,14], whereas evidence from smaller, single-center, real-world cohorts remains scarce. Furthermore, sex-specific differences in mortality predictors, particularly the potential role of female sex as an independent risk factor, have not been consistently evaluated [15].
Based on this background, we designed this retrospective cohort study to identify predictors associated with mortality, including demographic, biochemical, and hematological indices, in patients with ESKD undergoing dialysis in our own cohort. In particular, we aimed to explore whether female sex may represent an independent mortality risk factor, a finding that has not been widely reported in previous literature [15].
This single-center, retrospective cohort study was conducted in the Department of Nephrology at a tertiary care centre between 1 January 2020 and 30 June 2024. The study included patients aged 18 years and above who were diagnosed with ESKD and underwent standard hemodialysis treatment three times per week. Patients who were referred to another center during follow-up, or who had a dialysis duration of less than three months, were excluded. Additional exclusion criteria were hematological or solid organ malignancies, immunosuppressive treatment, pregnancy, missing data, and lack of voluntary participation. The study protocol was approved by the institutional Ethics Committee (Date: August 5, 2024 / No: E-10840098-202.3.02-4775) and was conducted in accordance with the principles of the Helsinki Declaration.
Data were obtained by reviewing patient records. Demographic and clinical characteristics (age, sex, height, weight, blood pressure, vascular access type, and hemodialysis duration) were recorded. Body Mass Index (BMI) was calculated as weight (kg) / height2 (m2). For survivors, biochemical and hematological parameters were taken from the most recent monthly tests; for deceased patients, from the last samples before death. Comorbidities including diabetes, coronary artery disease, hypertension, and heart failure were documented. Among hemogram parameters, hemoglobin (Hb), leukocyte, platelet (PLT), absolute neutrophil, absolute lymphocyte, and absolute monocyte counts were recorded. Estimated glomerular filtration rate (eGFR) was calculated using the Chronic Kidney Disease Epidemiology Collaboration formula. Hematological indices were calculated as follows:
Neutrophil-to-Lymphocyte Ratio (NLR) = Neutrophil count / Lymphocyte count
Systemic Immune-Inflammation Index (SII) = (Neutrophil count × Platelet count) / Lymphocyte count
Prognostic Nutritional Index (PNI) = (10 × serum albumin \[g/dL]) + (0.005 × total lymphocyte count)
Dialysis adequacy was assessed using Kt/V values calculated by the Daugirdas formula, based on pre- and post-dialysis blood urea nitrogen (BUN) levels. An spKt/V value of ≥1.2 was considered adequate. Formula:
spKt/VDaugirdas = −ln\[(BUNpost / BUNpre) − (0.008 × hours)] + \[(4 − (3.5 × BUNpost / BUNpre)) × (UF volume / post-dialysis weight)] [16].
IBM SPSS version 26.0 was used for data analysis. Descriptive statistics were reported as mean ± SD for normally distributed data, and as median (IQR) for non-normally distributed data. Student’s t-test or Mann–Whitney U test were used for comparisons between groups. Categorical data were analyzed with the Chi-square test. Correlation between continuous variables was assessed with Pearson or Spearman coefficients. ROC analysis was performed to determine optimal cut-off values for mortality-related parameters. Logistic regression analyses were conducted to identify risk factors. Variables with p<0.25 in univariate analysis were included in the multivariate model. Model calibration was checked using the Hosmer–Lemeshow test. A p-value <0.05 was considered statistically significant. Given the limited number of events (21 deaths), multivariate analyses may carry a risk of overfitting, and findings should therefore be interpreted with caution.
This study included 80 patients diagnosed with ESKD undergoing hemodialysis three times per week. Of the participants, 70% (n=56) were male. The mean age was 60.7 ± 16.4 years, and the mean body mass index (BMI) was 25.2 ± 5.0. The distribution of age and BMI was similar between both genders (p=0.711 and p=0.332, respectively). The median duration of hemodialysis treatment was 25.0 months (IQR: 9.75–83.00). Detailed demographic and clinical characteristics are presented in Table 1.
Demographic characteristics, duration of hemodialysis and comorbidities
| status | N | Mean ±SD | Median(IQR) | t | P | ||
|---|---|---|---|---|---|---|---|
| Age | Total | 80 | 60.7±16.4 | −1.89 | 0.062 | ||
| Survivor | 59 | 58.6±16.6 | |||||
| Non-survivor | 21 | 66.4±14.6 | |||||
| BMI | Total | 80 | 25.2±5.0 | −0.47 | 0.637 | ||
| Survivor | 59 | 25.0±4.9 | |||||
| Non-survivor | 21 | 25.6±5.3 | |||||
| HD duration (months) | Total | 80 | 25.0 (9.75–83) | 838.5¶ | 0.895 | ||
| Survivor | 59 | 26.0 (9–84) | |||||
| Non-survivor | 21 | 24.0 (10–82) | |||||
| Blood pressure (mmHg) | Syst. | Total | 80 | 132.0±23.8 | 1.57 | 0.119 | |
| Survivor | 59 | 134.5±23.6 | |||||
| Non-survivor | 21 | 125.0±23.7 | |||||
| Diast. | Total | 80 | 77.4±12.2 | 0.34 | 0.735 | ||
| Survivor | 59 | 77.7±12.8 | |||||
| Non-survivor | 21 | 76.6±10.4 | |||||
| Gender | Male | Total | 56 | %70.0 | X2=6.79 | 0.009 | |
| Survivor | 46 | %82.1 | |||||
| Non-survivor | 10 | %17.9 | |||||
| Female | Total | 24 | %30.0 | ||||
| Survivor | 13 | %54.2 | |||||
| Non-survivor | 11 | %45.8 | |||||
| Vascular Acces | AVF | Survivor | 40 | %80.0 | X2=2.69 | 0.101 | |
| Non-survivor | 10 | %20.0 | |||||
| Kateter | Survivor | 19 | %63.3 | ||||
| Non-survivor | 11 | %36.7 | |||||
| Diabet | VAR | Survivor | 19 | %63,3 | X2=2.69 | 0.101 | |
| Non-survivor | 11 | %36.7 | |||||
| YOK | Survivor | 40 | %80.0 | ||||
| Non-survivor | 10 | %20.0 | |||||
| Hypertension | VAR | Survivor | 44 | %72.1 | X2=0.35 | 0.555 | |
| Non-survivor | 17 | %27.9 | |||||
| YOK | Survivor | 15 | %78.9 | ||||
| Non-survivor | 4 | %21.1 | |||||
| CAD | VAR | Survivor | 16 | %59.3 | X2=4.42 | 0.036 | |
| Non-survivor | 11 | %40.7 | |||||
| YOK | Survivor | 43 | %81.1 | ||||
| Non-survivor | 10 | %18.9 | |||||
| CHF | VAR | Survivor | 12 | %54.5 | X2=5.78 | 0.016 | |
| Non-survivor | 10 | %45.5 | |||||
| YOK | Survivor | 47 | %81 | ||||
| Non-survivor | 11 | %19 |
SD; Standard deviation, BMI; Body mass index, HD duration (months); Length of stay on hemodialysis, AVF; Arteriovenous fistula, CAD; Coronary artery disease, CHF; Congestive heart failure,
mann-whitney-U,
t; student-t test, X2; Chi-square.
There was no significant difference between survivors and deceased patients in terms of BMI, age, duration of hemodialysis, or systolic and diastolic blood pressure values (p>0.05). Arteriovenous fistula (AVF) was the preferred vascular access type in 62.5% (n=50), but vascular access type was not associated with mortality (p=0.101). Among comorbidities, diabetes mellitus (37.5%) and hypertension (76.3%) were common but not linked to mortality (p>0.05). In contrast, coronary artery disease (33.8%) and congestive heart failure (27.5%) were significantly more frequent in deceased patients (p=0.036 and p=0.016, respectively). Mortality was also significantly higher among female patients (p=0.009).
Biochemical and hematological data are summarized in Table 2. Patients who died had significantly lower serum creatinine, sodium, and albumin levels (p<0.01 for each). Hematological analysis revealed higher absolute neutrophil counts and lower absolute lymphocyte counts in deceased patients (p<0.01 and p<0.001, respectively). CRP was also significantly elevated in the mortality group, whereas ferritin did not differ significantly between groups (p>0.05).
Relationship between blood biochemical values and mortality
| Status | N | Mean | Total Mean | SD | p | ||
|---|---|---|---|---|---|---|---|
| Glucose (mg/dL) | Survivor | 59 | 128.98 | 131.2 | 52.6 | 585.5¶ | 0.710 |
| Non-survivor | 21 | 137.33 | |||||
| Creatinine (mg/dL) | Survivor | 59 | 7.85 | 7.30 | 2.4 | 3.7¥ | 0.001 |
| Non-survivor | 21 | 5.77 | |||||
| eGFR (mL/min/1.73m2) | Survivor | 59 | 7.53 | 8.09 | 3.5 | 382.5¶ | 0.009 |
| Non-survivor | 21 | 9.68 | |||||
| Sodium (mEq/L) | Survivor | 59 | 137.75 | 137.2 | 3.5 | 2.6¥ | 0.012 |
| Non-survivor | 21 | 135.52 | |||||
| Potassium (mEq/L) | Survivor | 59 | 4.74 | 4.7 | 0.7 | −0.08¥ | 0.931 |
| Non-survivor | 21 | 4.76 | |||||
| dCa (mg/dL) | Survivor | 59 | 8.57 | 8.6 | 0.7 | −0.3¥ | 0.775 |
| Non-survivor | 21 | 8.62 | |||||
| Phosphorus (mg/dL) | Survivor | 59 | 5.03 | 5.0 | 1.4 | 0.40¥ | 0.693 |
| Non-survivor | 21 | 4.89 | |||||
| CaxP | Survivor | 59 | 42.66 | 42.5 | 11.5 | 0.18¥ | 0.856 |
| Non-survivor | 21 | 42.13 | |||||
| Magnesium (mg/dL) | Survivor | 34 | 2.10 | 2.1 | 0.3 | 1.31¥ | 0.197 |
| Non-survivor | 21 | 2.00 | |||||
| LDH (U/L) | Survivor | 28 | 253.64 | 265.2 | 90.4 | 214.0¶ | 0.167 |
| Non-survivor | 20 | 281.25 | |||||
| Uric acid (mg/dL) | Survivor | 59 | 5.55 | 5.5 | 1.6 | 519.0¶ | 0.272 |
| Non-survivor | 21 | 5.16 | |||||
| BNP (ng/L) | Survivor | 23 | 11957.6 | 13500.2 | 13087.6 | 107.5¶ | 0.288 |
| Non-survivor | 12 | 16456.9 | |||||
| PTH (ng/L) | Survivor | 58 | 427.96 | 446.2 | 15.5 | 537.5¶ | 0.427 |
| Non-survivor | 21 | 447.92 | |||||
| Vitamin D (μg/L) | Survivor | 48 | 18.21 | 12.8 | 3.2 | 192.0¶ | 0.323 |
| Non-survivor | 10 | 14.67 | |||||
| HbA1C (%) | Survivor | 37 | 6.11 | 6.1 | 1.3 | 0.13¥ | 0.897 |
| Non-survivor | 20 | 6.07 | |||||
| Albumin (g/L) | Survivor | 59 | 38.8 | 37.2 | 5.8 | 3.86¥ | 0.001 |
| Non-survivor | 21 | 32.8 | |||||
| Ferritin (μg/L) | Survivor | 58 | 628.4 | 801.4 | 1107.7 | 559.0¶ | 0.579 |
| Non-survivor | 21 | 1279.2 | |||||
| CRP (mg/L) | Survivor | 59 | 18.8 | 44.3 | 76.5 | 230.5¶ | 0.001 |
| Non-survivor | 21 | 108.5 | |||||
| Kt/V | Survivor | 59 | 1.59 | 1.57 | 0.39 | 0.97¥ | 0.333 |
| Non-survivor | 21 | 1.50 |
student-t test,
mann-whitney U test,
SD; Standard deviation, eGFR; estimated glomerular filtration, dCa; Corrected calcium, LDH; Lactate dehydrogenase, BNP; Brain natriuretic peptide, PTH; Parathyroid hormone, HbA1C; Glycosylated hemoglobin, CRP; C-Reactive protein, Kt/Vüre; Dialysis Efficiency (‘K’ is dialyzer urea clearance, ‘t’ is total dialysis session time, and ‘V’ is volume of distribution of urea which is approximately equal to total body water)
Hematological indices calculated from these parameters are shown in Table 3. Deceased patients had significantly higher NLR and SII values and significantly lower PNI values compared to survivors (all p<0.01). In particular, the mean PNI of survivors was 45.9 versus 37.6 in deceased patients (p<0.001), indicating the strong prognostic impact of nutritional status. Correlation analysis also revealed significant associations between CRP and NLR, SII, and PNI (rho values: 0.506, 0.483, and −0.507; p<0.001 for each), while ferritin showed no correlation (p=0.073).
Relationship between hematological indices and mortality
| N | Mean | SD | p | |||
|---|---|---|---|---|---|---|
| Hemoglobin | survivor | 59 | 10.9 | 1.6 | 1.73¥ | 0.089 |
| non-survivor | 21 | 10.1 | 1.8 | |||
| total | 80 | 10.7 | 1.7 | |||
| Neutrophil | survivor | 59 | 5105.6 | 3915.3 | 361.5¶ | 0.005 |
| non-survivor | 21 | 6924.3 | 3221.3 | |||
| total | 80 | 5583.0 | 3811.9 | |||
| Lymphocyte | survivor | 59 | 1415.1 | 548.9 | 309.5¶ | 0.001 |
| non-survivor | 21 | 966.7 | 470.5 | |||
| total | 80 | 1297.4 | 562.8 | |||
| NLR | survivor | 59 | 3.92 | 3.15 | 210.0¶ | 0.001 |
| non-survivor | 21 | 9.12 | 6.80 | |||
| total | 80 | 5.28 | 4.93 | |||
| SII | survivor | 59 | 825.3 | 1180.9 | 247.0¶ | 0.001 |
| non-survivor | 21 | 2110.7 | 1952.5 | |||
| total | 80 | 1162.7 | 1520.8 | |||
| PNI | survivor | 59 | 45.88 | 5.52 | 5.41¥ | 0.001 |
| non-survivor | 21 | 37.59 | 7.3 | |||
| total | 80 | 43.7 | 7.03 | |||
| n | % | Cut-off | X2 | P | ||
| Lymphocyte categorical | survivor | 21 | 35.6 | <1145/mm3 | 8.04 | 0.005 |
| 38 | 64.4 | ≥1145/mm3 | ||||
| non-survivor | 15 | 71.4 | <1145/mm3 | |||
| 6 | 28.6 | ≥1145/mm3 | ||||
| NLR categorical | survivor | 43 | 72.9 | <4.2 | 15.54 | 0.001 |
| 16 | 27.1 | ≥4.2 | ||||
| non-survivor | 5 | 23.8 | <4.2 | |||
| 16 | 76.2 | ≥4.2 | ||||
| SII categorical | survivor | 41 | 69.5 | <703 | 16.01 | 0.001 |
| 18 | 30.5 | ≥703 | ||||
| non-survivor | 4 | 19.0 | <703 | |||
| 17 | 81.0 | ≥703 | ||||
| PNI categorical | survivor | 10 | 16.9 | <41.45 | 24.77 | 0.001 |
| 49 | 83.1 | ≥41.45 | ||||
| non-survivor | 16 | 76.2 | <41.45 | |||
| 10 | 23.8 | ≥41.45 |
mann-whitney-u, t test,
student-t test,
X2 Chi-square,
SD; standard deviation, NLR; Neutrophil Lymphocyte Ratio, SII; Systemic immune-inflammation index, PNI; Prognostic nutritional index
ROC analysis demonstrated good discriminative ability of these indices for predicting mortality. The cut-off values were identified as 4.2 for NLR, 703.2 for SII, and 41.45 for PNI (all p<0.001). Patients above or below these thresholds had substantially different mortality risks (Figure 1). Univariate logistic regression showed that sex, coronary artery disease, congestive heart failure, creatinine, sodium, albumin, hemoglobin, and absolute lymphocyte count were associated with mortality at p<0.25 and thus included in the multivariate model. The Hosmer–Lemeshow test confirmed good model fit (X2=1.67; p=0.976). In the multivariate logistic regression, only female sex (OR: 7.64; 95% CI: 1.148–50.87; p=0.036), low albumin (OR: 0.857; 95% CI: 0.739–0.990; p=0.041), and absolute lymphocyte count (OR: 0.99; 95% CI: 0.98–0.99; p=0.013) remained independent predictors (Table 4).
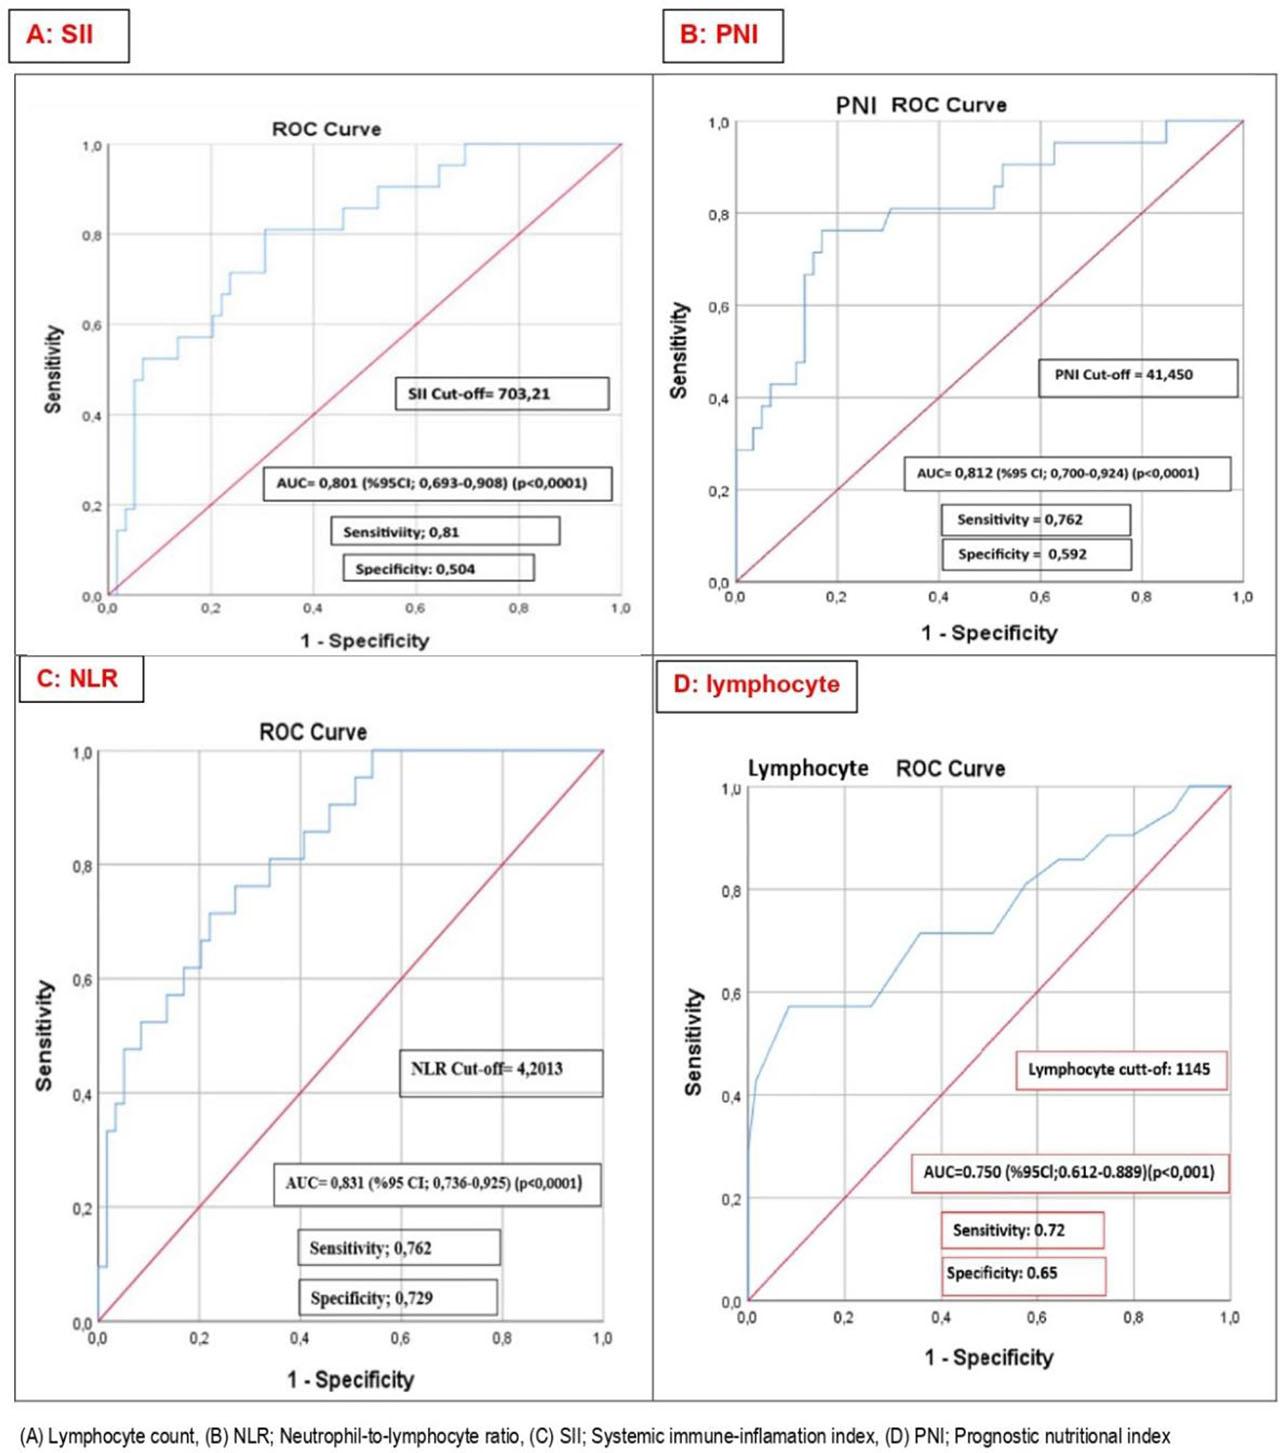
Receiver Operating Characteristic (ROC) Curve Analyses for Prognostic Biomarkers.
Independent variables predicting mortality in multiple logistic regression analysis
| B | S.E. | Wald | df | Sig. | Exp(B) | 95% C.I. for EXP(B) | ||
|---|---|---|---|---|---|---|---|---|
| Lower | Upper | |||||||
| Gender (E=2) | 2.033 | 0.967 | 4.420 | 1 | 0.036 | 7.640 | 1.148 | 50.87 |
| Diabetes (0) | −0.554 | 0.806 | 0.472 | 1 | 0.492 | 0.575 | 0.118 | 2.79 |
| CAD (0) | 1.568 | 1.029 | 2.319 | 1 | 0.128 | 4.795 | 0.638 | 36.06 |
| CHF (0) | 1.022 | 0.852 | 1.438 | 1 | 0.230 | 2.779 | 0.523 | 14.77 |
| Creatinine | −0.086 | 0.211 | 0.166 | 1 | 0.684 | 0.917 | 0.606 | 1.39 |
| Sodium | −0.034 | 0.097 | 0.123 | 1 | 0.726 | 0.967 | 0.799 | 1.17 |
| Magnesium | −0.695 | 1.292 | 0.289 | 1 | 0.591 | 0.499 | 0.040 | 6.28 |
| Hemoglobin | 0.157 | 0.221 | 0.504 | 1 | 0.478 | 1.170 | 0.758 | 1.81 |
| Vascular_Acces (1) | 0.693 | 0.781 | 0.788 | 1 | 0.375 | 2.000 | 0.433 | 9.24 |
| Albumin | −0.154 | 0.076 | 4.181 | 1 | 0.041 | 0.857 | 0.739 | 0.99 |
| Albumin Categorical (1) | 1.859 | 1.007 | 3.404 | 1 | 0.065 | 6.415 | 0.891 | 46.208 |
| NLR | 0.200 | 0.088 | 5.169 | 1 | 0.023 | 1.222 | 1.028 | 1.452 |
| NLR Categorical (1) | 2.346 | 0.938 | 6.259 | 1 | 0.012 | 10.442 | 1.662 | 65.607 |
| SII | 0.000 | 0.000 | 1.849 | 1 | 0.174 | 1.0 | 1.0 | 1.0 |
| SII Categorical (1) | 1.941 | 0.788 | 6.063 | 1 | 0.014 | 6.964 | 1.486 | 32.643 |
| PNI | −0.191 | 0.071 | 7.244 | 1 | 0.007 | 0.826 | 0.718 | 0.949 |
| PNI Categorical (1) | 3.532 | 1.166 | 9.178 | 1 | 0.002 | 34.176 | 3.479 | 335.72 |
| Lymphocyte | −0.004 | 0.002 | 6.166 | 1 | 0.013 | 0.996 | 0.993 | 0.999 |
| Lymph_Categorical(1) | 2.652 | 1.042 | 6.482 | 1 | 0.011 | 14.179 | 1.841 | 109.20 |
| Constant | 10.440 | 13.514 | 0.597 | 1 | 0.440 | 34214.988 | ||
CAD; Coronary artery disease, CHF; Congestive heart failure, Exp (B); Odd ratio, Vascular acces AVF=1, NLR; Neutrophil Lymphocyte Ratio, SII; Systemic immune-inflammation index, PNI; Prognostic nutritional index, NLR Categorical; (regarding the status of being <4.2 or ≥4.2), SII Categorical; (regarding the status of being <703.1 or ≥703.1), PNI Categorical; (regarding the status of being <41.45 or ≥41.45), Lymphocyte-categorical; (regarding the status of being <1145 or ≥1145).
Kaplan–Meier survival curves further confirmed these findings: patients with lymphocyte counts <1145/mm3, NLR ≥4.2, SII ≥703, and PNI <41.45 had significantly lower survival rates (Figure 2).
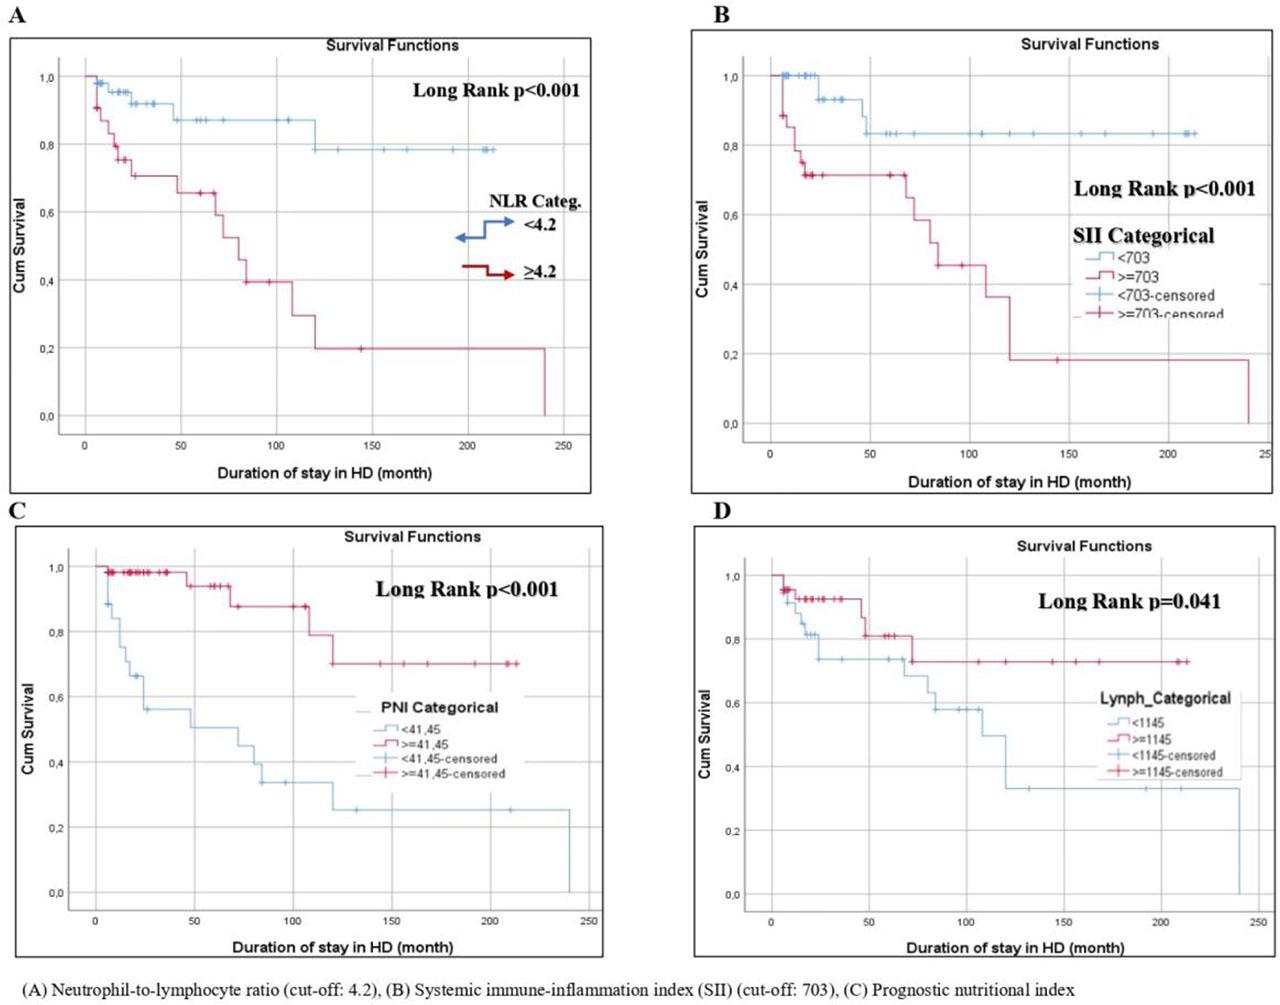
Kaplan–Meier Survival Analyses Based on Biomarker Cut-Off Values.
This study investigated factors affecting mortality in patients with end-stage kidney disease (ESKD) undergoing hemodialysis over a 5-year follow-up period. The results showed that sex, serum albumin level, and absolute lymphocyte count were independent predictors of mortality. Multivariate logistic regression analysis demonstrated that the risk of death was 7.6 times higher in women compared to men (OR: 7.64; 95% CI: 1.148–50.87, p=0.036). In addition, each unit decrease in serum albumin was associated with a 14% increase in mortality risk (OR: 0.857; 95% CI: 0.739–0.990, p=0.041). ROC analysis confirmed the predictive value of hematological indices, showing that mortality risk was 14.2-fold higher in patients with a lymphocyte count <1145/mm3, 10.4-fold higher in patients with NLR ≥4.2, 6.9-fold higher in patients with SII ≥703, and 34.2-fold higher in patients with PNI <41.45 (all p<0.05).
Cardiovascular diseases are the most common comorbidities in patients undergoing hemodialysis and remain the leading cause of mortality. Cardiovascular mortality is estimated to be 20 times higher in patients with ESKD compared to the general population [17]. Left ventricular hypertrophy, hypervolemia, accelerated atherosclerosis, uremic cardiomyopathy, secondary hyperparathyroidism, vascular calcification, oxidative stress, systemic inflammation, electrolyte disturbances, and anemia have all been implicated in this excess cardiovascular risk [18,19,20]. Mortality is particularly high in the early weeks after initiation of dialysis [21], and systemic inflammation together with endothelial dysfunction are considered major contributors [15]. In our cohort, coronary artery disease (59.3%) and congestive heart failure (54.5%) were common comorbidities and were significantly associated with mortality in univariate analysis. However, these associations did not remain significant in the multivariate model, suggesting confounding by other factors such as nutritional and inflammatory status.
An important and potentially novel finding of this study was the higher mortality among female patients. Previous meta-analyses have reported similar results, showing that early mortality after initiation of hemodialysis may be higher in women [15]. In our cohort, male and female patients were comparable in age, BMI, dialysis duration, dialysis adequacy, and inflammatory markers such as CRP, ferritin, NLR, SII, and PNI. The higher mortality in women therefore does not appear to be explained by inflammation alone. Rather, significantly lower serum creatinine, phosphorus, and albumin levels in women suggest a link with lower muscle mass and malnutrition. Lower vitamin D levels in women, which were also observed in our study, may further contribute to adverse outcomes, as vitamin D deficiency has been linked to increased mortality risk in CKD and dialysis populations [22]. Taken together, these findings suggest that nutritional and metabolic differences between sexes may underlie the observed mortality gap. Social and treatment-access factors may also contribute, though these were not directly assessed in this study.
Nutritional status and chronic inflammation are known to play crucial roles in the prognosis of hemodialysis patients. Albumin, synthesized in the liver, is a well-established marker of nutritional and inflammatory status. Previous studies have consistently shown that hypoalbuminemia is a strong predictor of morbidity and mortality [23,24]. Our study confirms these findings, as albumin levels were significantly lower in deceased patients, and each unit decrease in serum albumin was associated with increased mortality risk. Importantly, mean serum albumin levels were also significantly lower in women compared to men, which may partly explain the higher mortality in females.
Lymphopenia is another established prognostic factor in ESKD. Increased lymphocyte apoptosis, partly related to dialysis membrane biocompatibility, contributes to reduced lymphocyte counts in hemodialysis patients. Lymphopenia has been associated with adverse outcomes in both inpatient and outpatient settings [25,26,27]. In our cohort, deceased patients had significantly lower lymphocyte counts, and lymphopenia below the ROC-derived cut-off of 1145/mm3 increased mortality risk by more than 14-fold, underscoring the prognostic significance of impaired immune status in this population.
Inflammatory indices such as NLR and SII have been widely used as inexpensive and readily available prognostic markers in various clinical settings, including dialysis populations. Ouellet et al. reported that NLR is a good predictor of all-cause mortality in chronic hemodialysis patients [28]. Consistent with these findings, NLR values were significantly higher in deceased patients in our cohort, and NLR ≥4.2 was associated with a 10-fold increase in mortality risk. Similarly, SII, which integrates neutrophil, platelet, and lymphocyte counts, has been used to predict outcomes in infections, malignancies, and rheumatologic conditions [29,30,31]. Our data extend these observations to dialysis patients, showing that SII ≥703 was associated with a nearly 7-fold increase in mortality.
The Prognostic Nutritional Index (PNI), calculated from albumin and lymphocyte counts, was initially developed to evaluate prognosis in cancer patients [32]. More recently, its prognostic utility has been demonstrated in dialysis cohorts [14]. In our study, PNI values were significantly lower in deceased patients, and PNI <41.45 was associated with the highest mortality risk among all indices (OR: 34.2). This finding highlights the importance of the combined effects of malnutrition and immune dysfunction in determining prognosis in hemodialysis patients.
This study has several limitations. First, the sample size was relatively small (n=80), and the number of deaths was limited (n=21). This restricts the statistical power of the analyses. Second, given the low number of events, the inclusion of multiple predictors in multivariate models may have led to overfitting, as reflected by the wide confidence intervals for some estimates. Third, the single-center, retrospective cohort design reduces the external validity and generalizability of the findings. Fourth, only baseline or last available laboratory values were analyzed; therefore, longitudinal changes in hematological indices over time could not be assessed. Fifth, the study did not include a validation cohort, which limits the ability to confirm the robustness of the results. Finally, we did not evaluate malnutrition-inflammation complex syndrome scores, more detailed markers of dialysis adequacy beyond Kt/V, or inflammatory markers other than CRP, leaving the possibility of residual confounding.
In this single-center retrospective cohort study of hemodialysis patients, female sex, low serum albumin, and low lymphocyte count emerged as independent predictors of mortality. Hematological indices including NLR, SII, and PNI demonstrated strong prognostic value, with PNI <41.45 showing the highest risk estimate. These findings support the role of simple, inexpensive indices in risk stratification. However, the results should be interpreted with caution due to the small sample size, single-center design, and potential overfitting in multivariate analyses. The wide confidence intervals observed in some predictors highlight the need for validation in larger datasets. Future multicenter, prospective studies with larger patient populations and validation cohorts are needed to confirm these associations, explore underlying mechanisms – particularly regarding the higher mortality risk observed in women – and to evaluate longitudinal changes in hematological indices over time.