
Table 1
Sensitivity power analysis for comparison of two means
| MicroRNA | SD (∆CT) | Cohen’s d | Detectable ∆CT | Detectable FC |
|---|---|---|---|---|
| Mir-34a | 2.92 | 1.06 | 3.10 | 8.55 |
| Mir-34c | 3.19 | 1.06 | 3.38 | 10.42 |
| Mir-101 | 3.98 | 1.06 | 4.22 | 18.62 |
| Mir-124 | 2.38 | 1.06 | 2.52 | 5.75 |
| Mir-126-3p | 4.96 | 1.06 | 5.26 | 38.26 |
| Mir-126-5p | 4.04 | 1.06 | 4.28 | 19.46 |
| Mir-199 | 3.20 | 1.06 | 3.39 | 10.50 |
| Mir-223 | 4.03 | 1.06 | 4.27 | 19.32 |
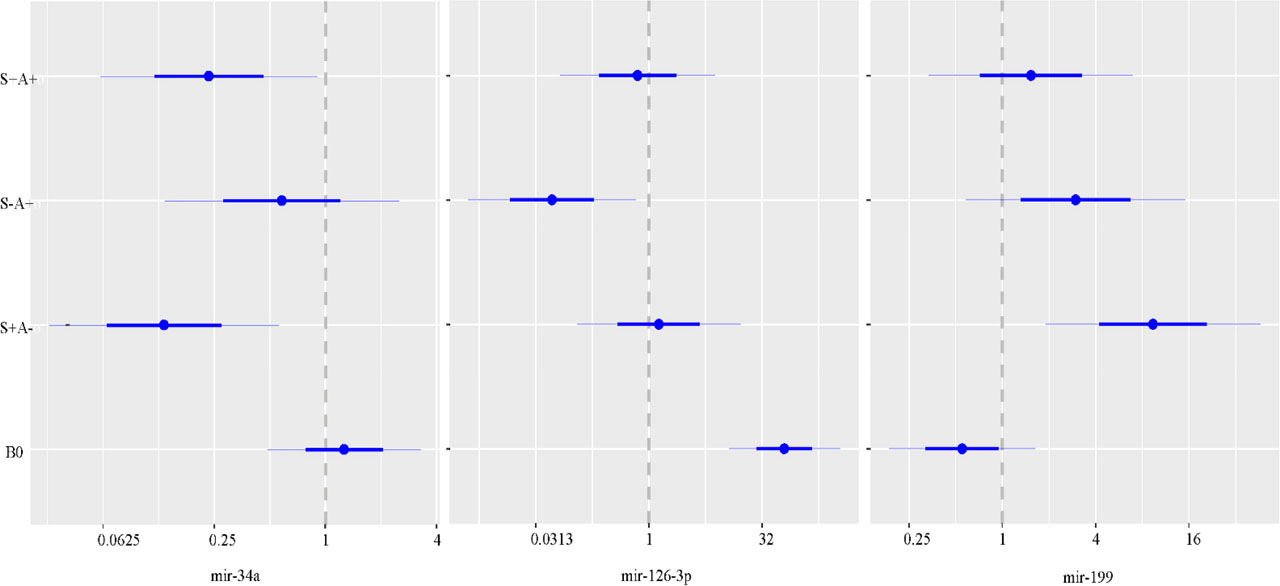
Figure 1.
Coefficient plots showing FC and 95% CI (H0: FC =1, reference: S-A-) for the microRNAs having significant FC; B0: intercept of the models.
Table 2
Gene expression study in among groups using general linear model
| MicroRNA | Group | FC (95% CI) | P value | R-square | ANOVA P value |
|---|---|---|---|---|---|
| Mir-34a | S-A- | Reference | 0.153 | 0.031* | |
| S+A- | 0.13 (0.03–0.56) | 0.007* | |||
| S-A+ | 0.58 (0.13–2.52) | 0.461 | |||
| S+A+ | 0.23 (0.06–0.91) | 0.036* | |||
| Mir-34c | S-A- | Reference | 0.043 | 0.507 | |
| S+A- | 0.95 (0.17–5.17) | 0.952 | |||
| S-A+ | 2.31 (0.41–13.06) | 0.336 | |||
| S+A+ | 2.52 (0.51–12.58) | 0.253 | |||
| Mir-101 | S-A- | Reference | 0.120 | 0.078# | |
| S+A- | 0.2 (0.03–1.44) | 0.107# | |||
| S-A+ | 2.87 (0.37–21.99) | 0.305 | |||
| S+A+ | 0.42 (0.06–2.76) | 0.358 | |||
| Mir-124 | S-A- | Reference | 0.115 | 0.094# | |
| S+A- | 0.79 (0.23–2.64) | 0.694 | |||
| S-A+ | 2.25 (0.65–7.76) | 0.195# | |||
| S+A+ | 0.47 (0.15–1.49) | 0.196# | |||
| Mir-126-3p | S-A- | Reference | 0.129 | 0.064# | |
| S+A- | 1.36 (0.11–16.76) | 0.806 | |||
| S-A+ | 0.05 (<0.01–0.67) | 0.024* | |||
| S+A+ | 0.71 (0.07–7.65) | 0.772 | |||
| Mir-126-5p | S-A- | Reference | 0.105 | 0.122 | |
| S+A- | 3.32 (0.42–26.31) | 0.250 | |||
| S-A+ | 0.27 (0.03–2.27) | 0.224 | |||
| S+A+ | 2.07 (0.29–14.74) | 0.461 | |||
| Mir-199 | S-A- | Reference | 0.146 | 0.040* | |
| S+A- | 9.38 (1.89–46.49) | 0.007* | |||
| S-A+ | 2.97 (0.58–15.26) | 0.187# | |||
| S+A+ | 1.53 (0.34–6.99) | 0.575 | |||
| Mir-223 | S-A- | Reference | 0.029 | 0.666 | |
| S+A- | 0.82 (0.09–7.04) | 0.852 | |||
| S-A+ | 1.88 (0.21–16.98) | 0.567 | |||
| S+A+ | 2.61 (0.34–20.12) | 0.350 |
Table 3
Interaction of atherosclerosis and pack-years of smoking on the expression of microRNA using general linear model
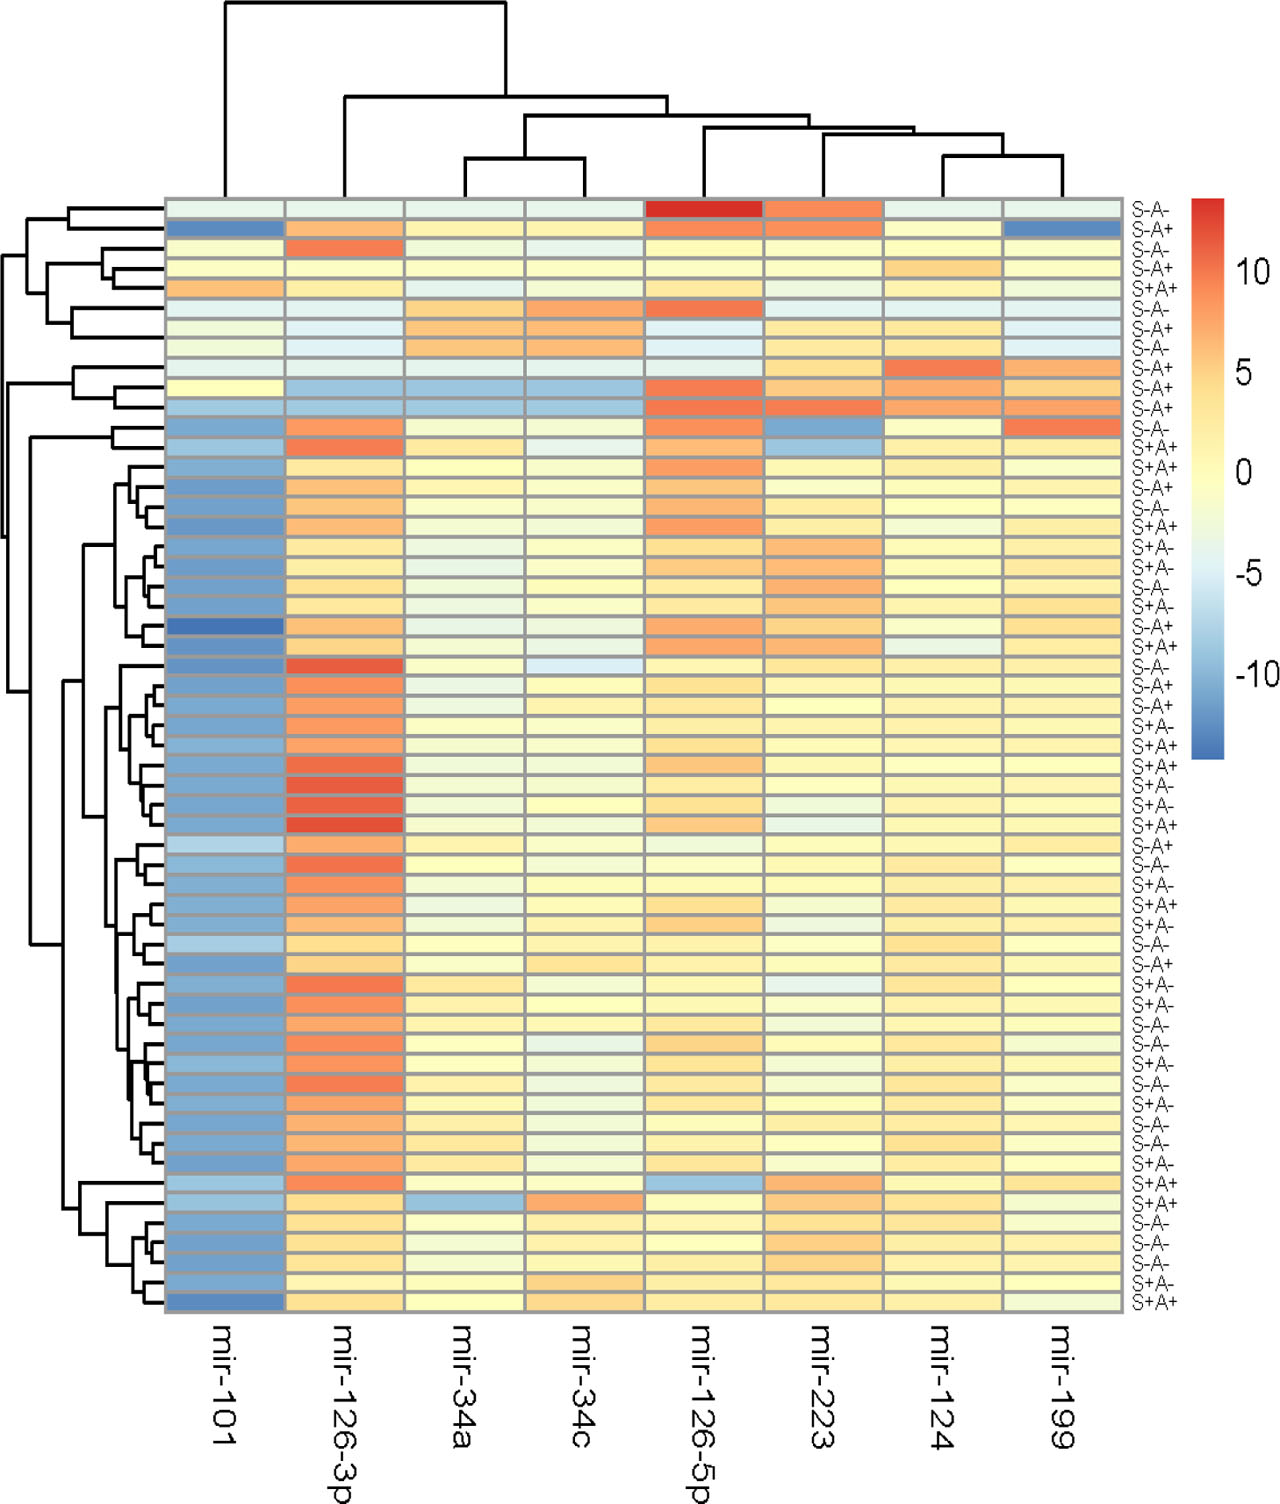
Figure 2.
Heat map for simultaneous clustering of microRNAs and participants on the basis of -∆CT (i.e. red color: up-regulation).
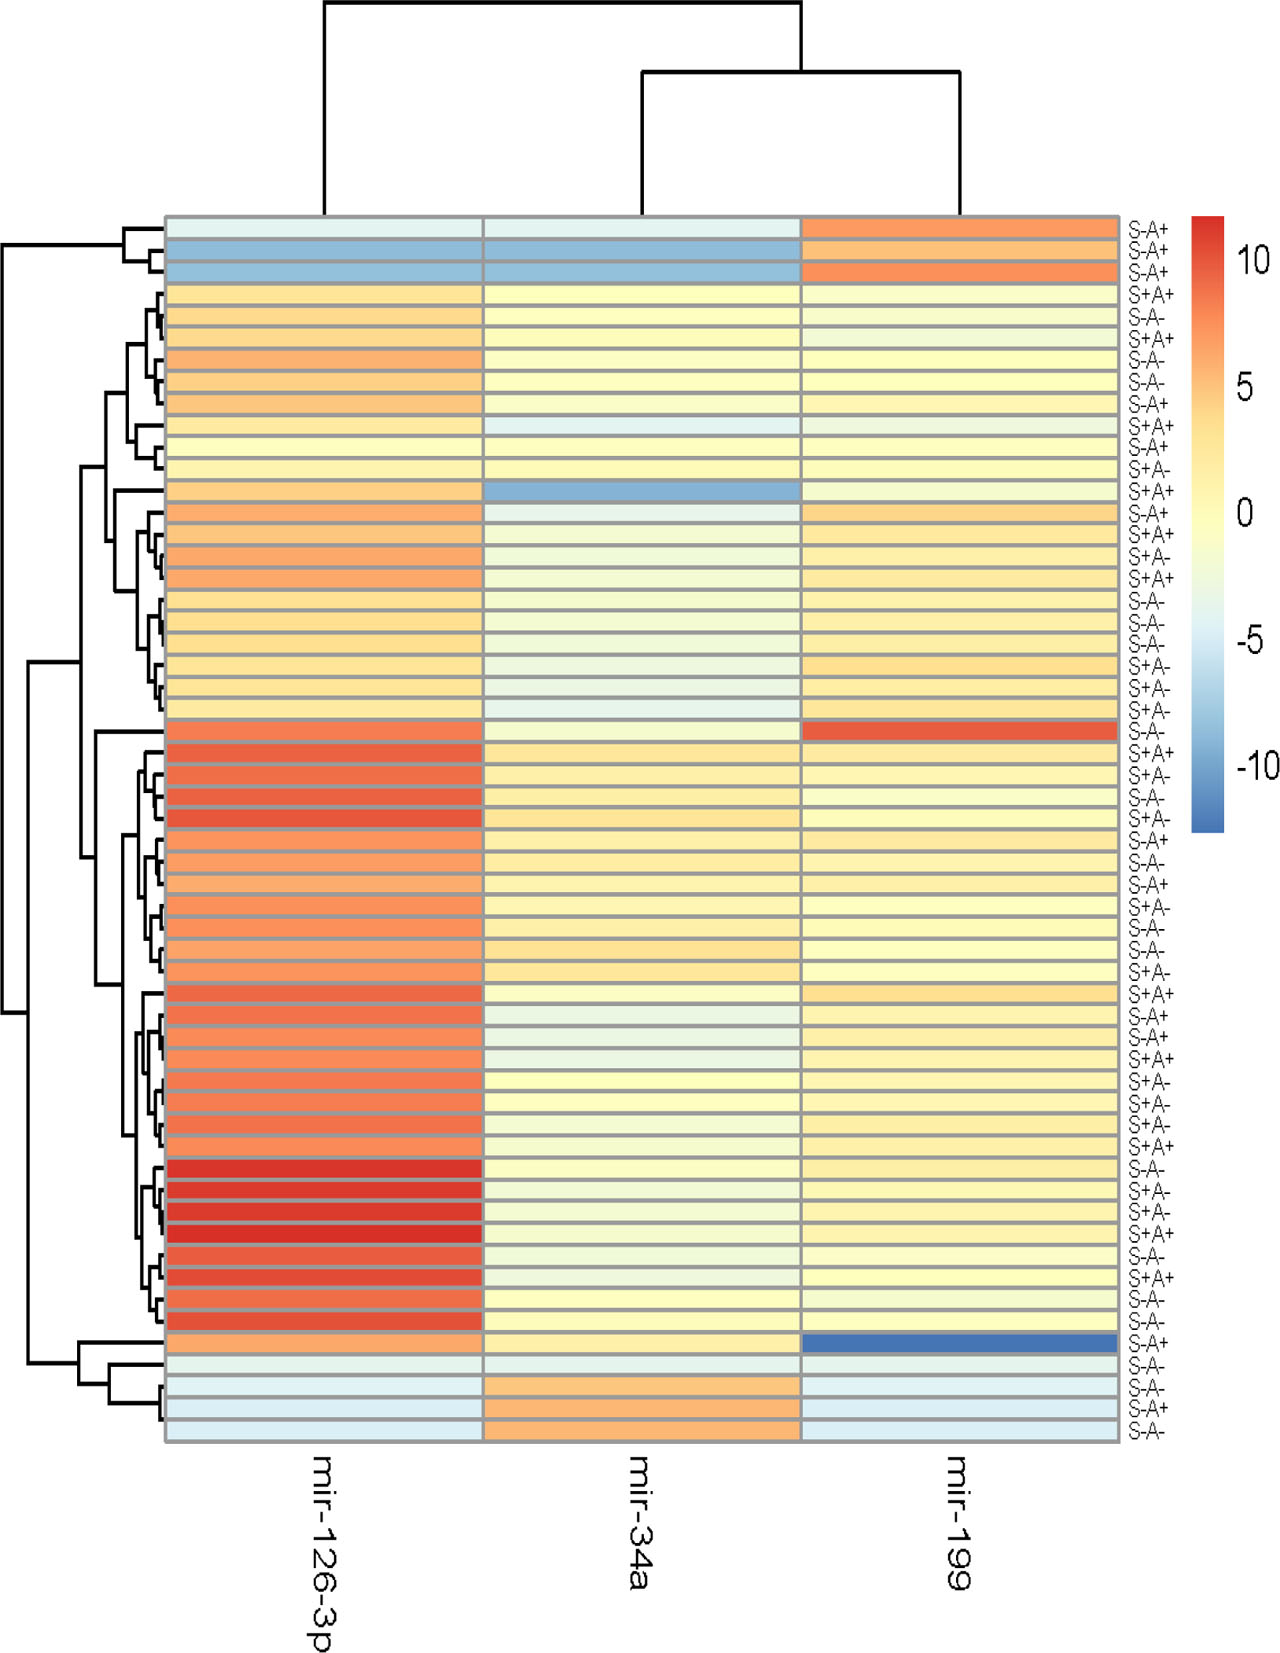
Figure 3.
Heat map for simultaneous clustering of microRNAs and participants after removal of microRNAs with non-significant FCs on the basis of -∆CT (i.e. red color: up-regulation).
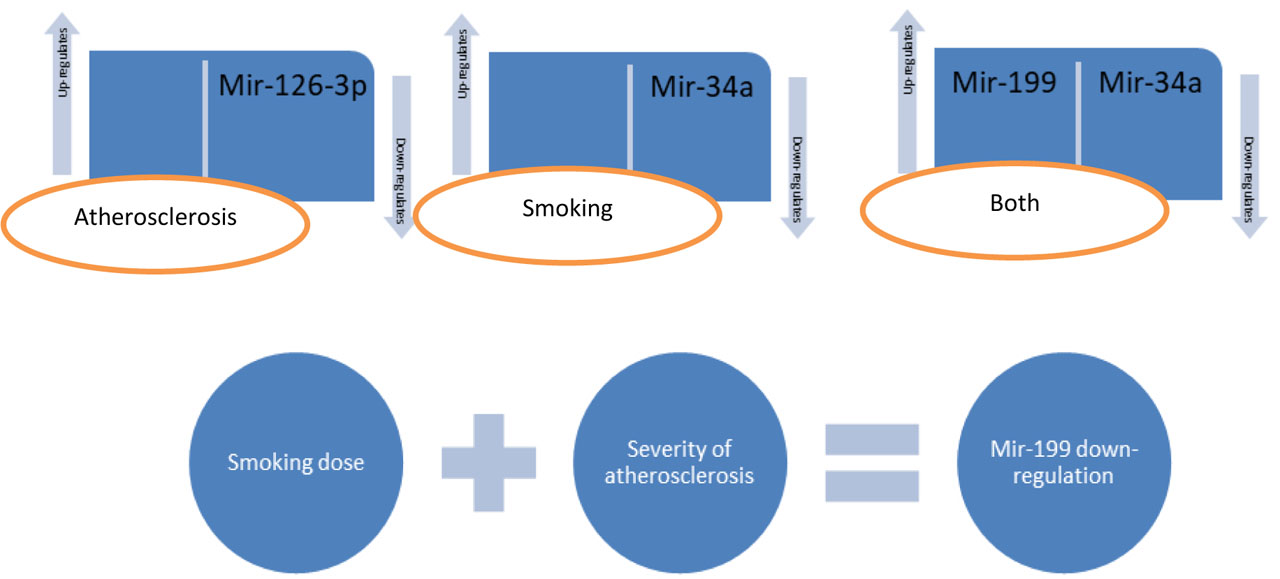
Figure 4.
Mir-34a expression may be affected by smoking, whereas mir-126-3p expression may be affected by atherosclerosis. The significant down-regulation of mir-199 for the interaction of smoking dose and severity of atherosclerosis was a notable finding showing the harmful consequence of this interaction. Further studies are needed for this micro-RNA.