Figure 1
j_rjc-2024-0022_tab_010
| Angio-CT characteristics | PPMM group (n=39) | No-PPMM group (n=25) | p-value |
|---|---|---|---|
| AAo, mm2 | 480.3±93 | 408.5±86 | 0.004 |
| d AAo, mm | 24.6±2.4 | 22.7±2.3 | 0.003 |
| Annular eccentricity | 0.23±0.05 | 0.23±0.07 | 0.886 |
| ALVOT, mm2 | 479.8±101 | 404.4±96 | 0.005 |
| d ALVOT | 24.6±2.6 | 22.5±2.5 | 0.004 |
| Ca score | 1087.4±491 | 998.4±574 | 0.523 |
| LCC Ca score | 309±174 | 271±195 | 0.440 |
| RCC Ca score | 352±219 | 280±219 | 0.218 |
| NCC Ca score | 426±251 | 426±291 | 0.994 |
| Severe leaflet calcification | 5 (13.9%) | 2 (8.3%) | 0.691 |
| Severe annular calcification | 4 (11.1%) | 3 (12.5%) | 1.000 |
| Severe LVOT calcification | 4 (11.1%) | 3 (12.5%) | 1.000 |
| hLCA | 13.5±3.7 | 13.6±3.4 | 0.945 |
| hRCA | 17.5±2.5 | 17.1±3.4 | 0.551 |
| hSTJ | 23.2±2.8 | 22.4±3.1 | 0.270 |
| NCC sinus | 32.8±3.9 | 30.5±4.1 | 0.033 |
| LCC sinus | 33.1±3.9 | 30.9±3.9 | 0.037 |
| RCC sinus | 30.3±3.7 | 28.6±3.8 | 0.099 |
| Bicuspid valve | 9 (25.0%) | 3 (12.5%) | 0.329 |
| STJ | 28.3±4.1 | 27.1±3.3 | 0.230 |
| AscAo | 35.4±4.5 | 34.7±4.2 | 0.569 |
j_rjc-2024-0022_tab_011
| Periprocedural characteristics | Unpredicted PPMM group (n=39) | Predicted PPMM group (n=25) | p-value |
|---|---|---|---|
| Valve no. | 25.5±2.3 | 23.5±2.6 | 0.003 |
| 20/23 | 13 (33.4%) | 20 (80.0%) | 0.001 |
| 26 | 19 (48.7%) | 2 (8.0%) | |
| 29 | 7 (17.9%) | 7 (12.0%) | |
| Oversizing (%) | 5.7±10.0 | 10.5±9.8 | 0.069 |
| Oversizing ≥15% | 8 (33.3%) | 8 (22.2%) | 0.383 |
| Oversizing <0% | 3 (12.5%) | 9 (25.0%) | 0.329 |
| Predilatation | 4 (10.3%) | 3 (10.3%) | 1.000 |
| Postdilatation | 12 (48.0%) | 3 (7.7%) | <0.001 |
j_rjc-2024-0022_tab_012
| Echocardiographic parameters | Unpredicted PPMM group (n=39) | Predicted PPMM group (n=25) | p-value |
|---|---|---|---|
| Aortic stenosis severity | |||
| Vmax, m/s | 2.3±0.6 | 2.5±0.3 | 0.223 |
| Mean gradient, mmHg | 13.6±6.8 | 14.4±4.1 | 0.616 |
| AVA, cm2 | 1.3±0.3 | 1.4±0.6 | 0.265 |
| AVAi, cm2/m2 | 0.7±0.2 | 0.7±0.1 | 0.871 |
| Aortic regurgitation | 0.7±0.6 | 1.0±0.8 | 0.165 |
| Left ventricle | |||
| LVEF, % | 52.3±9.6 | 56.4±10.3 | 0.116 |
| LV-GLS, % | -12.8±4.0 | -15.8±4.2 | 0.009 |
| LVMi, g/m2 | 152.9±44 | 144.7±40 | 0.451 |
| LVESVi, ml/m2 | 26.2±15.1 | 18.2±9.3 | 0.012 |
| LVEDVi, ml/m2 | 54.7±23.7 | 41.9±15.1 | 0.011 |
| LVSVi, ml/m2 | 28.1±11.8 | 23.1±8.9 | 0.072 |
| E/A | 1.0±0.4 | 1.1±0.3 | 0.578 |
| E/e’ septal | 21.2±9.1 | 19.4±10.7 | 0.490 |
| E/e’ average | 17.3±7.1 | 13.9±5.7 | 0.061 |
| Mitral regurgitation | 1.2±0.5 | 1.0±0.4 | 0.066 |
| Left Atrium | |||
| LAAi, cm2/m2 | 14.4±2.4 | 13.3±2.1 | 0.077 |
| LAVi, ml/m2 | 49.1±12.9 | 45.1±11.2 | 0.204 |
| LA-GLS, % (LAε) | -13.2±5.2 | -14.4±7.4 | 0.456 |
| SSr, s-1 | 1.1±2.7 | 0.8±0.4 | 0.496 |
| ESr, s-1 | -0.7±0.5 | -0.5±0.6 | 0.311 |
| ASr, s-1 | -1.0±0.6 | -0.9±0.6 | 0.569 |
| Right ventricle | |||
| TAPSE, cm/s | 21.2±3.8 | 21.5±3.7 | 0.801 |
| S’RV, cm/s | 11.5±2.5 | 12.2±2.6 | 0.257 |
| PASP, mmHg | 35.3±10.5 | 34.2±15.2 | 0.734 |
| FAC, % | 43.0±8.1 | 42.5±8.4 | 0.822 |
| RV-GLS, % | -18.3±6.0 | -18.0±5.9 | 0.842 |
| RV-FWLS, % | -22.7±8.5 | -22.1±7.3 | 0.789 |
| RV-IVS, % | -12.5±5.5 | -13.4±5.1 | 0.595 |
| RA, mm | 36.7±6.3 | 37.9±6.9 | 0.882 |
| RV, mm | 34.3±5.8 | 34.9±6.4 | 0.713 |
Clinical characteristics according to PPMM group
| Demographic and clinical characteristics | All patients (n=160) | PPMM group (n=64) | No-PPMM group (n=96) | p-value |
|---|---|---|---|---|
| Age (years) | 76.5 ± 7.4 | 76.3±7.8 | 76.6±7.1 | 0.818 |
| Sex (female) | 75 (46.9%) | 37 (57.8%) | 38 (39.6%) | 0.024 |
| BMI (kg/m2) | 27.5 ± 4.7 | 28.5±5.0 | 26.9±4.5 | 0.033 |
| BSA (m2) | 1.8 ± 0.2 | 1.9±0.2 | 1.8±0.2 | 0.124 |
| Symptoms | ||||
| Angina | 93 (58.5%) | 35 (54.7%) | 58 (61.1%) | 0.424 |
| Syncope | 12 (7.5%) | 8 (12.5%) | 4 (4.2%) | 0.068 |
| Pulmonary oedema | 23 (14.5%) | 11 (17.2%) | 12 (12.6%) | 0.423 |
| NYHA functional class | 2.8±0.6 | 2.8±0.5 | 2.8±0.6 | 0.466 |
| Class 2 | 46 (28.9%) | 16 (25.0%) | 30 (31.6%) | 0.659 |
| Class 3 | 103 (64.8%) | 44 (68.8%) | 59 (62.1%) | |
| Class 4 | 10 (6.3%) | 4 (6.3%) | 6 (6.3%) | |
| Comorbidities | ||||
| Cardiac | ||||
| Atrial fibrillation | 50 (31.4%) | 22 (34.4%) | 28 (29.5%) | 0.514 |
| CAD | 87 (54.7%) | 30 (46.9%) | 57 (60.0%) | 0.103 |
| Prior MI | 22(13.8%) | 7 (10.9%) | 15 (15.8%) | 0.385 |
| Prior CABG | 8 (5.0%) | 1 (1.6%) | 7 (7.4%) | 0.145 |
| Prior PCI | 38 (23.9%) | 15 (23.4%) | 23 (24.2%) | 0.911 |
| Other | ||||
| Obesity | 37 (23.1%) | 18 (28.1%) | 19 (19.8%) | 0.221 |
| Type 2 DM | 45 (28.3%) | 18 (28.1%) | 27 (28.4%) | 0.968 |
| Systemic hypertension | 142 (88.8%) | 59 (92.2%) | 83 (86.5%) | 0.261 |
| COPD | 18 (11.3%) | 7 (10.9%) | 11 (11.5%) | 0.919 |
| Cirrhosis | 16 (10.1%) | 6 (9.4%) | 10 (10.5%) | 0.813 |
| PAD | 19 (11.9%) | 6 (9.4%) | 13 (13.7%) | 0.411 |
| CKD (≥3) | 32 (20.1%) | 16 (25.0%) | 16 (16.8%) | 0.208 |
| Frailty | 63 (39.5%) | 26 (40.6%) | 37 (38.9%) | 0.832 |
Echocardiographic changes after TAVI according to PPMM group
| Echocardiographic parameters | PPMM group (n=64) | No-PPMM group (n=96) | ||||
|---|---|---|---|---|---|---|
| Baseline | 1m post-TAVI | p-value | Baseline | 1m post TAVI | p-value | |
| Aortic stenosis severity | ||||||
| Vmax, m/s | 4.6±0.8 | 2.4±0.6 | <0.001 | 4.6±0.7 | 2.1±0.3 | <0.001 |
| Mean gradient, mmHg | 57.4±19.4 | 14.05.8 | <0.001 | 56.3±18.6 | 10.4±3.1 | <0.001 |
| AVA, cm2 | 0.67±0.3 | 1.3±0.3 | <0.001 | 0.77±0.3 | 2.0±0.6 | <0.001 |
| AVAi, cm2/m2 | 0.37±0.2 | 0.7±0.1 | <0.001 | 0.44±0.2 | 1.1±0.3 | <0.001 |
| Aortic regurgitation | 1.2±0.6 | 0.8±0.6 | 0.001 | 1.3±0.7 | 0.8±0.6 | <0.001 |
| Left ventricle | ||||||
| LVEF, % | 51.5±12.6 | 53.9±10.0 | 0.242 | 52.0±11.2 | 54.3±9.2 | 0.132 |
| LV-GLS, % | -11.9±4.0 | -13.9±4.3 | 0.008 | -12.6±4.3 | -14.2±3.6 | 0.009 |
| LVMi, g/m2 | 174.7±46 | 149.7±42 | 0.002 | 181.4±50 | 159.7±40 | 0.001 |
| LVESVi, ml/m2 | 27.2±18.2 | 23.0±13.6 | 0.147 | 28.3±15.3 | 23.7±13.6 | 0.028 |
| LVEDVi, ml/m2 | 54.7±20.0 | 49.6±21.5 | 0.174 | 57.4±19.5 | 50.9±18.0 | 0.018 |
| LVSVi, ml/m2 | 27.0±8.7 | 26.1±10.9 | 0.606 | 28.4±8.6 | 26.7±8.4 | 0.172 |
| E/A | 1.3±0.8 | 1.0±0.4 | 0.024 | 1.1±0.8 | 0.8±0.5 | 0.003 |
| E/e’ septal | 23.2±13.1 | 20.5±9.7 | 0.203 | 21.6±10.7 | 18.2±7.1 | 0.012 |
| E/e’ lateral | 17.0±11.3 | 13.8±6.6 | 0.062 | 15.0±8.1 | 13.8±7.4 | 0.277 |
| E/e’ average | 18.1±9.2 | 16.0±6.7 | 0.157 | 16.6±7.4 | 15.3±6.7 | 0.231 |
| Mitral regurgitation | 1.3±0.6 | 1.2±0.5 | 0.326 | 1.3±0.6 | 1.0±0.4 | <0.001 |
| Left Atrium | ||||||
| LAAi, cm2/m2 | 14.8±2.4 | 13.9±2.3 | 0.036 | 15.0±3.7 | 14.0±3.5 | 0.052 |
| LAVi, ml/m2 | 53.0±13.1 | 47.5±12.3 | 0.015 | 54.4±21.2 | 48.6±19.7 | 0.052 |
| LA-GLS, % (LAε) | -10.2±5.5 | -13.7±6.1 | 0.001 | -13.8±7.1 | -16.9±7.4 | 0.004 |
| SSr, s-1 | 0.50±0.5 | 1.0±2.1 | 0.080 | 0.76±0.6 | 0.8±0.4 | 0.476 |
| ESr, s-1 | -0.31±0.5 | -0.6±0.5 | 0.001 | -0.38±0.5 | -0.5±0.6 | 0.168 |
| ASr, s-1 | -0.71±0.6 | -1.0±0.6 | 0.024 | -0.97±0.6 | -1.3±0.6 | 0.004 |
| Right ventricle | ||||||
| TAPSE, cm/s | 2.0±0.4 | 21.3±3.7 | 0.122 | 2.0±0.4 | 20.5±3.9 | 0.712 |
| S’RV, cm/s | 10.4±2.9 | 11.8±2.5 | 0.004 | 10.5±3.1 | 12.4±7.8 | 0.031 |
| PASP, mmHg | 42.0±16.3 | 34.9±12.4 | 0.017 | 37.8±14.3 | 31.5±11.1 | <0.001 |
| FAC, % | 40.7±8.1 | 42.8±8.2 | 0.211 | 40.5±8.0 | 43.0±6.8 | 0.023 |
| RV-GLS, % | -16.1±5.7 | -18.2±5.9 | 0.039 | -17.0±6.3 | -18.6±5.6 | 0.162 |
| RV-FWLS, % | -20.4±7.6 | -22.5±8.0 | 0.111 | -22.0±7.5 | -23.4±7.4 | 0.450 |
| RV-IVS, % | -9.2±6.8 | -12.8±5.3 | 0.003 | -12.1±5.3 | -12.9±4.6 | 0.393 |
| RA, mm | 38.5±8.5 | 36.8±6.5 | 0.276 | 36.9±8.5 | 35.5±8.3 | 0.248 |
| RV, mm | 35.4±5.6 | 34.5±6.0 | 0.613 | 34.1±6.4 | 33.2±5.9 | 0.283 |
Echocardiographic differences between groups 1-month after TAVI (short-term effects of PPMM on cardiac function)
| Echocardiographic parameters | PPMM group (n=64) | No-PPMM group (n=96) | p-value |
|---|---|---|---|
| Aortic stenosis severity | |||
| Vmax, m/s | 2.4±0.6 | 2.1±0.3 | 0.001 |
| Mean gradient, mmHg | 14.05.8 | 10.4±3.1 | <0.001 |
| AVA, cm2 | 1.3±0.3 | 2.0±0.6 | <0.001 |
| AVAi, cm2/m2 | 0.7±0.1 | 1.1±0.3 | <0.001 |
| DVI | 0.42±0.1 | 0.57±0.1 | <0.001 |
| Aortic regurgitation | 0.8±0.6 | 0.8±0.6 | 0.956 |
| Left ventricle | |||
| LVEF, % | 53.9±10.0 | 54.3±9.2 | 0.810 |
| LV-GLS, % | -13.9±4.3 | -14.2±3.6 | 0.674 |
| LVMi, g/m2 | 149.7±42 | 159.7±40 | 0.132 |
| LVESVi, ml/m2 | 23.0±13.6 | 23.7±13.6 | 0.768 |
| LVEDVi, ml/m2 | 49.6±21.5 | 50.9±18.0 | 0.689 |
| LVSVi, ml/m2 | 26.1±10.9 | 26.7±8.4 | 0.723 |
| E/A | 1.0±0.4 | 0.8±0.5 | 0.019 |
| E/e’ septal | 20.5±9.7 | 18.2±7.1 | 0.084 |
| E/e’ lateral | 13.8±6.6 | 13.8±7.4 | 0.987 |
| E/e’ average | 16.0±6.7 | 15.3±6.7 | 0.504 |
| Mitral regurgitation | 1.2±0.5 | 1.0±0.4 | 0.118 |
| Left Atrium | |||
| LAAi, cm2/m2 | 13.9±2.3 | 14.0±3.5 | 0.980 |
| LAVi, ml/m2 | 47.5±12.3 | 48.6±19.7 | 0.682 |
| LA-GLS, % (LAε) | 13.7±6.1 | 16.9±7.4 | 0.005 |
| SSr, s-1 | 1.0±2.1 | 0.8±0.4 | 0.459 |
| ESr, s-1 | -0.6±0.5 | -0.5±0.6 | 0.214 |
| ASr, s-1 | -1.0±0.6 | -1.3±0.6 | 0.013 |
| Right ventricle | |||
| TAPSE, cm/s | 21.3±3.7 | 20.5±3.9 | 0.179 |
| S’RV, cm/s | 11.8±2.5 | 12.4±7.8 | 0.517 |
| SPAP, mmHg | 34.9±12.4 | 31.5±11.1 | 0.075 |
| FAC, % | 42.8±8.2 | 43.0±6.8 | 0.881 |
| RV-GLS, % | -18.2±5.9 | -18.6±5.6 | 0.648 |
| RV-FWLS, % | -22.5±8.0 | -23.4±7.4 | 0.497 |
| RV-IVS, % | -12.8±5.3 | -12.9±4.6 | 0.946 |
| RA, mm | 36.8±6.5 | 35.5±8.3 | 0.270 |
| RV, mm | 34.5±6.0 | 33.2±5.9 | 0.161 |
j_rjc-2024-0022_tab_006
| Echocardiographic characteristics | All patients (n=160) | PPMM group (n=64) | No-PPMM group (n=96) | p-value |
|---|---|---|---|---|
| Aortic stenosis severity | ||||
| Vmax, m/s | 4.6±0.8 | 4.6±0.8 | 4.6±0.7 | 0.704 |
| Mean gradient, mmHg | 56.7 ±18.9 | 57.4±19.4 | 56.3±18.6 | 0.708 |
| AVA, cm2 | 0.73±0.3 | 0.67±0.3 | 0.77±0.3 | 0.039 |
| AVAi, cm2/m2 | 0.41±0.2 | 0.37±0.2 | 0.44±0.2 | 0.015 |
| dLVOT, mm | 21.8±2.5 | 22.3±2.3 | 0.244 | |
| Bicuspid valve AS | 30 (20.0%) | 11 (19.3%) | 19 (20.4%) | 0.866 |
| Aortic regurgitation | 1.2±0.7 | 1.2±0.6 | 1.3±0.7 | 0.486 |
| Left ventricle | ||||
| LVEF, % | 51.8±11.8 | 51.5±12.6 | 52.0±11.2 | 0.781 |
| LVESVi, ml/m2 | 27.9±16.5 | 27.2±18.2 | 28.3±15.3 | 0.677 |
| LVEDVi, ml/m2 | 56.3±20.0 | 54.7±20.0 | 57.4±19.5 | 0.416 |
| LVSVi, ml/m2 | 27.8±8.6 | 27.0±8.7 | 28.4±8.6 | 0.330 |
| LV-GLS, % | -12.3±4.2 | -11.9±4.0 | -12.6±4.3 | 0.276 |
| LVMi, g/m2 | 178.7±48.9 | 174.7±46 | 181.4±50 | 0.396 |
| E/A | 1.2±0.8 | 1.3±0.8 | 1.1±0.8 | 0.227 |
| E/e’ septal | 22.3±11.7 | 23.2±13.1 | 21.6±10.7 | 0.420 |
| E/e’ lateral | 15.9±9.6 | 17.0±11.3 | 15.0±8.1 | 0.217 |
| E/e’ average | 17.2±8.3 | 18.1±9.2 | 16.6±7.4 | 0.250 |
| Mitral regurgitation | 1.3±0.6 | 1.3±0.6 | 1.3±0.6 | 0.735 |
| Left atrium | ||||
| LAAi, cm2/m2 | 14.9±3.2 | 14.8±2.4 | 15.0±3.7 | 0.783 |
| LAVi, ml/m2 | 53.8±18.4 | 53.0±13.1 | 54.4±21.2 | 0.607 |
| LA-GLS, % (LAε) | 12.3±6.7 | 10.2±5.5 | 13.8±7.1 | 0.001 |
| SSr, s-1 | 0.66±0.6 | 0.50±0.5 | 0.76±0.6 | 0.007 |
| ESr, s-1 | -0.35±0.5 | -0.31±0.5 | -0.38±0.5 | 0.385 |
| ASr, s-1 | -0.88±0.6 | -0.71±0.6 | -0.97±0.6 | 0.033 |
| Right ventricle | ||||
| TAPSE, cm | 2.0±0.4 | 2.0±0.4 | 2.0±0.4 | 0.968 |
| S’RV, cm/s | 10.5±3.0 | 10.4±2.9 | 10.5±3.1 | 0.745 |
| SPAP, mmHg | 40.5±15 | 42.0±16.3 | 37.8±14.3 | 0.244 |
| FAC, % | 40.7±8.1 | 40.7±8.1 | 40.5±8.0 | 0.740 |
| RV-GLS, % | -16.8±6.1 | -16.1±5.7 | -17.0±6.3 | 0.185 |
| RV-FWLS, % | -21.5±7.6 | -20.4±7.6 | -22.0±7.5 | 0.071 |
| RV-IVS, % | -11.0±6.1 | -9.2±6.8 | -12.1±5.3 | 0.006 |
| RA, mm | 37.5±8.5 | 38.5±8.5 | 36.9±8.5 | 0.306 |
| RV, mm | 34.5±6.1 | 35.4±5.6 | 34.1±6.4 | 0.352 |
Univariable and multivariable predictors of PPMM (binary logistic regression)
| Regresion analysis | PPMM (Model 1) | Unpredicted PPMM (Model 2) | Predicted PPMM (Model 3) | |||||||||
|---|---|---|---|---|---|---|---|---|---|---|---|---|
| Univariable | Multivariable | Univariable | Multivariable | Univariable | Multivariable | |||||||
| Univariable regression analysis | OR | p-value | OR | p-value | OR | p-value | OR | p-value | OR | p-value | OR | p-value |
| Perioperative characteristics | ||||||||||||
| Age | 0.99 | 0.590 | 0.97 | 0.279 | 1.04 | 0.292 | ||||||
| Sex (f) | 2.09 | 0.024 | 0.96 | 0.917 | 4.47 | 0.003 | ||||||
| BMI | 1.08 | 0.032 | 1.10 | 0.012 | 0.96 | 0.337 | 1.24 | <0.001 | 1.26 | <0.001 | ||
| BSA | 3.51 | 0.108 | 0.59 | 0.547 | 23.7 | 0.005 | ||||||
| Obesity | 1.59 | 0.223 | 0.66 | 0.380 | 3.29 | 0.009 | ||||||
| AAo | 0.99 | 0.018 | 1.00 | 0.601 | 0.99 | <0.001 | ||||||
| dLVOT | 0.87 | 0.035 | 1.06 | 0.459 | 0.69 | <0.001 | ||||||
| Ca score | 1.000 | 0.328 | 1.000 | 0.780 | 1.000 | 0.325 | ||||||
| Valve no. | 0.809 | 0.003 | 0.79 | 0.001 | 1.009 | 0.900 | 0.639 | <0.001 | 0.584 | <0.001 | ||
| Valve 20/23 | 2.720 | 0.003 | 1.270 | 0.537 | 9.500 | <0.001 | ||||||
| Oversizing | 0.981 | 0.213 | 0.964 | 0.043 | 1.014 | 0.476 | ||||||
| Postdilation | 1.327 | 0.474 | 0.253 | 0.031 | 0.174 | 0.021 | 5.011 | 0.001 | 3.165 | 0.040 | ||
| Postoperative caracteristics (30-day follow-up) | ||||||||||||
| LA-GLS | 0.935 | 0.006 | 0.921 | 0.022 | 0.937 | 0.019 | 0.931 | 0.014 | 0.972 | 0.357 | ||
| LAVI | 0.999 | 0.980 | 1.004 | 0.704 | 0.984 | 0.317 | ||||||
| E/A | 3.113 | 0.034 | 1.812 | 0.212 | 2.243 | 0.120 | 2.789 | 0.074 | ||||
| LVEF | 0.996 | 0.809 | 0.975 | 0.178 | 1.036 | 0.205 | ||||||
| LV-GLS | 1.019 | 0.672 | 1.124 | 0.024 | 0.867 | 0.028 | 0.809 | 0.015 | ||||
| LVMi | 0.995 | 0.133 | 0.998 | 0.627 | 0.991 | 0.146 | ||||||
| PAPS | 1.025 | 0.081 | 1.022 | 0.140 | 1.011 | 0.529 | ||||||
Predictors of mortality (Cox regression analysis)
| Mortality | Univariable analysis | Multivariable analysis | ||||
|---|---|---|---|---|---|---|
| Clinical parameters | HR | 95% CI | p-value | HR | 95% CI | p-value |
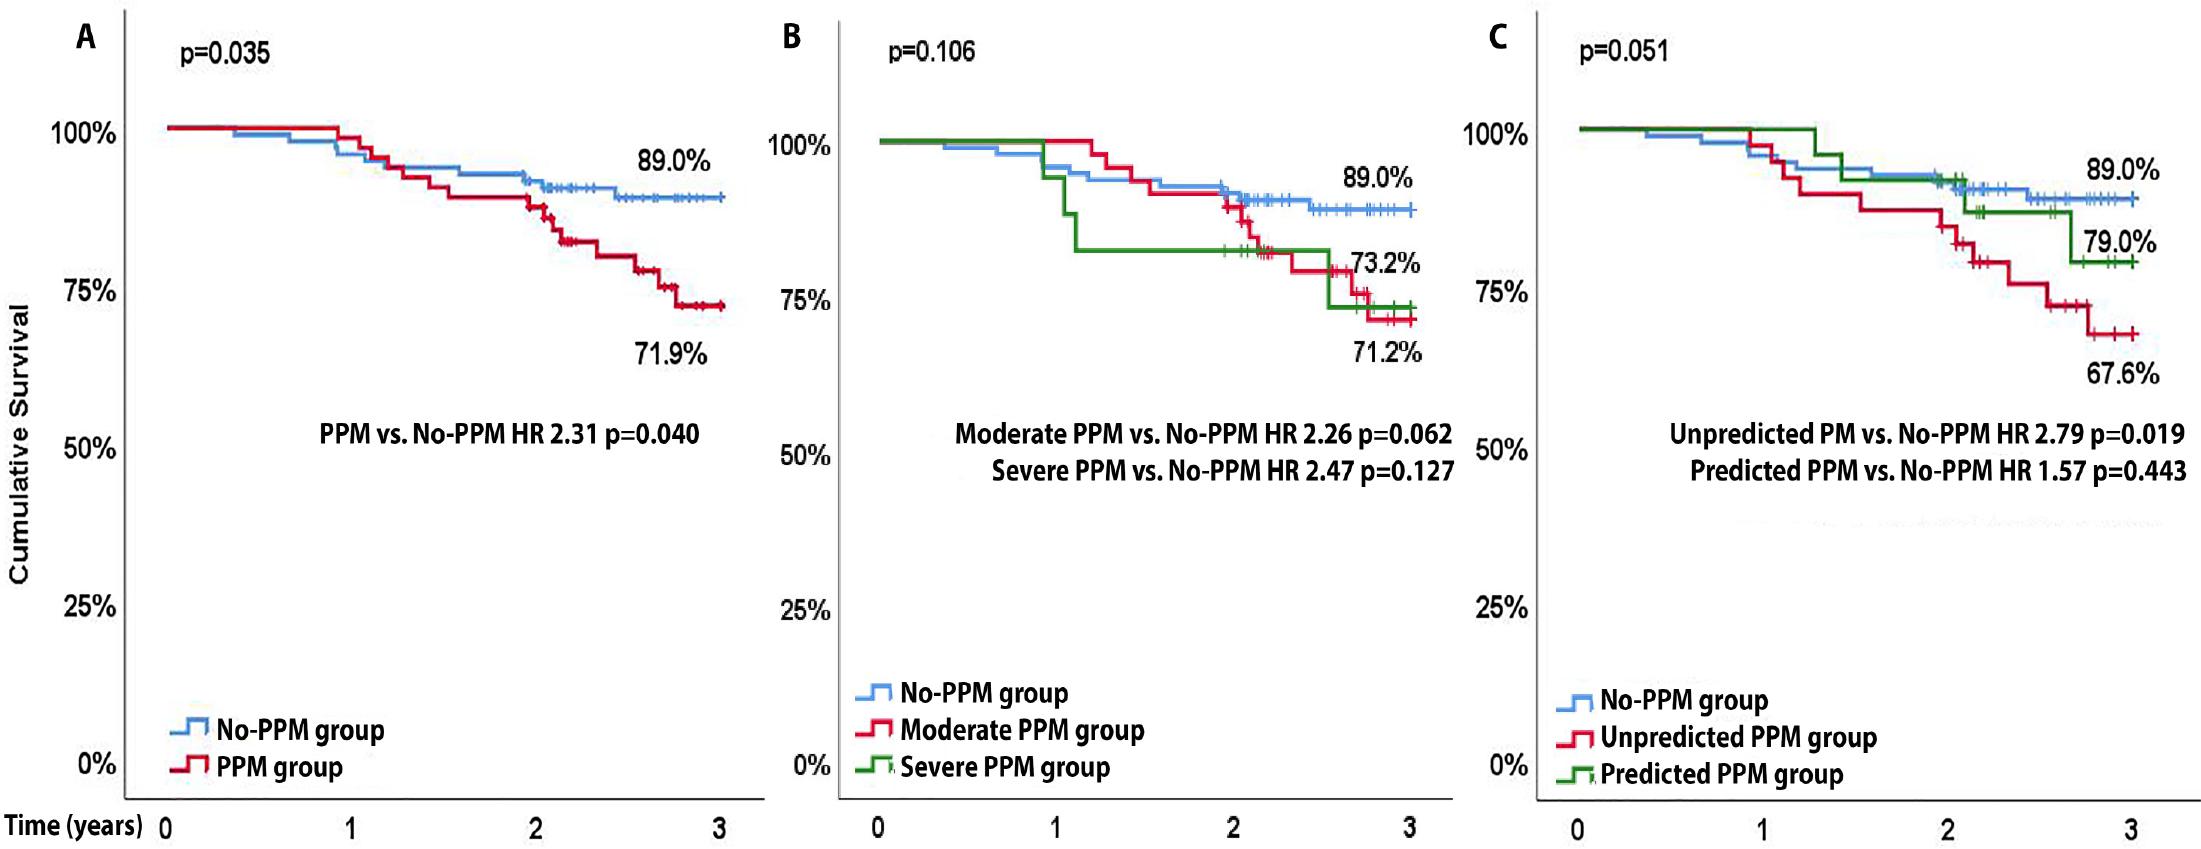
| PPMM (measured EOAi) | 0.56 | 0.15-2.09 | 0.384 | |||
| PPMM ≤0.85 | 2.31 | 1.04-5.15 | 0.040 | 5.92 | 1.92-18.2 | 0.002 |
| PPMM BMI adjusted ≤0.85/0.70 | 2.45 | 1.12-5.37 | 0.025 | |||
| Valve predicted PPM (prosthesis predicted EOAi) | 0.99 | 0.03-35.8 | 0.993 | |||
| Predicted PPMM | 1.05 | 0.36-3.05 | 0.936 | |||
| Unpredicted PPMM | 2.50 | 1.13-5.50 | 0.023 | |||
| Transvalvular mean gradient | 1.07 | 1.00-1.15 | 0.054 | |||
| Post-dilation | 1.80 | 0.75-4.32 | 0.189 | |||
| LAVi | 1.01 | 1.00-1.03 | 0.118 | |||
| LA-GLS | 0.94 | 0.89-1.00 | 0.050 | |||
| LA-GLS<19 | 3.11 | 1.06-9.12 | 0.038 | |||
| E/A | 1.95 | 1.02-3.73 | 0.044 | 2.07 | 0.90-4.77 | 0.088 |
| LVEF | 1.04 | 0.99-1.04 | 0.170 | |||
j_rjc-2024-0022_tab_007
| Angio-CT characteristics | All patients (n=160) | PPMM group (n=64) | No-PPMM group (n=96) | p-value |
|---|---|---|---|---|
| AAo, mm2 | 473.7±90 | 452.4±95 | 487.8±84 | 0.018 |
| d AAo, mm | 24.4±2.4 | 23.9±2.5 | 24.8±2.2 | 0.012 |
| Annular eccentricity | 0.23±0.06 | 0.23±0.05 | 0.23±0.07 | 0.367 |
| ALVOT, mm2 | 468.9±101 | 450.1±105 | 481.4±97 | 0.061 |
| d ALVOT | 24.3±2.6 | 23.8±2.8 | 24.6±2.5 | 0.048 |
| Ca score | 1112.5±618 | 1051.8±523 | 1152.5±673 | 0.329 |
| LCC Ca score | 335.5±226 | 294±182 | 362±248 | 0.067 |
| RCC Ca score | 321.1±214 | 323±220 | 319±211 | 0.922 |
| NCC Ca score | 457.7±302 | 426±265 | 478±324 | 0.302 |
| Severe leaflet calcification | 22 (14.6%) | 7 (11.7%) | 15 (16.5%) | 0.412 |
| Severe annular calcification | 20 (13.2%) | 7 (11.7%) | 13 (14.3%) | 0.642 |
| Severe LVOT calcification | 17 (11.3%) | 7 (11.7%) | 10 (11.1%) | 0.916 |
| hLCA | 14.3±3.7 | 13.5±3.5 | 14.9±3.8 | 0.032 |
| hRCA | 18.0±2.9 | 17.3±2.9 | 18.5±2.9 | 0.017 |
| hSTJ | 23.1±3.6 | 22.9±2.9 | 23.3±3.9 | 0.494 |
| NCC sinus | 32.8±4.1 | 31.9±4.1 | 33.3±3.9 | 0.285 |
| LCC sinus | 32.6±4.1 | 32.3±4.1 | 32.9±4.2 | 0.038 |
| RCC sinus | 30.5±3.9 | 29.6±3.8 | 31.0±4.0 | 0.030 |
| Bicuspid valve | 30 (19.9%) | 12 (20%) | 18 (19.8%) | 0.974 |
| STJ | 28.4±4.0 | 27.8±3.8 | 28.7±4.1 | 0.185 |
| AscAo | 35.5±5.1 | 35.1±4.4 | 35.8±5.5 | 0.403 |
j_rjc-2024-0022_tab_008
| Periprocedural characteristics | All patients (n=160) | PPMM group (n=64) | No-PPMM group (n=96) | p-value |
|---|---|---|---|---|
| Valve no. | 25.4±2.5 | 24.7±2.6 | 25.9±2.3 | 0.004 |
| 20/23 | 60 (37.6%) | 33 (51.6%) | 27 (28.1%) | 0.010 |
| 26 | 65 (40.6%) | 21 (32.8%) | 44 (45.8%) | |
| 29 | 35 (21.9%) | 10 (15.6%) | 25 (26.0%) | |
| Oversizing (%) | 9.0±11.2 | 7.6±10.1 | 10.0±11.9 | 0.213 |
| Oversizing ≥15% | 45 (29.8%) | 16 (26.7%) | 29 (31.9%) | 0.494 |
| Oversizing <0% | 28 (18.5%) | 12 (20.0%) | 16 (17.6%) | 0.708 |
| Pre-dilation | 20 (13.2%) | 7 (11.7%) | 13 (14.3%) | 0.642 |
| Post-dilation | 33 (20.6%) | 15 (23.4%) | 18 (18.8%) | 0.476 |
j_rjc-2024-0022_tab_009
| Echocardiographic characteristics | Unpredicted PPMM group (n=39) | Predicted PPMM group (n=25) | p-value |
|---|---|---|---|
| Aortic stenosis severity | |||
| Vmax, m/s | 4.5±0.8 | 4.8±0.8 | 0.104 |
| Mean gradient, mmHg | 55.0±18.9 | 61.3±19.9 | 0.203 |
| AVA, cm2 | 0.69±0.3 | 0.65±0.2 | 0.618 |
| AVAi, cm2/m2 | 0.38±0.2 | 0.35±0.1 | 0.305 |
| Aortic regurgitation | 1.2±0.6 | 1.2±0.8 | 0.785 |
| Left ventricle | |||
| LVEF, % | 49.1±13.3 | 55.3±10.7 | 0.055 |
| LVESVi, ml/m2 | 31.3±20.6 | 20.7±11.2 | 0.010 |
| LVEDVi, ml/m2 | 59.9±23.0 | 46.7±12.8 | 0.005 |
| LVSVi, ml/m2 | 28.1±8.6 | 25.4±8.8 | 0.221 |
| LV-GLS, % | -11.6±4.3 | -12.3±3.4 | 0.482 |
| LVMi, g/m2 | 178.4±42 | 169.0±52 | 0.432 |
| E/A | 1.5±0.9 | 1.1±0.5 | 0.103 |
| E/e’ septal | 24.0±12.9 | 19.3±13.6 | 0.525 |
| E/e’ average | 19.3±10.3 | 16.2±6.9 | 0.186 |
| Mitral regurgitation | 1.4±0.7 | 1.1±0.4 | 0.041 |
| Left atrium | |||
| LAAi, cm2/m2 | 15.4±2.5 | 14.0±2.0 | 0.027 |
| LAVi, ml/m2 | 55.2±13.7 | 49.6±11.6 | 0.093 |
| LA-GLS, % (LAε) | -9.6±4.8 | -11.2±6.4 | 0.236 |
| SSr, s-1 | 0.45±0.5 | 0.58±0.5 | 0.305 |
| ESr, s-1 | -0.32±0.5 | -0.30±0.5 | 0.927 |
| ASr, s-1 | -0.67±0.6 | -0.76±0.7 | 0.614 |
| Right ventricle | |||
| TAPSE, cm | 2.0±0.4 | 2.1±0.4 | 0.711 |
| S’RV, cm/s | 10.0±2.6 | 11.0±3.0 | 0.134 |
| PASP, mmHg | 42.3±16.7 | 39.2±15.2 | 0.459 |
| FAC, % | 40.5±8.4 | 41.7±8.4 | 0.581 |
| RV-GLS, % | -15.6±5.5 | -16.5±5.8 | 0.555 |
| RV-FWLS, % | -20.3±7.4 | -20.0±7.3 | 0.876 |
| RV-IVS, % | -10.2±5.3 | -8.0±8.1 | 0.221 |
| RA, mm | 39.1±9.8 | 37.1±6.5 | 0.373 |
| RV, mm | 35.0±6.0 | 35.2±6.7 | 0.916 |