
Figure 1
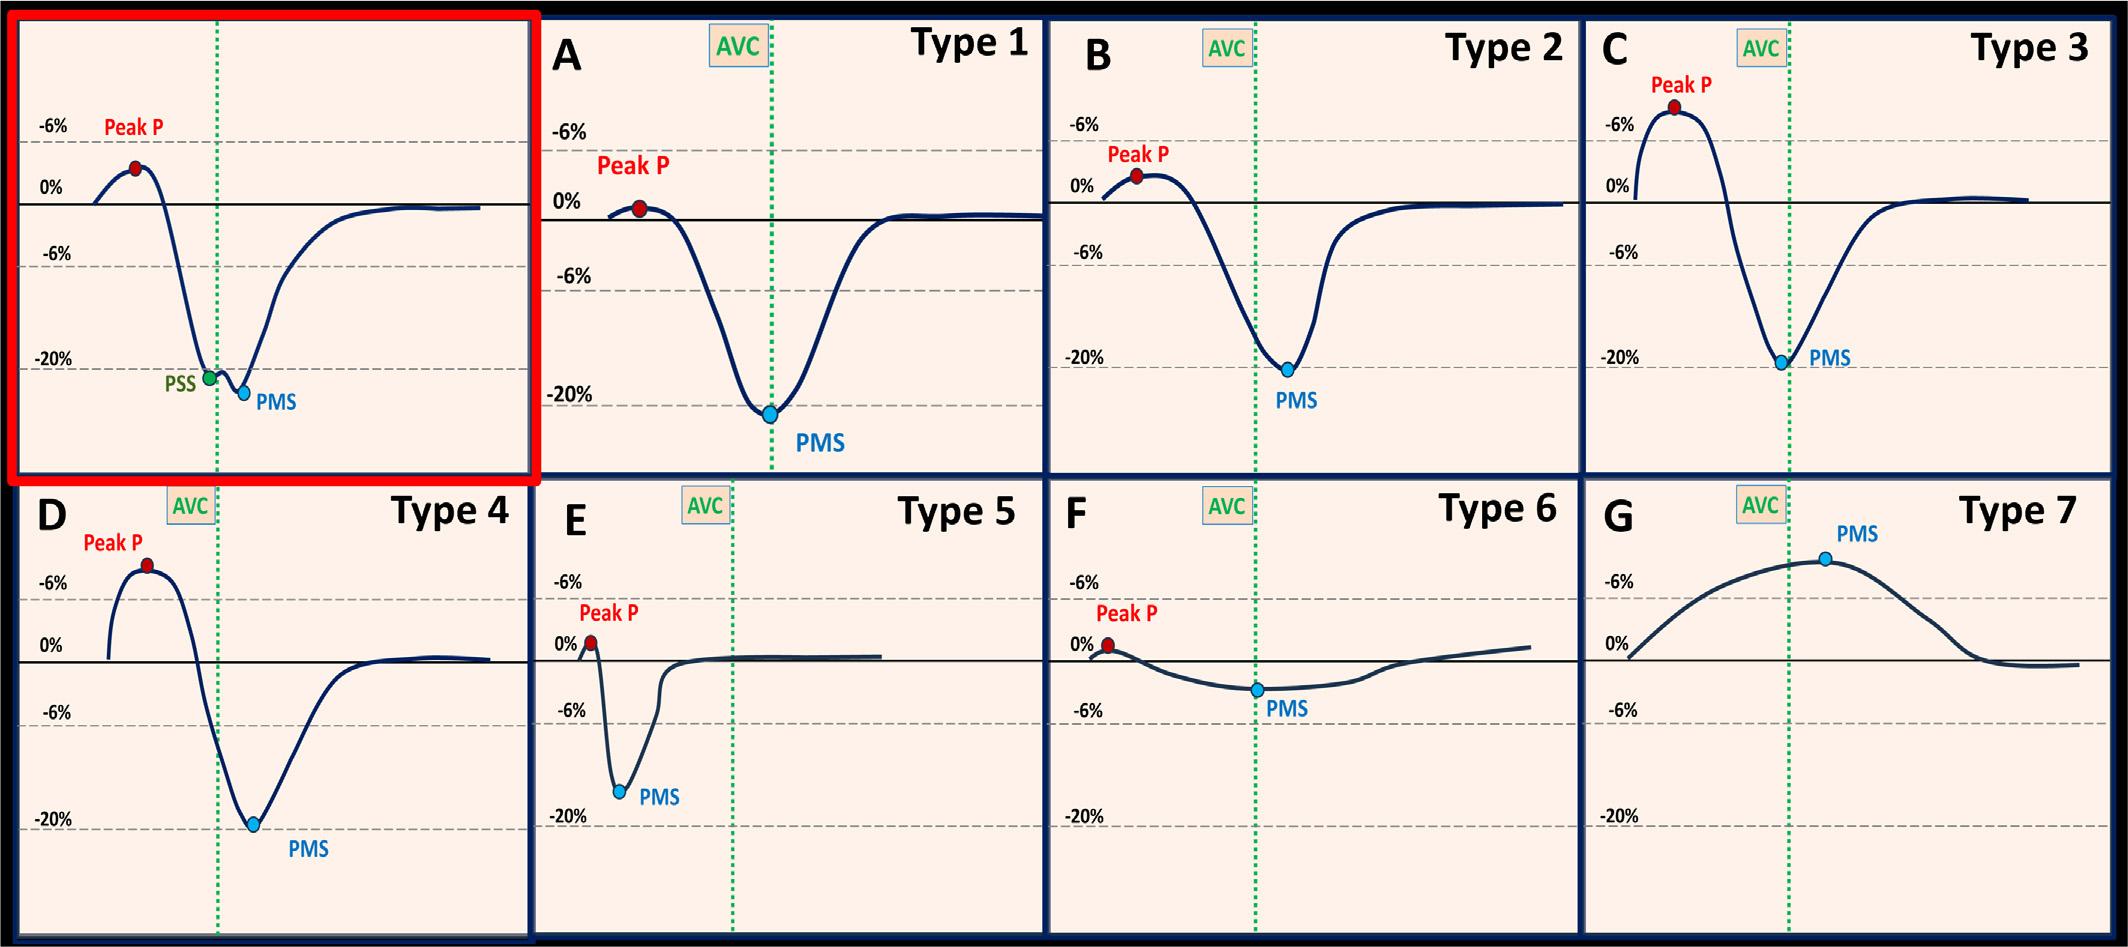
Figure 2
Characteristics of longitudinal strain curves
| Peak P (%) | PMS (%) | TPMS (ms) | Characteristics | |
|---|---|---|---|---|
| Type 1 (T1) | <6 | ≥6 | Before AVC | Normal segmental activation (Figure 1A) |
| Type 2 (T2) | <6 | ≥6 | After AVC | Post systolic deformation (Figure 1B) |
| Type 3 (T3) | ≥6 | ≥6 | Before AVC | ISL followed by normal segmental activation (Figure 1 C) |
| Type 4 (T4) | ≥6 | ≥6 | After AVC | ISL followed by post systolic deformation (Figure 1 D) |
| Type 5 (T5) | <6 | ≥6 | First third of systole | Early systolic shortening followed by no active event during systole (Figure 1E) |
| Type 6 (T6) | <6 | <6 | - | No active event during systole (figure 1F) |
| Type 7 (T7) | ≥6 | <6 | - | Holo-systolic lengthening (Figure 1G) |
Anthropometric and conventional two dimensional and Doppler echocardiography measurements
| Unit | Control group (n=100) | Ischemic group (n=50) | |
|---|---|---|---|
| Age | (years) | 45±14 | 54±16* |
| SBP | (mmHg) | 118±14 | 118±18 |
| DBP | (mmHg) | 71±9 | 72±9 |
| HR | (bpm) | 66±13 | 67±14 |
| IVSd | (mm) | 8.6±1.7 | 10.2±3.2* |
| PWd | (mm) | 8.7±1.4 | 9.2±2.2 |
| LVIDd | (mm) | 47.4±4.8 | 57.0±8.5* |
| LVIDs | (mm) | 30.8 ±5.3 | 43.3 ±12.7* |
| LVMi | (g/m2) | 78.5±22.3 | 116.7±39.7* |
| LV EDVi | (ml/ m2) | 56±13 | 79±29* |
| LV ESVi | (ml/ m2) | 21±7 | 44±26* |
| LV EF | (%) | 64±6 | 48±14* |
| LAESVi | (ml/ m2) | 33±8 | 43±16* |
| E wave | (m/s) | 72±15 | 72±19 |
| DTE | (ms) | 185±38 | 203±54 |
| A wave | (m/s) | 46±13 | 60±28* |
| E/A | 1.7±0.5 | 1.5±1.0 | |
| LV s’ | (cm/s) | 10±2 | 7±3* |
| LV e’ | (cm/s) | 13±3 | 8±4* |
| LV a’ | (cm/s) | 10±3 | 7±3* |
| E/e’ | 6±1 | 11±6* | |
| TAPSE | (mm) | 23±3 | 16±3* |
Average PSS and PMS in the two study groups for each LSC type
| LSC | Control group (n=100) | Ischemic group (n=50) | ||
|---|---|---|---|---|
| PSS | PMS | PSS | PMS | |
| Type 1 | -22.4±4.0* | -22.6±4.0* | -19.0±5.8 | -19.2±5.8 |
| Type 2 | -20.2±4.2* | -21.8±4.4* | -12.2±6.0 | -14.9±5.8 |
| Type 3 | - | - | -12.3±2.4 | -12.4±2.3 |
| Type 4 | -21.7±1.7* | -23.8±1.3* | -9.4±4.8 | -13.9±5.3 |
| Type 5 | - | - | -8.1±2.1 | -9.1±1.9 |
| Type 6 | - | - | -2.9±1.5 | -3.8±1.5 |
| Type 7 | - | - | -2.3±1.1 | -3.0±1.2 |