
Figure 1
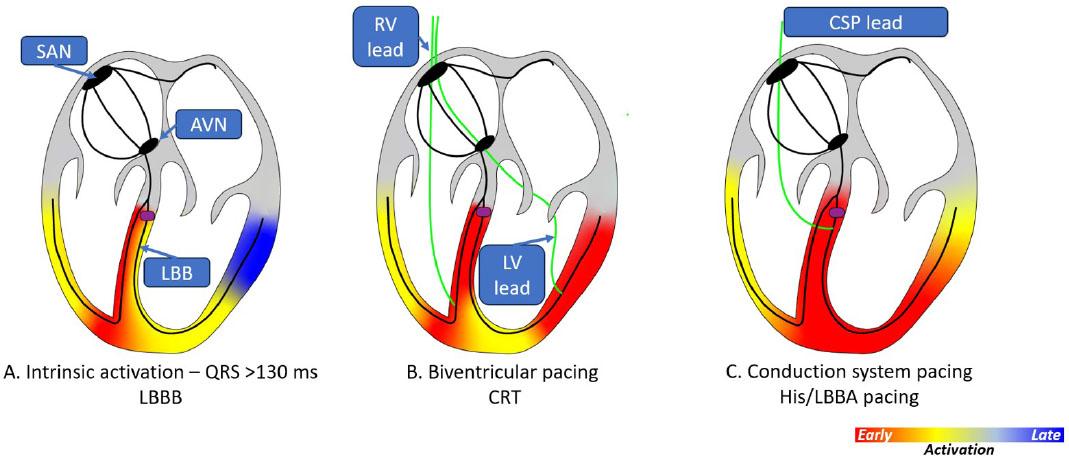
Figure 2
Cardiac electrical dyssynchrony types and functional consequences_ Wide QRS, QRS duration > 120 ms; LV, left ventricle; LBBB, left bundle branch block
| Type of dyssynchrony | Underlying electrical disease | Functional consequence |
|---|---|---|
| Atrioventricular | Prolonged PR/AV block | Diastolic impairment |
| Inter-ventricular | Wide QRS | Systolic impairment |
| Intra-ventricular LV | Wide QRS (LBBB) | Systolic and diastolic impairment Mitral regurgitation |
Mechanical intra-left ventricular dyssynchrony evaluation by cardiac echography_[10–16] Ts, time-to-peak systolic velocity; SD, standard deviation; LV, left ventricular; 2D, two dimensional; 3D, three dimensional
| Echography parameter | Method | Cut-off values |
|---|---|---|
| Septal to posterior wall motion delay[11] | M-mode | ≥ 130 ms |
| Septal flash[12] | M-mode | Nonquantifiable1 |
| Apical rocking[12] | 2D apical 4 chambers | Nonquantifiable2 |
| Basal septal to lateral Ts delay[13] | Tissue Doppler imaging | ≥ 60 ms |
| Maximum delay in Ts in 4 basal LV segments[14] | Tissue Doppler imaging | > 65 ms |
| SD of Ts of 6 basal LV segments[15] | Tissue Doppler imaging | ≥ 34.4 ms |
| Antero-septal to posterior time to peak strain difference (radial strain[16] | 2D speckle tracking | ≥ 130 ms |
| SD of time to minimum systolic volume of 16 LV segments (systolic dyssynchrony index)[16] | 3D echocardiography | > 5.6% |