
Table 1
Previous investigations and medical history. GI – gastrointestinal; TTE – transthoracic echocardiography; LVEF – left ventricular ejection fraction; ESR – erythrocyte sedimentation rate; hs-CRP – high-sensitivity C-reactive protein; UNL – upper normal limit; ANA – antinuclear antibodies; dsDNA – double strand DNA antibody; CCP – cyclic citrullinated peptide antibodies; cANCA – diffuse staining antineutrophil cytoplasmic antibodies; pANCA – perinuclear staining antineutrophil antibodies; ADA- adenosine deaminase; LDH – lactate dehydrogenase; ACR – albumin creatinine ratio
| March 2020 | Ascites | Paracentesis with fluid analysis: transudate Upper and lower GI endoscopy: no abnormal findings Whole-body CT: mild pericardial effusion, small mediastinal nodules, non-specific small pulmonary nodules ECG: low voltage, otherwise normal TTE: LVEF 60%, grade I diastolic dysfunction, mild pericardial effusion, no significant valve disease |
| October 2020 | Right pleural effusion Ascites | ESR: 83 mm/h; hs-CRP: 52 ng/ml IgG: 2402 mg/dl (UNL <1600 mg/dl); serum immunofixation (negative) |
| April 2021 | Bilateral pleural effusion Ascites Arthralgia | ESR: 88 mm/h: hs-CRP: 45 ng/ml IgG: 2650 mg/dl (UNL <1600 mg/dl); serum immunofixation (negative) Rheumatoid factor, ANA, dsDNA, CCP, cANCA, pANCA antibodies (negative) Bone marrow biopsy: 15% lymphocites, 3% plasmocytes, otherwise normal |
| May 2021 | Bilateral pleural effusion | QuantiFERON test: negative Pleural tap: exudate, ADA <39 U/L, glucose 111 mg/dl, LDH 81 U/L Pleural biopsy: no particular aspect |
| March 2022 | Lower limb edema | 24 h proteinuria: 355 mg ACR 90 mg/g |
| November 2022 | NYHA class III | Referral to our clinic |
Table 2
TTE diastolic function assessment. Notice that the E/E’ is abnormally low (annulus paradoxus) and that septal TDI velocities have higher values than the ones sampled from the lateral wall (“annulus reversus”)
| E | A | E/A | Septal E’ | Lateral E’ | E/E’ (avg) | Septal S’ | Lateral S’ |
|---|---|---|---|---|---|---|---|
| 70 | 55 | 1.3 | 12.9 | 9.9 | 6.14 | 8 | 6 |
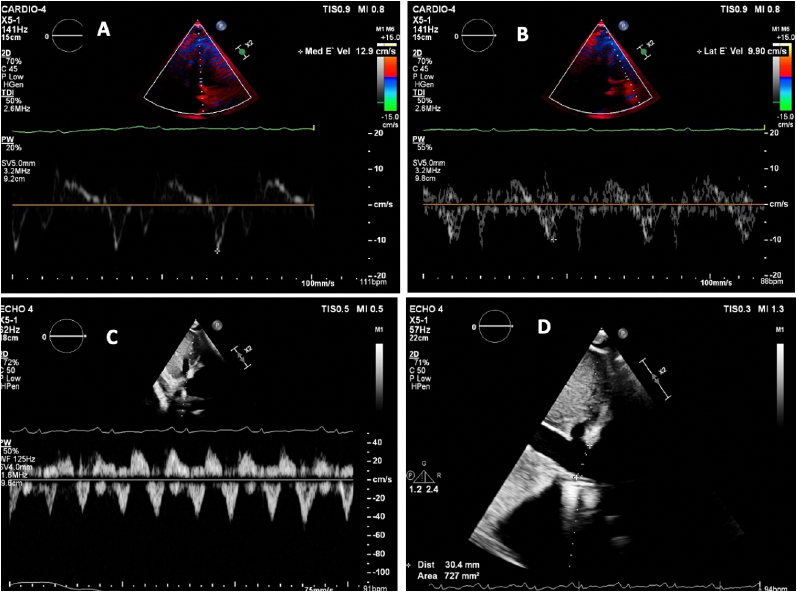
Figure 1
Echocardiographic red flags. A, B: “Annulus paradoxus” with medial annular E’ (12.9 cm/s) higher than lateral annular E’ (9.9 cm/s); C: Hepatic vein PW Doppler profile with diastolic flow reversal; D: Dilated inferior vena cava (30 mm) with no respiratory variations
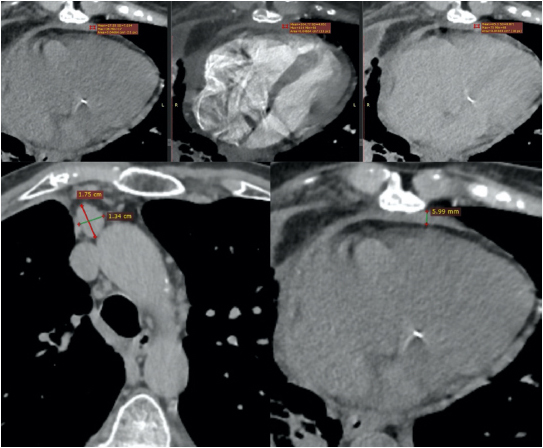
Figure 2
CT findings. Notice the thickened pericardium and lymph node
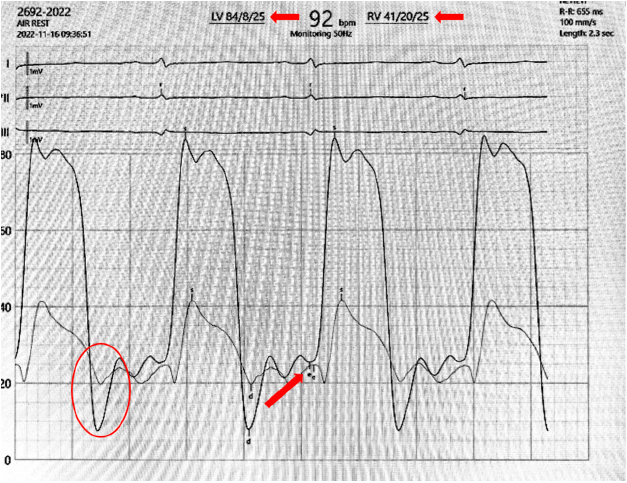
Figure 3
Cardiac catheterization. Notice the square root sign (oval) and ventricular interdependence (arrow)
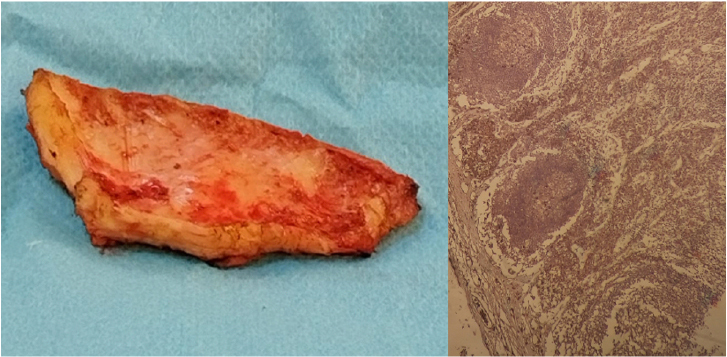
Figure 4
Removed pericardium and lymph node microscopy. Notice the frequent IgG producing plasma cells