
Figure 1
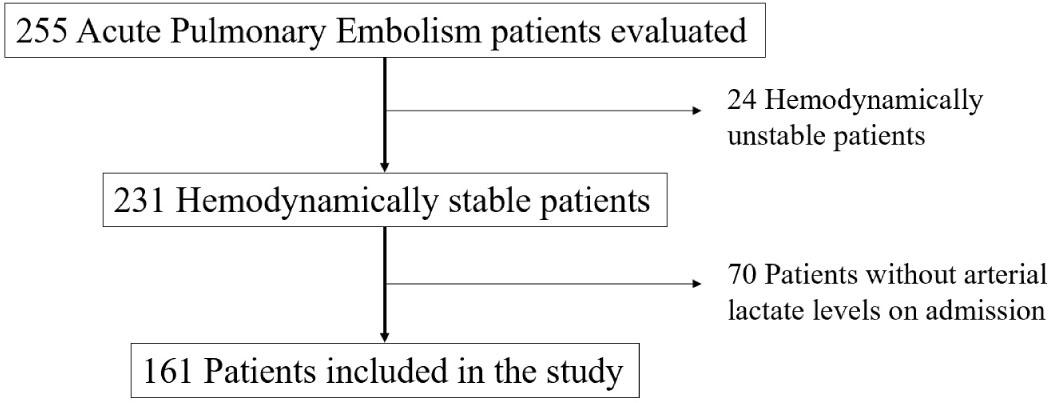
Figure 2
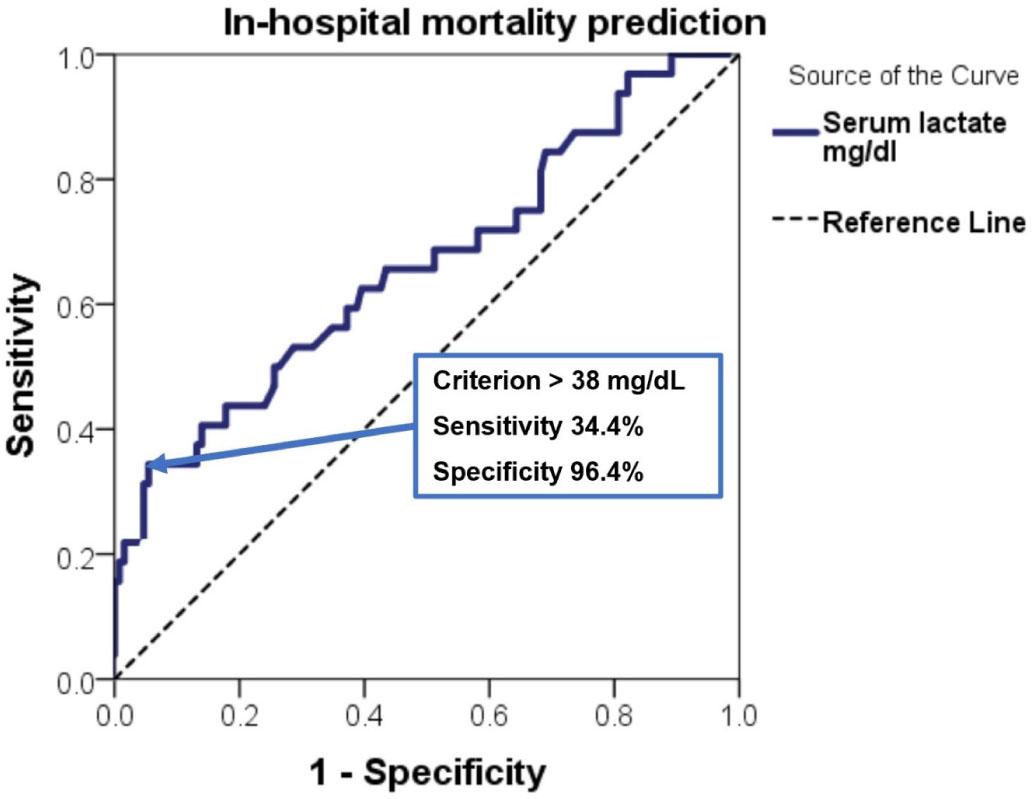
Figure 3
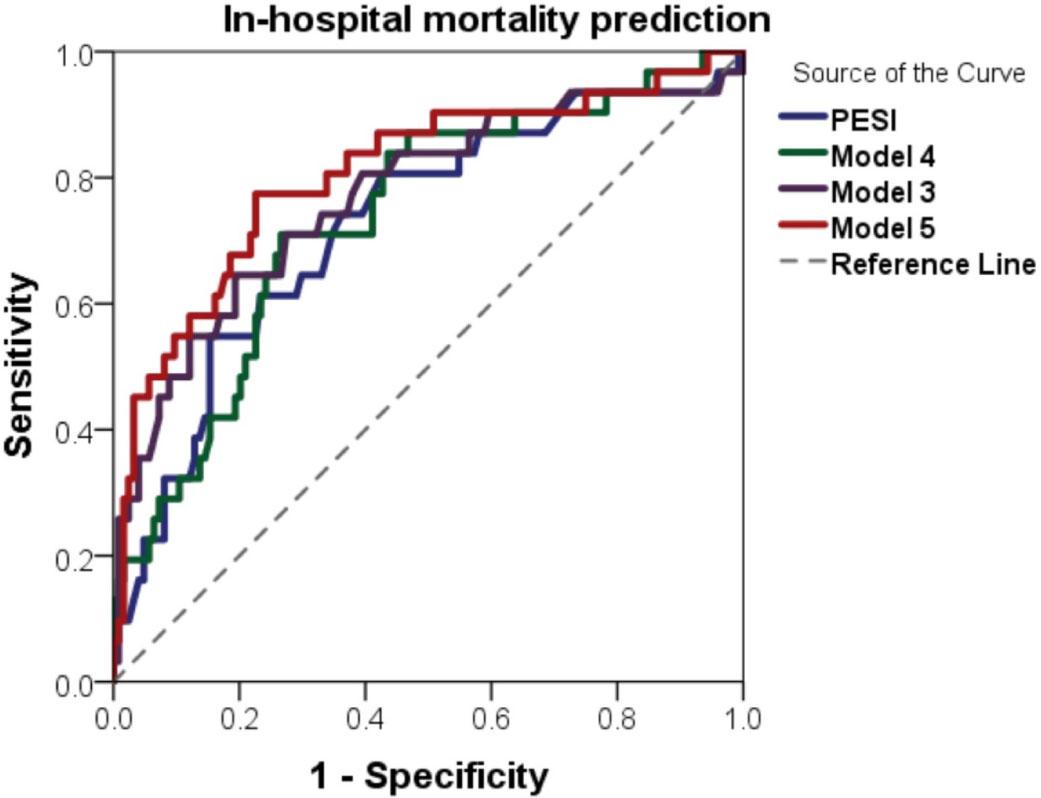
Predictive performance of the derived predictive models for inhospital mortality
| AUC | p value | |
|---|---|---|
| PESI score | 0.725 (0.621 – 0.829) | < 0.001 |
| Model 3 | 0.769 (0.666 – 0.872) | < 0.001 |
| Model 4 | 0.736 (0.638 – 0.835) | < 0.001 |
| Model 5 | 0.807 (0.711 – 0.902) | < 0.001 |
Predictors of elevated lactate levels > 38mg/dL
| p value | ||
|---|---|---|
| Demographics | ||
| Male sex | OR 1.01 (0.37 – 2.71) | 0.98 |
| Age | AUC 0.556 (0.415 – 0.697) | 0.44 |
| Clinical parameters | ||
| HR (bpm) | AUC 0.604 (0.445 – 0.754) | 0.16 |
| SBP (mmHg) | AUC 0.498 (0.336 – 0.660) | 0.97 |
| DBP (mmHg) | AUC 0.504 (0.455 – 0.754) | 0.96 |
| PESI score | AUC 0.674 (0.538 – 0.810) | 0.016 |
| SatO2 < 90% | OR 3.79 (1.13 – 12.75) | 0.04 |
| DVT | OR 1.58 (0.50 – 4.96) | 0.61 |
| Syncope | OR 0.72 (0.15 – 3.39) | 0.95 |
| Laboratory parameters | ||
| Troponin I | AUC 0.529 (0.382 – 0.676) | 0.69 |
| NT-proBNP* | AUC 0.626 (0.447 – 0.805) | 0.22 |
| Hemoglobin | AUC 0.473 (0.311 – 0.635) | 0.71 |
| Creatinine | AUC 0.530 (0.398 – 0.663) | 0.67 |
| ECG | ||
| New RBBB | OR 1.29 (0.47 – 3.56) | 0.81 |
| ST elevation in precordial leads | OR 7.89 (1.89 – 32.79) | 0.006 |
| ST elevation in inferior leads | OR 2.97 (0.72 – 12.21) | 0.26 |
| Negative T waves in precordial leads | OR 1.11 (0.40 – 3.04) | 0.83 |
| Imaging parameters | ||
| RH thrombus | OR 3.42 (1.08 – 10.82) | 0.04 |
| RV dysfunction | OR 1.81 (0.55 – 5.92) | 0.49 |
| McConnel sign | OR 2.02 (0.37 – 10.89) | 0.74 |
| Central localization of thrombus | OR 2.28 (0.48 – 10.71) | 0.45 |
| Treatment | ||
| Positive inotropic treatment | OR 6.94 (2.35 – 20.56) | < 0.001 |
| Thrombolysis | OR 0.39 (0.11 – 1.34) | 0.25 |
Patients’ characteristics
| Entire study cohort | In-hospital mortality | Survival to discharge | p value | |
|---|---|---|---|---|
| General Characteristics | ||||
| Age (years) | 68.61 ± 11.54 | 69.96 ± 13.58 | 68.34 ± 11.04 | 0.47 |
| Sex (female), n (%) | 89 (54.94%) | 20 (62.50%) | 69 (53.49%) | 0.47 |
| Malignancy, n (%) | 37 (22.98%) | 10 (31.25%) | 27 (20.93%) | 0.31 |
| Clinical Parameters | ||||
| Dyspnea, n (%) | 146 (90.68%) | 31 (96.88%) | 115 (89.15%) | 0.31 |
| Chest pain, n (%) | 45 (27.95%) | 1 (3.13%) | 44 (34.11%) | 0.001 |
| HR (bpm) | 101.63 ± 19.60 | 106.54 ± 24.53 | 100.44 ± 18.14 | 0.12 |
| SBP(mmHg) | 134.98 ± 22.81 | 132.18 ± 23.67 | 135.67 ± 22.64 | 0.44 |
| O2 Sat (%) | 89.65 ± 8.74 | 87.77 ± 9.87 | 90.12 ±8.41 | 0.17 |
| PESI score | 105.62 ± 29.85 | 126.43 ± 35.69 | 100.46 ± 25.88 | < 0.001 |
| Laboratory Parameters | ||||
| Troponin I (ng/mL) | 1.17 [0.2 – 20.3] | 0.40 [0.20 – 2.33] | 0.29 [0.20 – 1.02] | 0.23 |
| NT-proBNP*(pg/dL) | 1830.5 [479 – 7288.5] | 6143 [1664.5 – 9465] | 1613 [387.5 – 6403.5] | 0.02 |
| Hemoglobin (g/dL) | 13.18 ± 2.68 | 12.71 ± 2.38 | 13.31 ± 2.75 | 0.25 |
| Creatinine (mg/dL) | 1.10 ± 0.58 | 1.02 [0.81 – 1.38] | 1.01 [0.80 – 1.19] | 0.50 |
| Lactate (mg/dL) | 20.76 (12 – 22.52) | 32.04 [13.48 – 41.37] | 17.96 [11.62 – 21] | 0.004 |
| Central localization of thrombus, n (%) | 104 (73.76%) | 19 (76.00%) | 85 (73.28%) | 0.97 |
| S1Q3T3, n (%) | 59 (37.34%) | 14 (23.73%) | 45 (76.27%) | 0.52 |
| Right ventricular dysfunction**, n (%) | 36 (41.38%) | 7 (58.33%) | 29 (38.67%) | 0.33 |
| RH thrombus, n (%) | 29 (20.42%) | 9 (31.03%) | 20 (17.70%) | 0.18 |
| TAPSE (mm) | 17.96 ±4.39 | 16 ± 2.99 | 18.18 ± 4.55 | 0.24 |
| DVT, n (%) | 63 (43.45%) | 11 (17.46%) | 52 (82.54%) | 0.77 |
| Treatment | ||||
| Thrombolysis, n (%) | 18 (11.39%) | 5 (15.63%) | 13 (10.32%) | 0.59 |
| Inotropic therapy, n (%) | 24 (15.19%) | 15 (48.39%) | 9 (7.09%) | < 0.001 |
| Outcomes | ||||
| In hospital mortality, n (%) | 32 (19.88%) | N/A | N/A | N/A |
| Hospitalization period (days) | 10.50 [7 – 52] | 9.61 [1 – 51] | 10.65 [8 – 52] | 0.005 |
Multivariable analysis for in-hospital mortality
| HR (95%CI) | p value | |
|---|---|---|
| Model 1 | ||
| PESI score | 1.03 (1.01 – 1.04) | 0.001 |
| Lactate level | 1.05 (1.02 – 1.08) | 0.003 |
| Model 2 | ||
| PESI score | 1.03 (1.01 – 1.04) | 0.001 |
| Lactate level > 18 mg/dL | 2.09 (0.89 – 4.88) | 0.088 |
| Model 3 | ||
| PESI score | 1.03 (1.01 – 1.04) | < 0.001 |
| Lactate level > 38 mg/dL | 7.49 (2.41 – 23.25) | < 0.001 |
| Model 4 | ||
| PESI score | 1.03 (1.01 – 1.04) | < 0.001 |
| RV dysfunction | 1.73 (0.61 – 5.05) | 0.302 |
| Troponin I | 1.03 (0.87 – 1.21) | 0.176 |
| Model 5 | ||
| PESI score | 1.03 (1.01 – 1.04) | 0.002 |
| RV dysfunction | 3.14 (0.90 – 11.02) | 0.07 |
| Troponin I | 1.05 (0.88 – 1.24) | 0.609 |
| Lactate level > 38 mg/dL | 10.92 (3.04 – 39.29) | < 0.001 |