
Figure 1
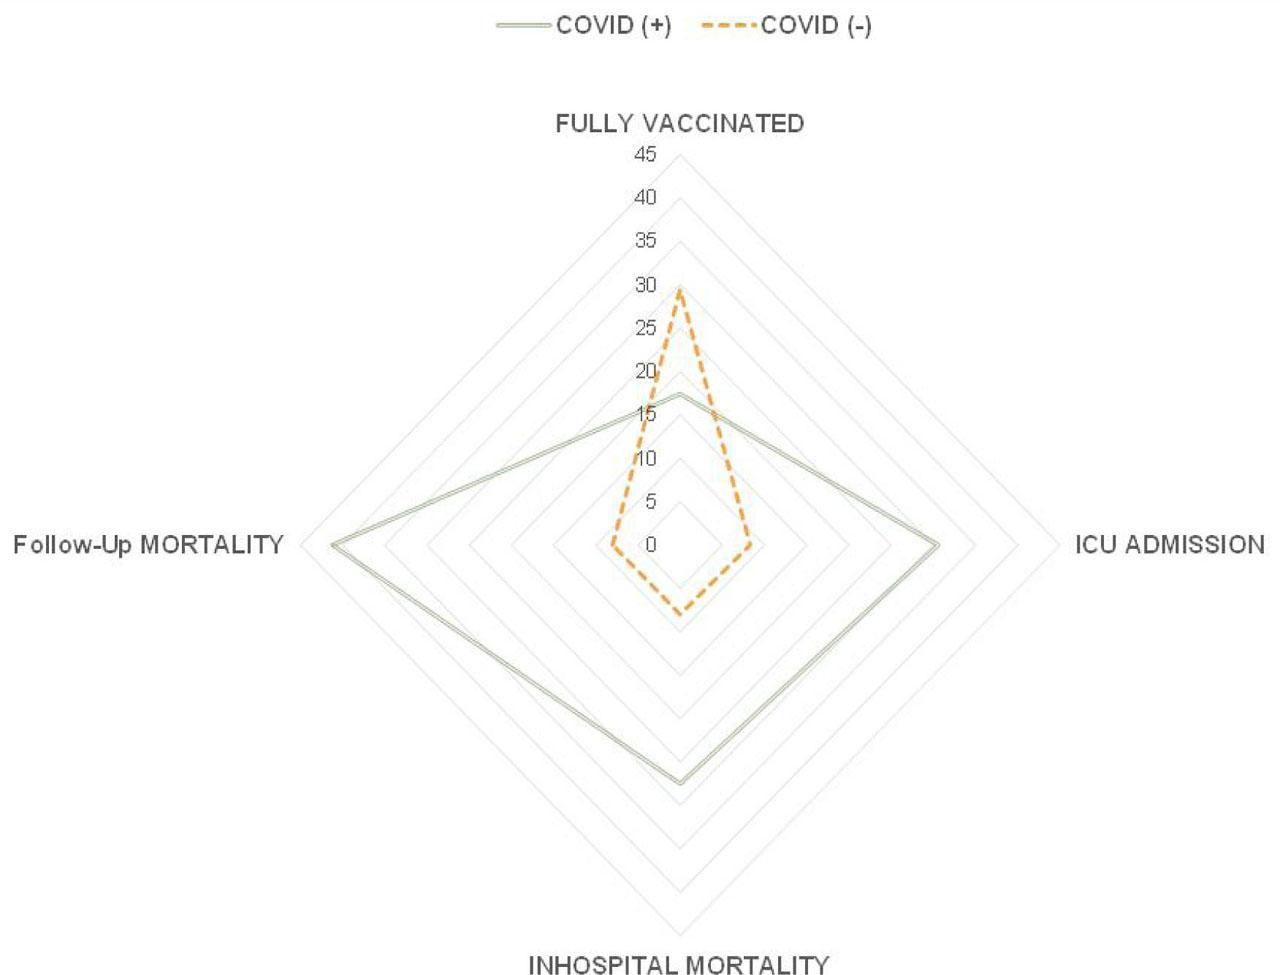
Figure 2
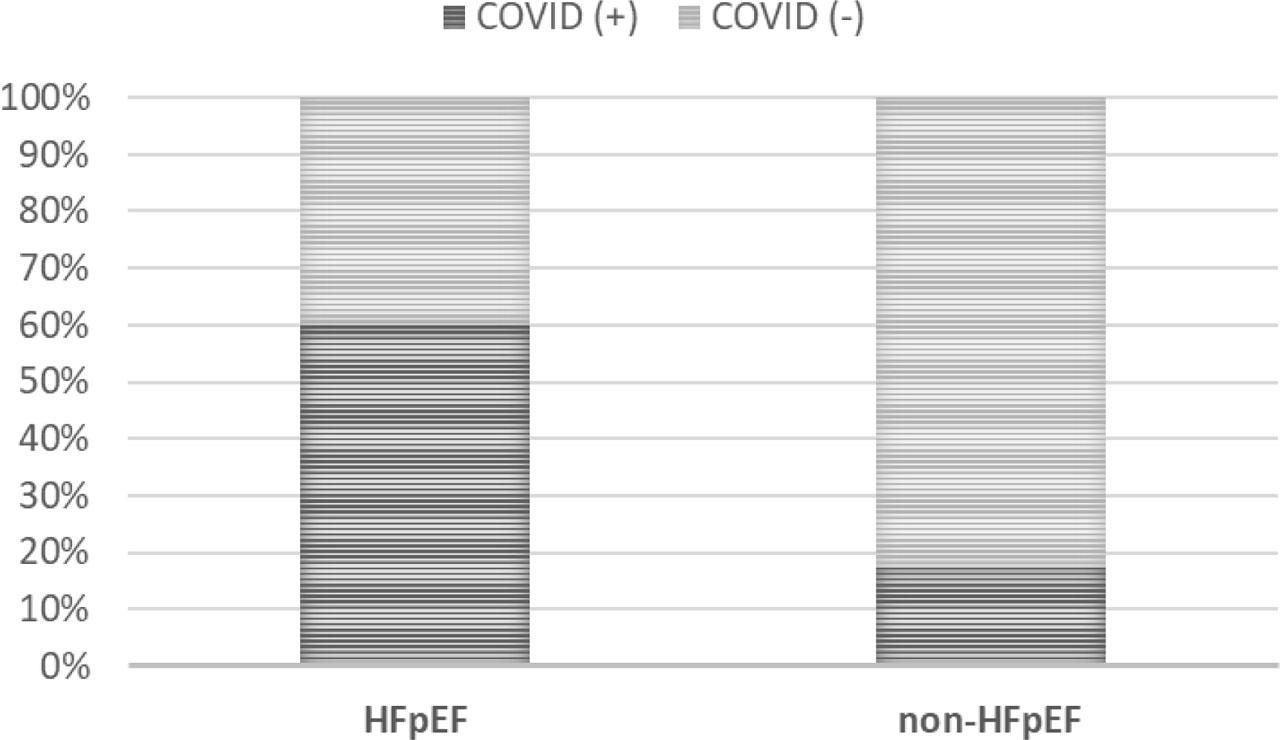
Figure 3
Laboratory assay values (at admission) reported for COVID-19 positive patients compared to COVID-19 negative patientsa,b
| Laboratory test | References | COVID (+) | COVID (−) | p-value |
|---|---|---|---|---|
| WBC (×103/μl) | 4–11 | 9.38 | 7.70 | 0.098 |
| HGB (g/dl) | 12.0–15.0 | 12.8 | 12.3 | 0.639 |
| PLT (×103/μl) | 150–400 | 243 | 231 | 0.866 |
| Neutrophils (×103/μl) | 2.2–5 | 7.17 | 5.87 | 0.052 |
| Lymphocytes (×103/μl) | 1.3–3.0 | 1.13 | 1.10 | 0.842 |
| Glucose (mg/dl) | 74–106 | 125 | 120 | 0.261 |
| Urea (mg/dl) | 15–36 | 57.6 | 53.5 | 0.577 |
| Creatinine (mg/dl) | 0.6–1.2 | 1.09 | 1.05 | 0.218 |
| eGFR (ml/min/1.73m2) | > 60 | 60.9 | 62.2 | 0.446 |
| Uric acid (mg/dl) | 3.1–7.8 | 5.45 | 7.8 | 0.120 |
| Na (mmol/l) | 137–145 | 139.6 | 138.5 | 0.882 |
| K (mmol/l) | 3.6–5 | 4.12 | 4.55 | 0.195 |
| AST (U/L) | 14–36 | 34 | 28 | 0.288 |
| ALT (U/L) | 10–49 | 30 | 21 | 0.349 |
| TBIL (mg/dL) | 0.2–1.3 | 0.86 | 0.69 | 0.884 |
| DBIL (mg/dL) | 0.0–0.4 | 0.4 | 0.4 | 0.504 |
| GGT (U/L) | 12–43 | 55.9 | 50.4 | 0.409 |
| LDH (U/L) | 120–246 | 293 | 183 | 0.017 |
| Total protein (g/dL) | 6.3–8.2 | 6.3 | 6.6 | 0.881 |
| Albumin (g/dL) | 3.5–5 | 3.3 | 3.9 | 0.397 |
| Serum iron (μg/dL) | 37–170 | 42.5 | 40.3 | 0.924 |
| Ferritin (ng/mL) | 24–260 | 765 | 178 | 0.179 |
| Cholesterol (mg/dL) | 130–239 | 117 | 120 | 0.664 |
| LDL-cholesterol (mg/dL) | 50–150 | 75 | 75 | 0.803 |
| Triglycerids (mg/dL) | 70–175 | 98.5 | 79 | 0.119 |
| HDL-cholesterol (mg/dL) | 35–95 | 32 | 39 | 0.115 |
| HbA1c (%) | 4.5–6.0 | 6.7 | 6.7 | 0.785 |
| CK (U/L) | 30–135 | 53 | 49 | 0.176 |
| CKMB (U/L) | 0.2–16 | 7 | 9 | 0.623 |
| Troponin (ng/mL) | 0–0.12 | 0.03 | 0.04 | 0.522 |
| NTproBNP | 0–300 | 2660 | 3350 | 0.572 |
| ESR (mm/1h) | 0–30 | 35 | 34.5 | 0.821 |
| Fibrinogen (mg/dL) | 150–400 | 578 | 451 | 0.473 |
| C reactive protein (mg/dL) | 0–0.32 | 4.03 | 0.91 | 0.003 |
| APTT (s) | 24–36 | 30.3 | 30.8 | 0.806 |
| D-dimer (ug/mL FEU) | 0–0.50 | 1.19 [0.3–20] | 2.35 [0.4–5] | 0.430 |
Differences in heart failure treatment in COVID-19 positive and negative patients on admission and at discharge
| On admission | p-value | At discharge | p-value | |||
|---|---|---|---|---|---|---|
| COVID (+) | COVID (−) | COVID (+) | COVID (−) | |||
| ACEi/ARNi (%) | 19.6 | 44.0 | 0.026 | 21.6 | 34.8 | 0.205 |
| BB (%) | 35.3 | 60.0 | 0.036 | 56.8 | 73.9 | 0.143 |
| MRA (%) | 7.8 | 24.0 | 0.058 | 10.8 | 39.1 | 0.012 |
| Loop diuretic (%) | 11.8 | 36.0 | 0.016 | 10.8 | 60.9 | <0.001 |
| SGLT2-i (%) | 5.9 | 4.0 | 0.601 | 5.9 | 12.0 | 0.306 |
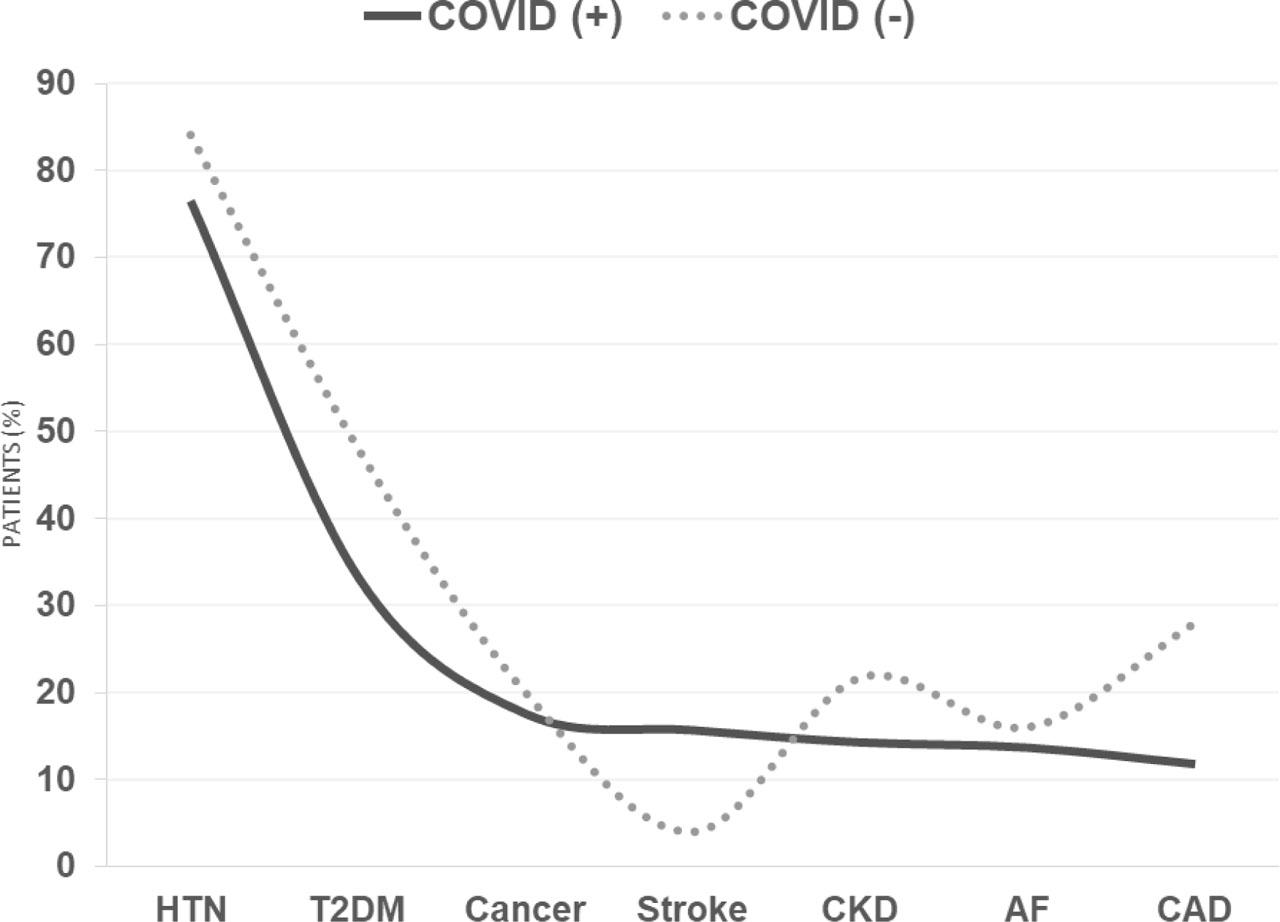
Study population divided by COVID-19 status displaying heart failure phenotype distribution, prevalence of associated conditions and outcome during hospitalization and at follow-up
| Heart Failure Phenotype | COVID (+) | COVID (−) | p-value |
|---|---|---|---|
| Gender - % of women | 58.8 | 60.0 | 0.562 |
| Arterial Hypertension (%) | 76.5 | 84.0 | 0.330 |
| HTN - grade 3 (%) | 40.5 | 55.0 | 0.221 |
| Type 2 Diabetes Mellitus (%) | 33.3 | 48.0 | 0.162 |
| Atrial Fibrillation (%) | 13.7 | 16.0 | 0.521 |
| Coronary Artery Disease (%) | 11.8 | 28.0 | 0.077 |
| Chronic Kidney Disease (% of G2 or lower eGRF) | 71.4 | 91.3 | 0.510 |
| Late-stage CKD (% of G4 or lower eGRF) | 14.3 | 21.7 | 0.318 |
| Stroke History (%) | 15.7 | 4.0 | 0.133 |
| Cancer (%) | 17.6 | 20.0 | 0.517 |
| Fully vaccinated (%) | 17.4 | 29.4 | 0.239 |
| ICU admission (%) | 30.6 | 8.3 | 0.030 |
| In-hospital mortality (%) | 27.5 | 8.0 | 0.044 |
| Follow-up mortality (%) | 41.2 | 8.0 | 0.002 |
| HFpEF (%) | 90.2 | 60.0 | 0.003 |
| Non-HFpEF (%) | 5.9 | 28.0 | 0.012 |
| NYHA Class III&IV | 13.7 | 56.0 | <0.001 |