
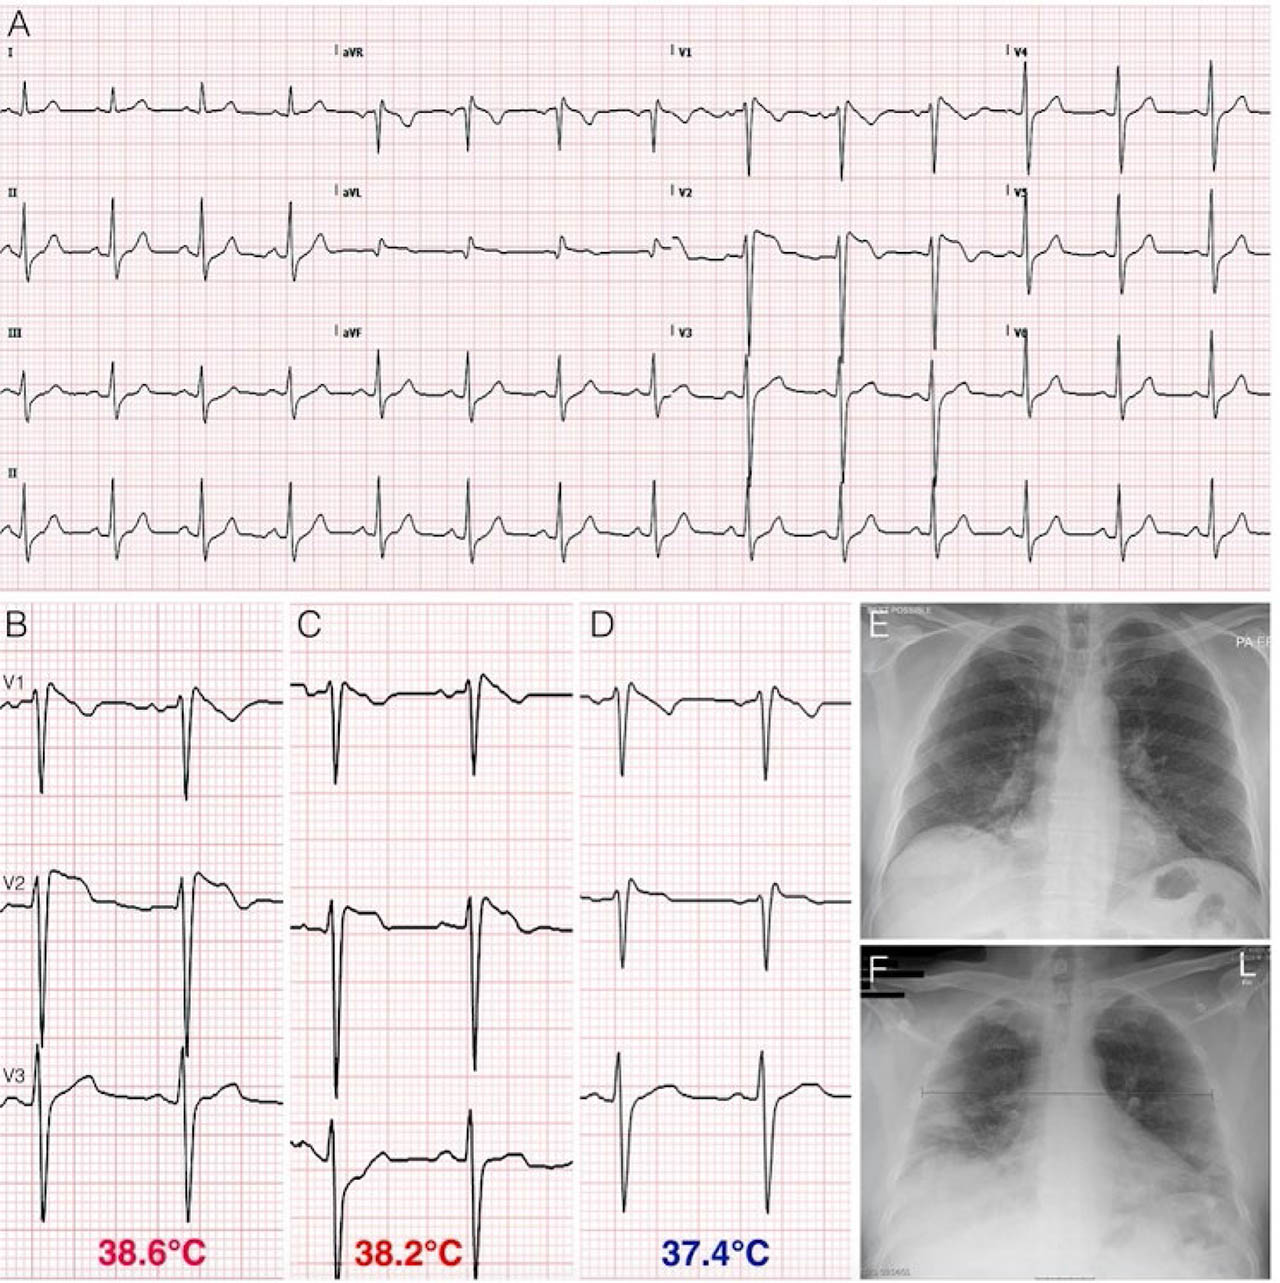
Figure 1
Legend - (Figures A, B) An electrocardiogram (ECG) conducted during fever showed a coved, downward complex morphology, ST-elevation >0.2mV, incomplete Right Bundle Branch Block (RBBB), and negative T-waves in leads V1–V3, consistent with Type-1 Brugada pattern.
(Figure C) Two hours later, with lower grade fever, a repeat ECG showed persistent broad r’-wave with 0.2mV height and saddleback morphology with 0.1mV ST-elevation in V1–V2, compatible with non-Type-1 Brugada pattern.
(Figure D) ECG changes when apyrexial.
(Figures E, F) Chest radiography revealed bilateral lower zone pulmonary infiltrates, worsening on subsequent radiography, consistent with COVID-19 pneumonia.