
Figure 1
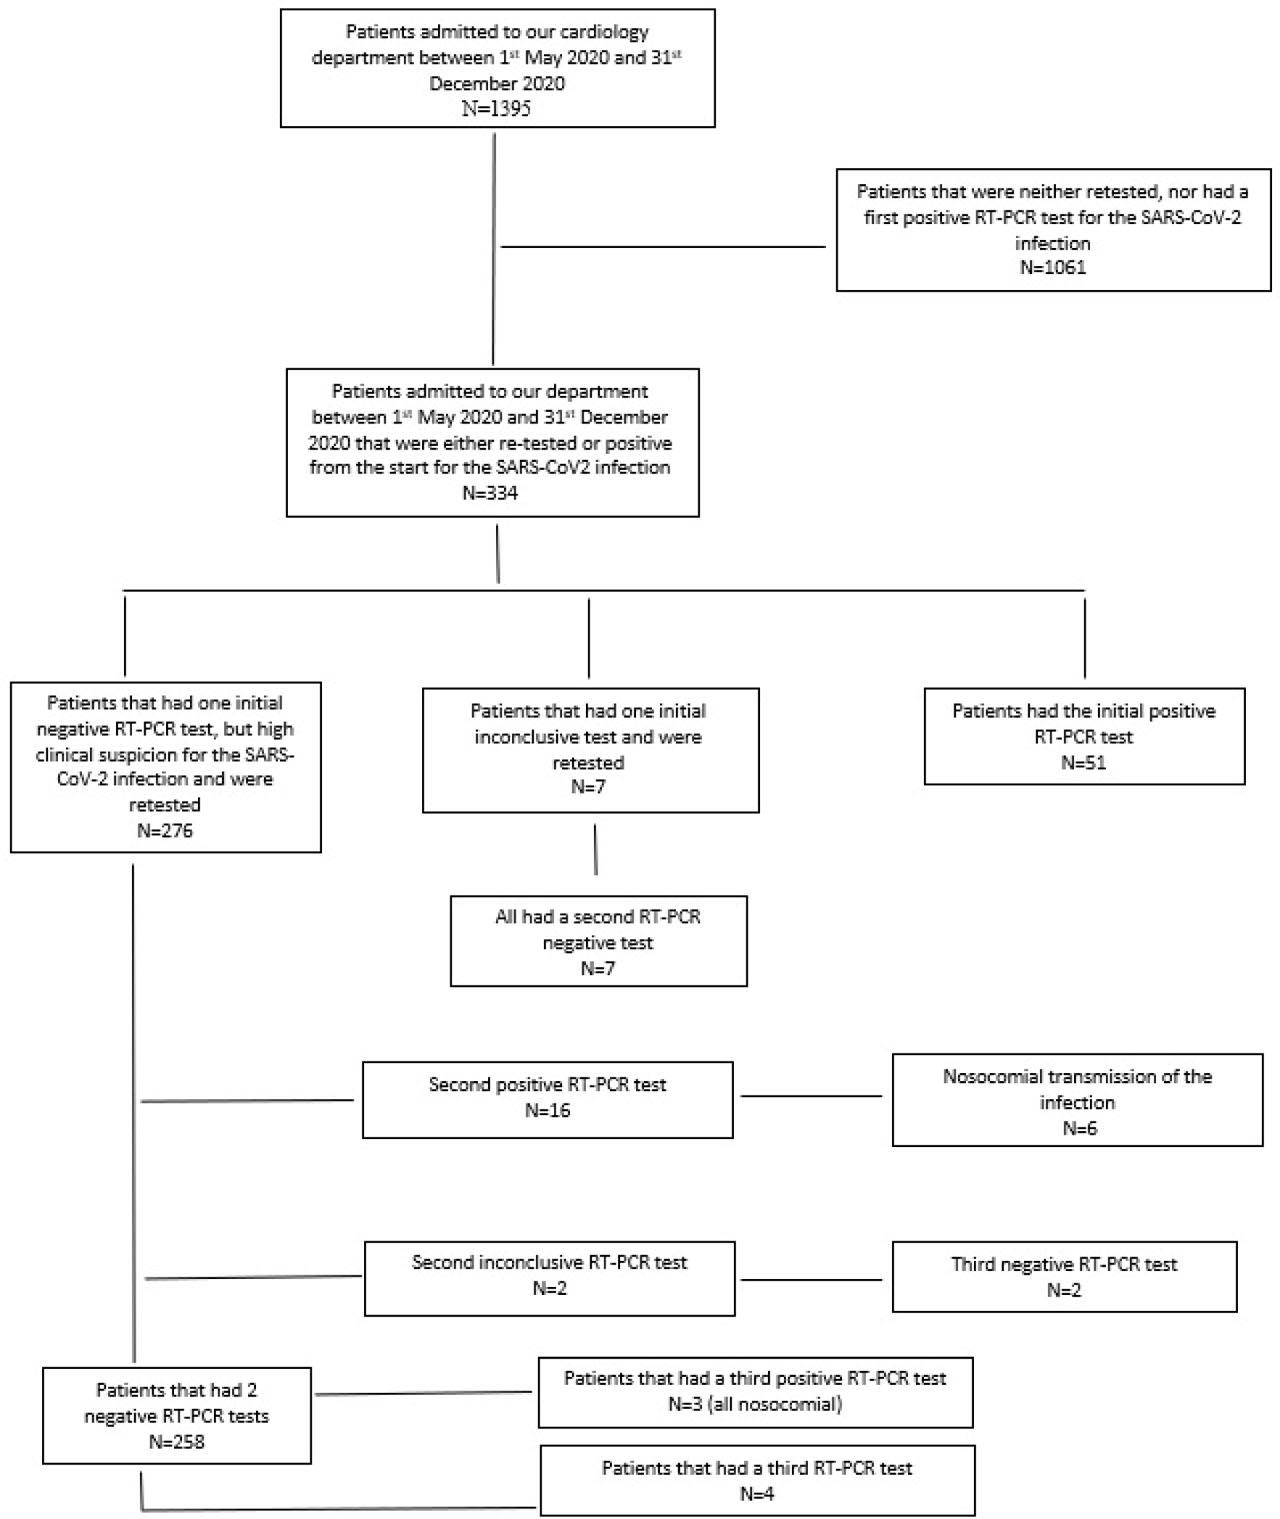
Figure 2
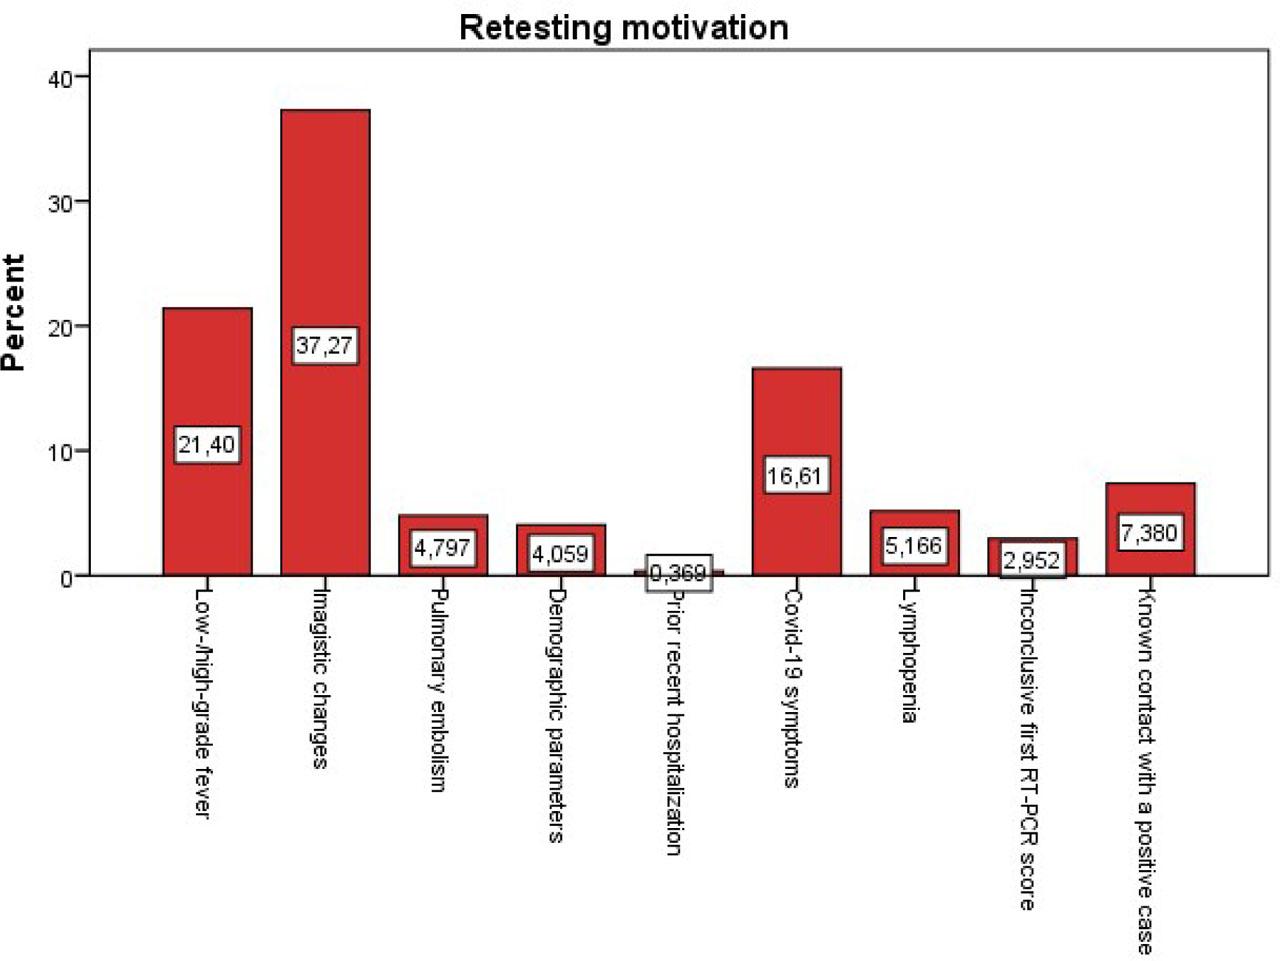
Figure 3
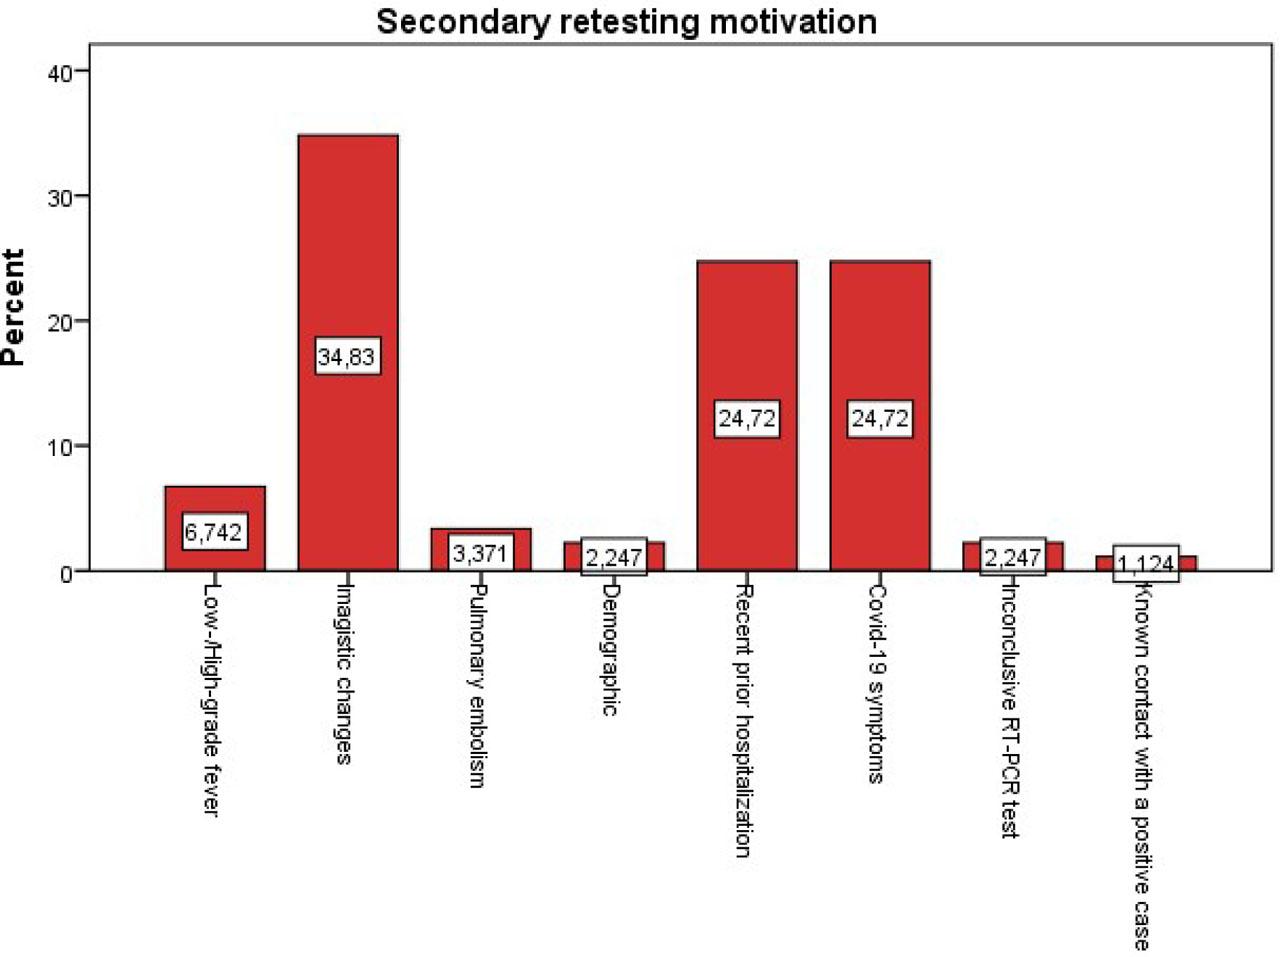
Figure 4
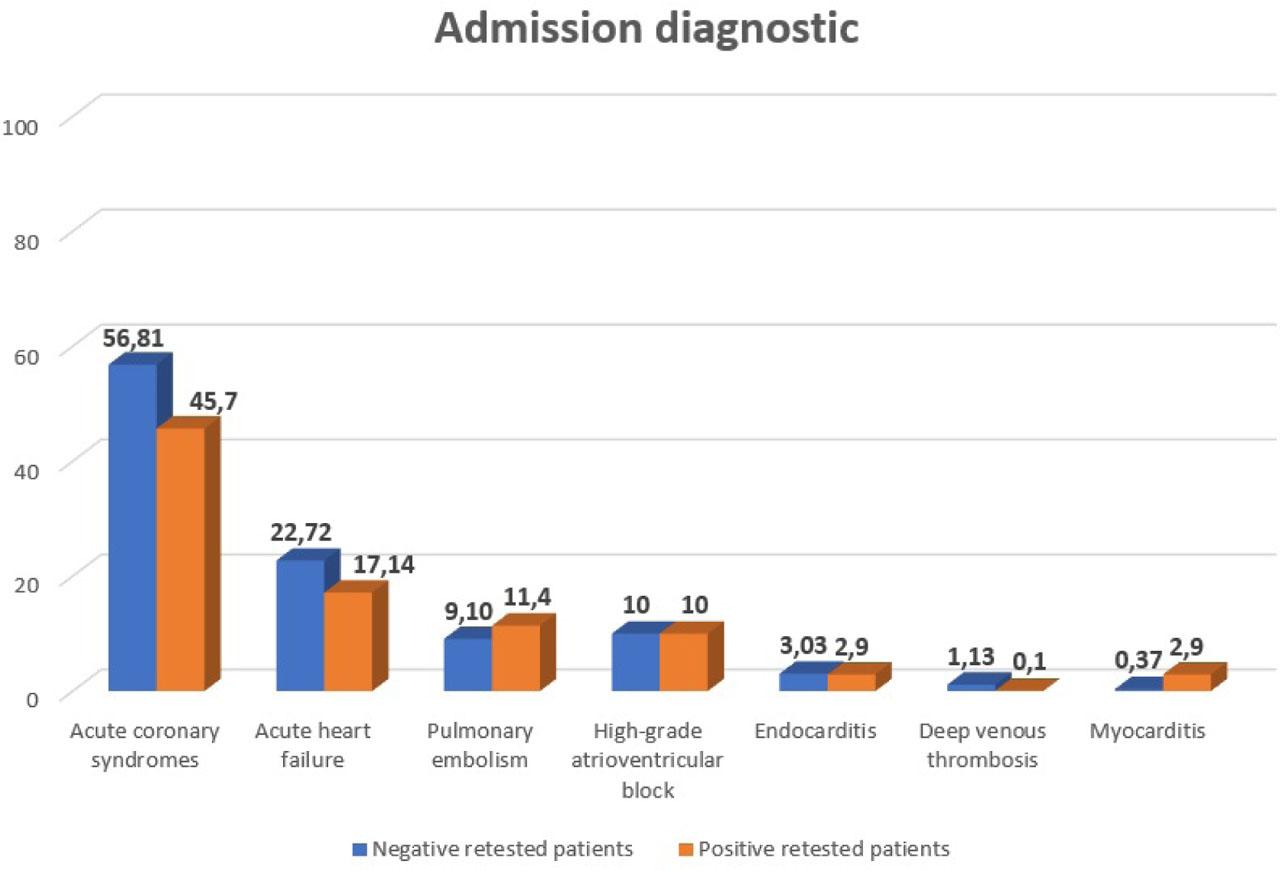
Figure 5
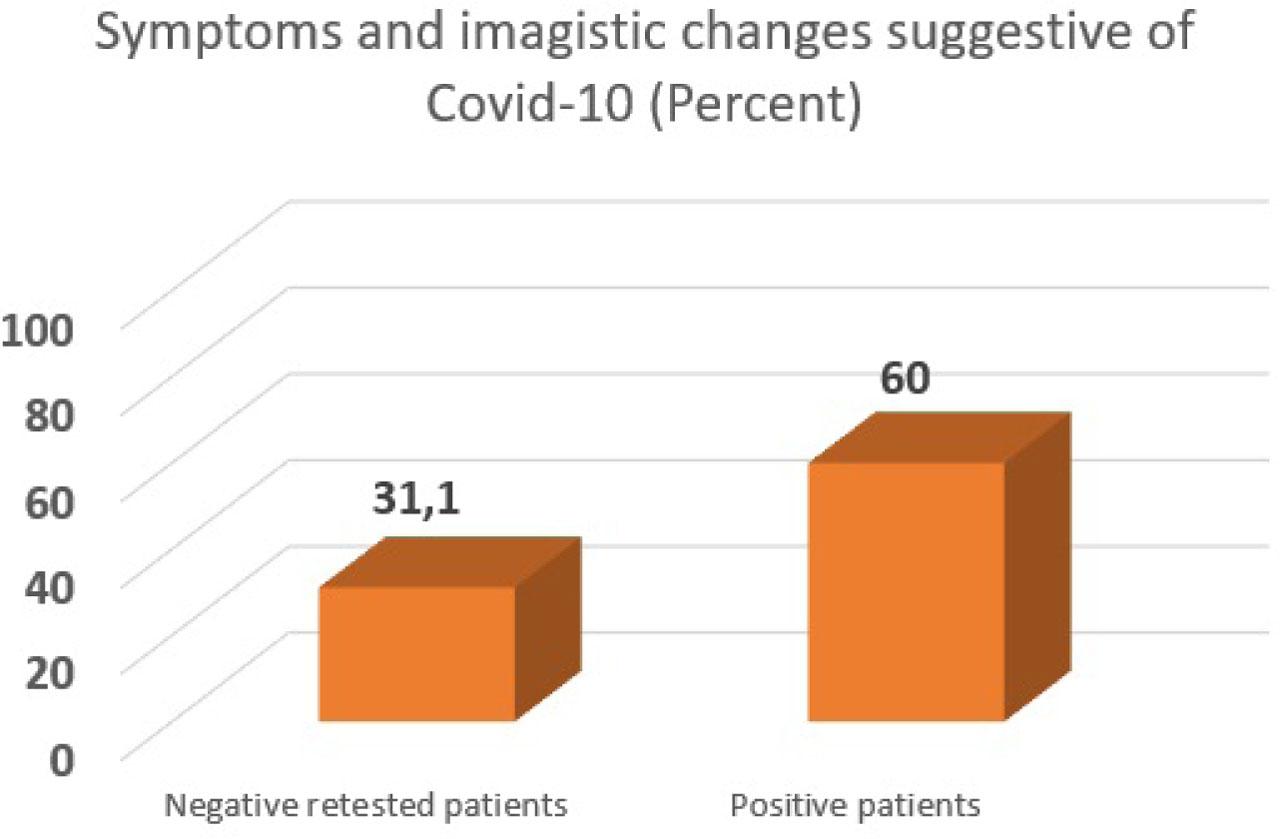
Figure 6
Comparison between biological parameters in negative retested patients and positive patients_
| Parameter | Negative patients (mean ± standard deviation) | Positive patients (mean ± standard deviation) | P value |
|---|---|---|---|
| Admission hemoglobin level(g/dl) | 13.62 ± 9.16 | 12.66 ± 2.35 | 0.4 |
| Leukocytes at admission (×103/μl) | 11.10 ± 4.53 | 10.54 ± 7.05 | 0.43 |
| Neutrophils at admission (percent) (%) | 73.73 ± 12.08 | 73.34 ± 11.16 | 0.81 |
| Neutrophils at admission (absolute value) (×103/μl) | 8.71 ± 5.94 | 7.25 ± 2.97 | 0.055 |
| Lymphocyte at admission (percent) (%) | 15.81 ± 8.62 | 16.36 ± 8.78 | 0.57 |
| Lymphocyte at admission (absolute value) (×103/μl) | 1.58 ± 0.88 | 1.5 ± 0.82 | 0.54 |
| Monocyte at admission (percent) (%) | 9.07 ± 8.12 | 8.7 ± 3.62 | 0.711 |
| Monocyte at admission (absolute value) (×103/μl) | 0.93 ± 0.65 | 0.91 ± 0.77 | 0.77 |
| Leukocytes at 48h (×103/μl) | 9.59 ± 3.42 | 9.65 ± 3.43 | 0.92 |
| Neutrophils at 48h (percent) (%) | 69.64 ± 10.17 | 71.48 ± 11.89 | 0.29 |
| Neutrophils at 48h (absolute value) (×103/μl) | 7.12 ± 5.17 | 7.13 ± 3.03 | 0.99 |
| Lymphocyte at 48h (percent) (%) | 18.22 ± 8.07 | 19.08 ± 12.97 | 0.57 |
| Lymphocyte at 48h (absolute value) (×103/μl) | 2.11 ± 3.59 | 1.59 ± 1.03 | 0.34 |
| Monocyte at 48h (percent) (%) | 9.62 ± 3.02 | 8.66 ± 3.26 | 0.06 |
| Monocyte at 48h (absolute value) (×103/μl) | 0.97 ± 0.91 | 0.84 ± 0.43 | 0.34 |
| Highest Erythrocyte sedimentation rate (ESR) (mm/h) | 31.07 ± 23.86 | 38.5 ± 23.74 | 0.042 |
| Highest C-reactive protein (CRP) (mg/dl) | 8.12 ± 9.24 | 12.21 ± 14.35 | 0.008 |
| Highest Fibrinogen (mg/dl) | 435.44 ± 160.71 | 448.44 ± 154.27 | 0.55 |
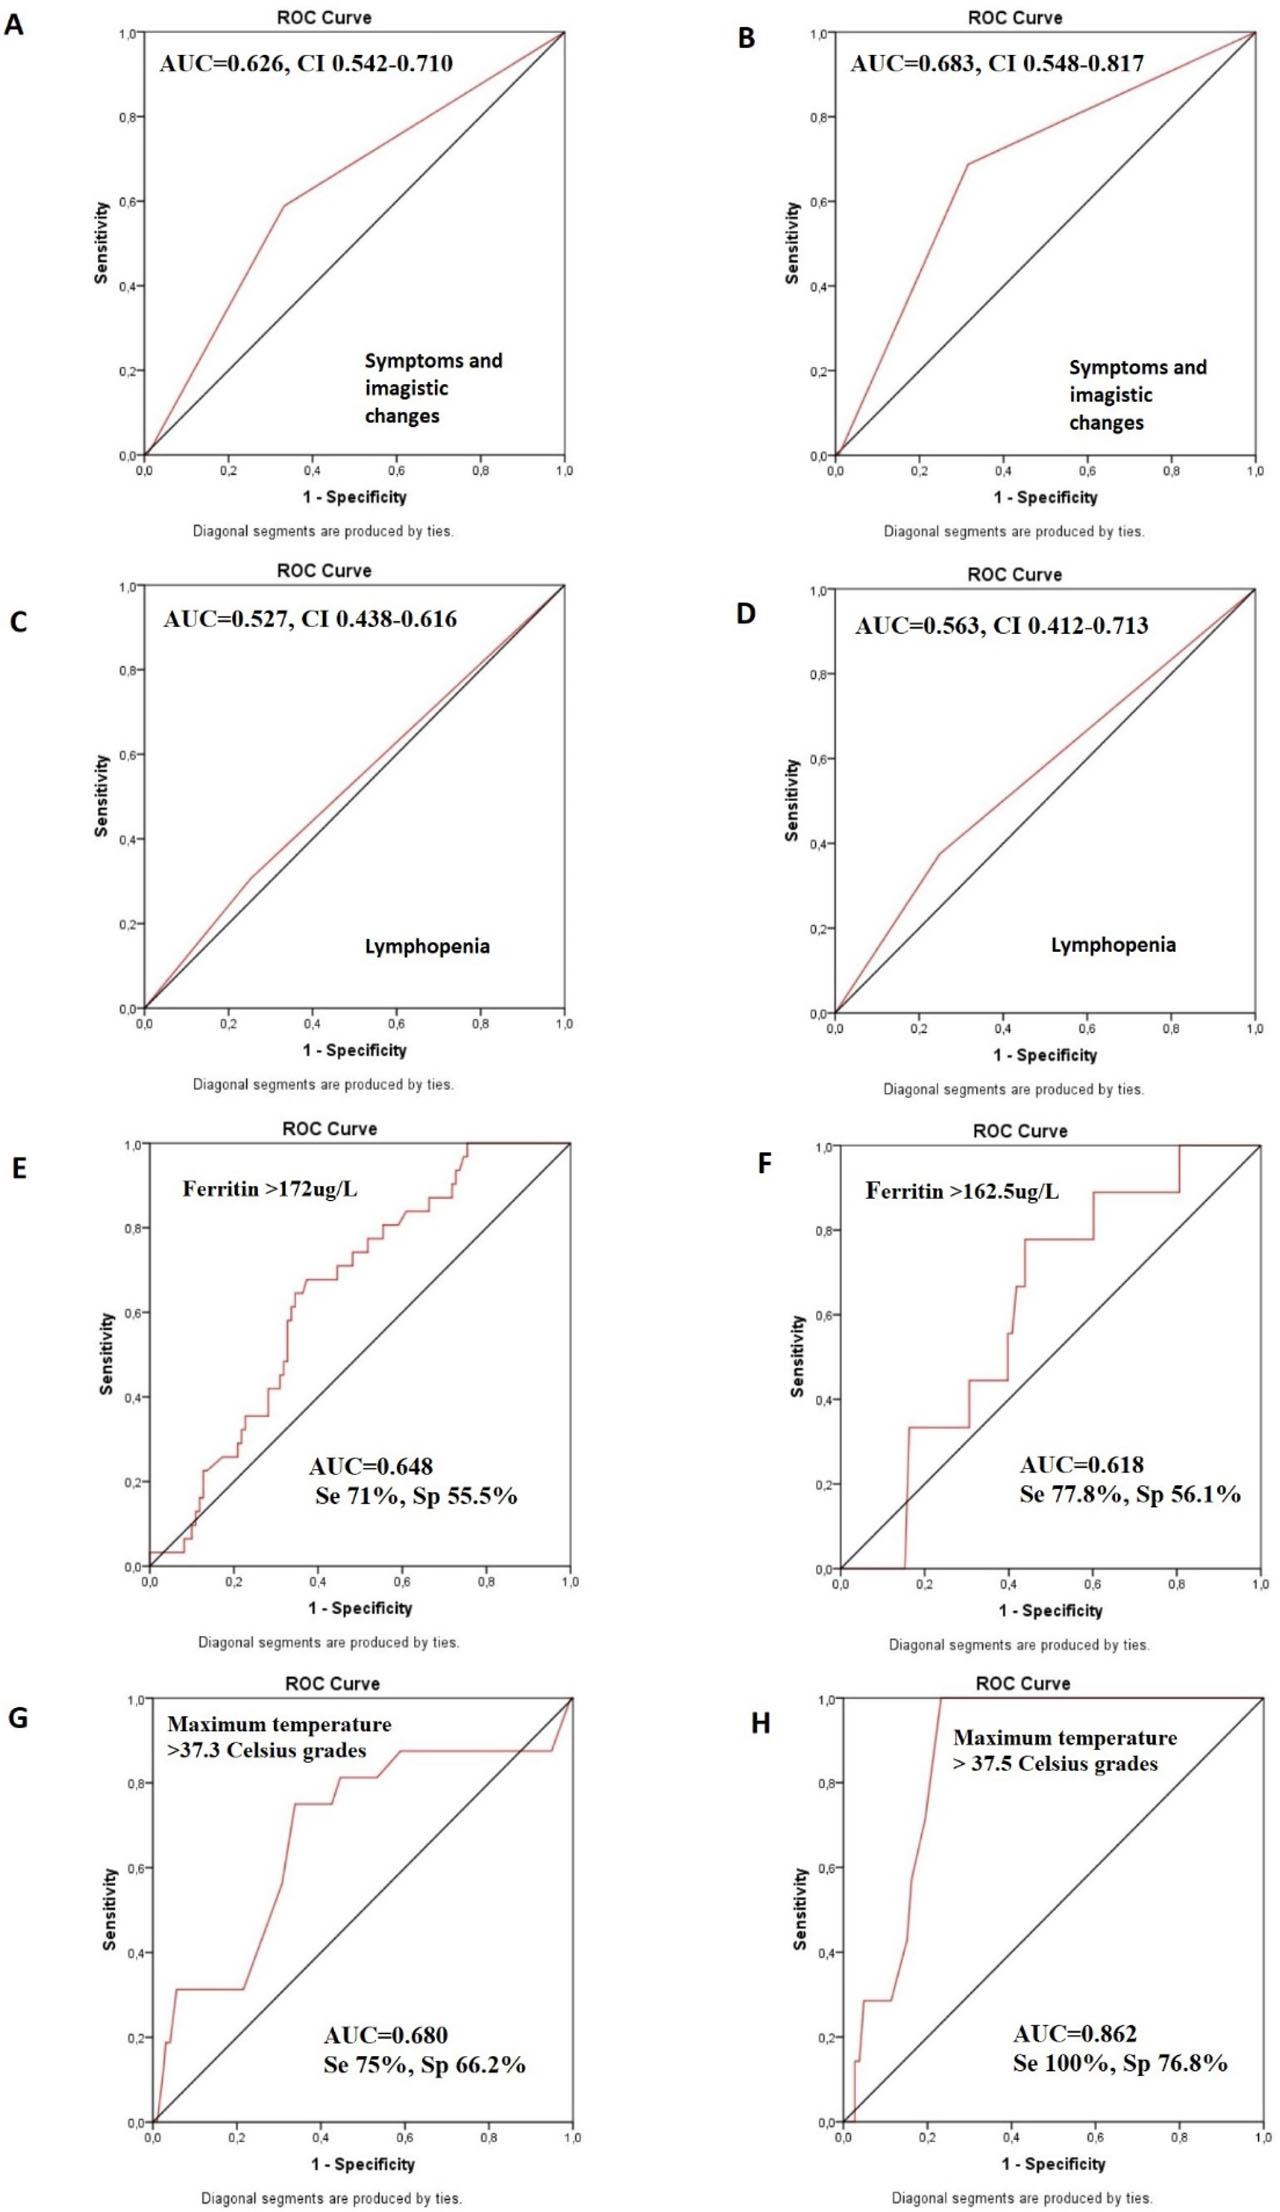
| Ferritin (ug/L) | 309.49 ± 435.33 | 377.22 ± 326.46 | 0.371 |
| Highest Troponin I (ng/ml) | 4647.97 ± 11089.05 | 2899.12 ± 5963.79 | 0.31 |
| Admission NTproBNP (pg/ml) | 4105.78 ± 7968.38 | 2623.6 ± 3993.31 | 0.27 |
| Admission aspartate aminotransferase (AST) (mg/dl) | 109.5 ± 335.36 | 55.24 ± 69.03 | 0.18 |
| Admission alanine aminotransferase (ALT) (mg/dl) | 68.2 ± 144.47 | 62.3 ± 134.07 | 0.76 |
| Admission urea (BUN) (mg/dl) | 57.66 ± 40.75 | 58.77 ± 40.28 | 0.84 |
| Admission creatinine (mg/dl) | 1.33 ± 1.23 | 1.59 ± 1.8 | 0.17 |
| Admission eGFR (estimated glomerular filtration rate) (ml/min) | 69.27 ± 30.78 | 66.11 ± 32.06 | 0.45 |
| Glycated hemoglobin (HbA1c) (%) | 6.59 ± 3.98 | 6.61 ± 1.18 | 0.97 |
| Admission activated partial thromboplastin time (aPTT) (s) | 36.65 ± 25.43 | 35.75 ± 15.78 | 0.78 |
| Admission creatine kinase (CK) (U/L) | 567.37 ± 1094.96 | 307.16 ± 530.52 | 0.06 |
| Admission creatine kinase myocardial band (CK-MB) (U/L) | 69.56 ± 132.41 | 26.85 ± 36.74 | 0.011 |
| Admission lactate dehydrogenase (LDH) (U/L) | 428.87 ± 420.59 | 320.05 ± 133.26 | 0.129 |
Multiple regression analysis for the result of the second RT-PCR test (positive/negative)_
| Pearson Coefficient of Correlation (R) | Coefficient of determination (R2) | P value | Odds Ratio (OR) | |
|---|---|---|---|---|
| Predictive model* | 0.828 | 0.686 | 0.014 | 1.035 |
Comparison between demographic, electrocardiographic, echocardiographic, clinical and imagistic parameters in negative retested and positive patient_
| Parameter | Negative patients | Positive patients | P value | |
|---|---|---|---|---|
| Age mean (years) | 65.07 ± 14.24 | 66.57 ± 13.12 | 0.42 | |
| Age maximum (years) | 92 | 95 | NA | |
| Age minimum (years) | 28 | 31 | NA | |
| Demographic data | Gender | 34.1% female, 65.9% male | 40% female, 60% male | 0.35 |
| Most frequent county of provenience | 60.6% Bucharest (capital) | 58.5% Bucharest (capital) | NA | |
| 9.8% Giurgiu | 8.6% Ilfov | |||
| 7.6% Ilfov | 7.1% Giurgiu | |||
| Atrial arrhythmias (%) | 25% | 35.7% | 0.08 | |
| ECG parameters | Ventricular arrhythmias (%) | 8.8% | 7.1% | 0.6 |
| Atrioventricular block | 6.9% | 10% | 0.38 | |
| Mitral regurgitation | 36.04% | 30% | 0.008 | |
| Mitral stenosis | 0.7% | 0 | 0.65 | |
| Aortic regurgitation | 7.06% | 4.28% | 0.15 | |
| Echocardiographic parameters | Aortic stenosis | 8.83% | 14.2% | 0.56 |
| LVEF mean (%) | 39.47 ± 12.46% | 41.72 ± 15.37% | 0.2 | |
| LVEF reduced (<40%) | 46.1% | 37.5% | 0.35 | |
| LVEF mid-range (≥40%, <50%) | 24.3% | 27.5% | 0.41 | |
| LVEF preserved (≥50%) | 29.6% | 35% | 0.18 | |
| Bronchial rales (%) | 11.9% | 11.4% | 0.6 | |
| Crackles (%) | 31.8% | 25.7% | 0.29 | |
| Low-grade fever (%) | 25.7% | 22.1% | 0.54 | |
| High-grade fever (%) | 7.3% | 18.6% | 0.004 | |
| Highest temperature during hospitalization (Celsius grades) | 36.67 ± 2.79 | 37.47 ± 0.78 | 0.15 | |
| SaO2 (arterial oxygen saturation) (%) | 93.95 ± 13.48 | 95.16 ± 3.47 | 0.56 | |
| Clinical parameters | Cough (%) | 34.8% | 54.3% | 0.003 |
| Myalgia (%) | 1.5% | 8.6% | 0.002 | |
| Dysphagia (%) | 1.5% | 1.4% | 0.6 | |
| Ageusia/Anosmia (%) | 0.4% | 1.4% | 0.72 | |
| Dyspnea (%) | 54.5% | 59.4% | 0.47 | |
| Digestive symptoms (nausea, vomiting, diarrhea) (%) | 1.1% | 2.9% | 0.29 | |
| Accentuation of the interstitial pattern on chest X-ray (%) | 75.8% | 81.4% | 0.2 | |
| Pulmonary condensation or alveolitis on the chest X-Ray (%) | 48.1% | 44.3% | 0.49 | |
| Pulmonary imaging | Ground-glass image on thoracic CT scan (%) | 6.4% | 11.4% | 0.06 |
| Subpleural condensation on thoracic CT scan (%) | 3.8% | 10% | 0.022 |