Figure 1
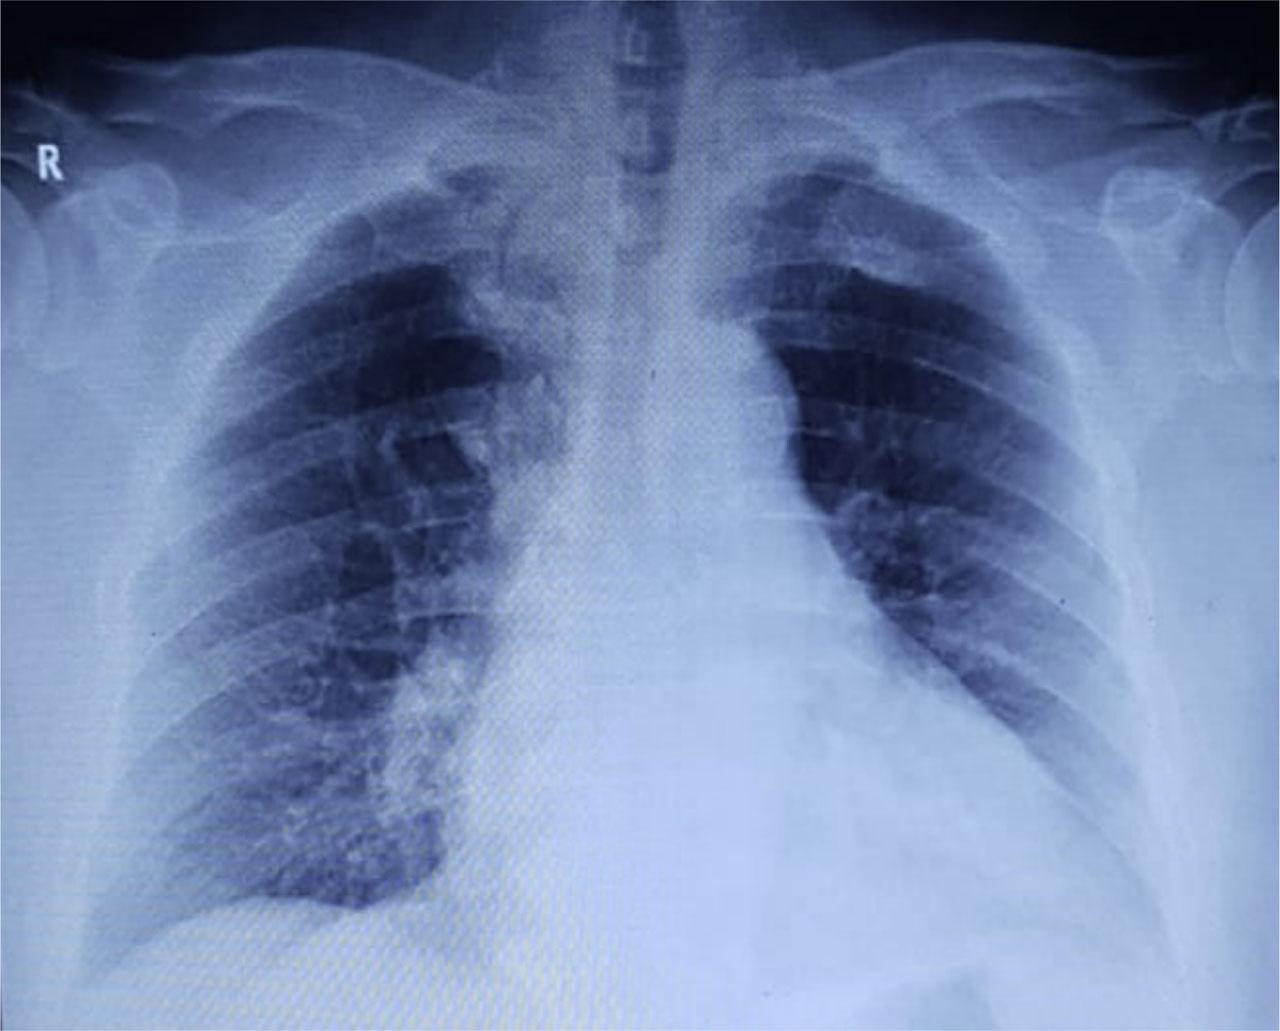
Figure 2
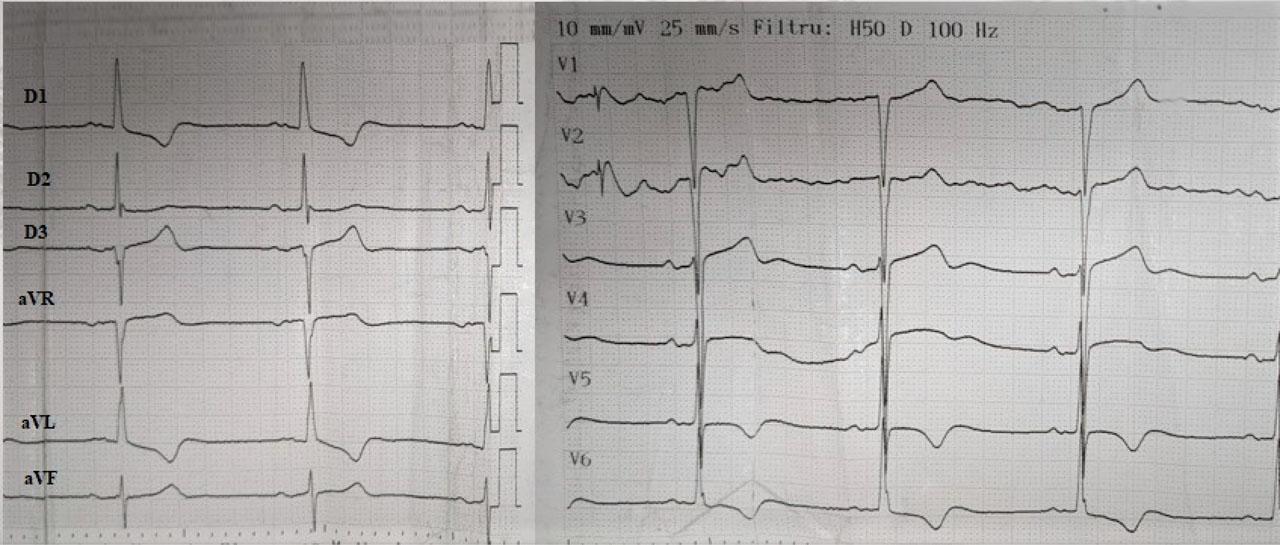
Figure 3
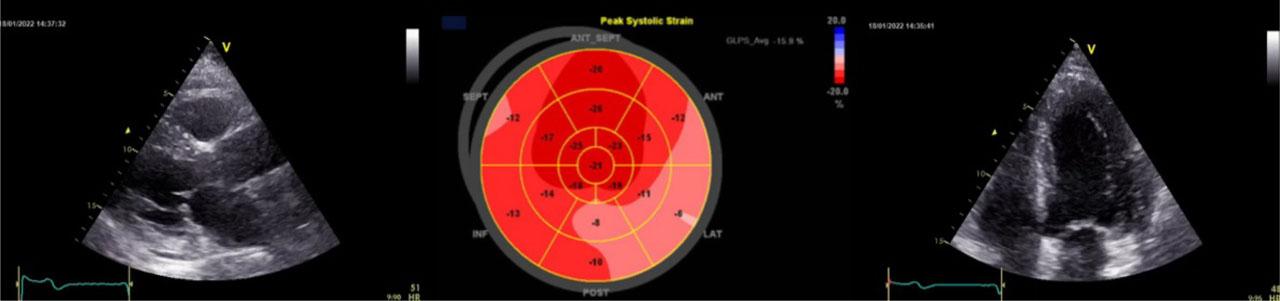
Figure 4
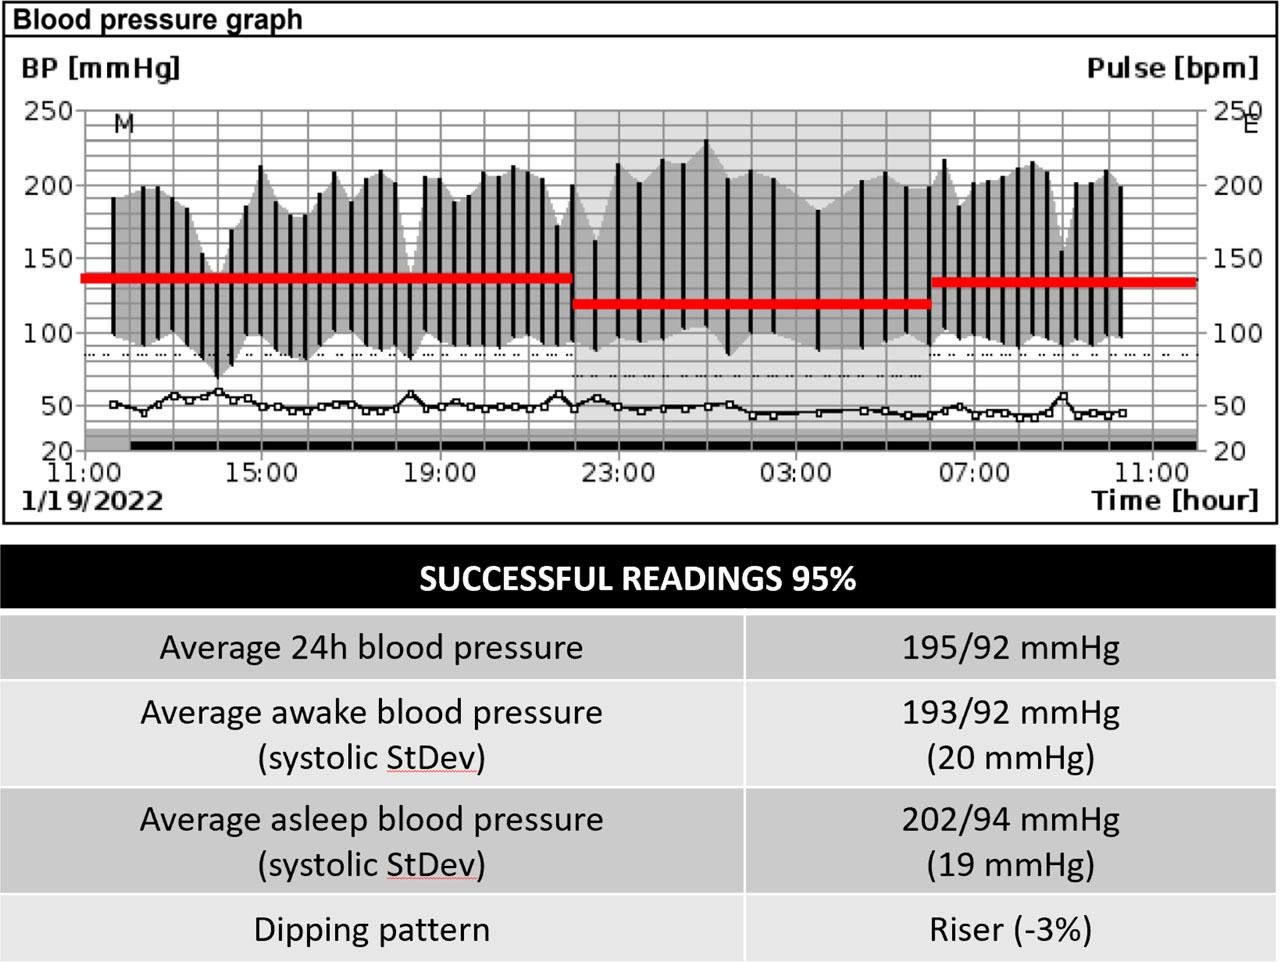
Figure 5
Figure 6

© 2022 Emma Weiss, Gabriel Sica, Ana Maria Balahura, Cristina Japie, Daniela Bartos, Lucian Calmac, Costin Minoiu, Laurentiu Gulie, Elisabeta Badila, published by Romanian Society of Cardiology
This work is licensed under the Creative Commons Attribution 4.0 License.