
Figure 1
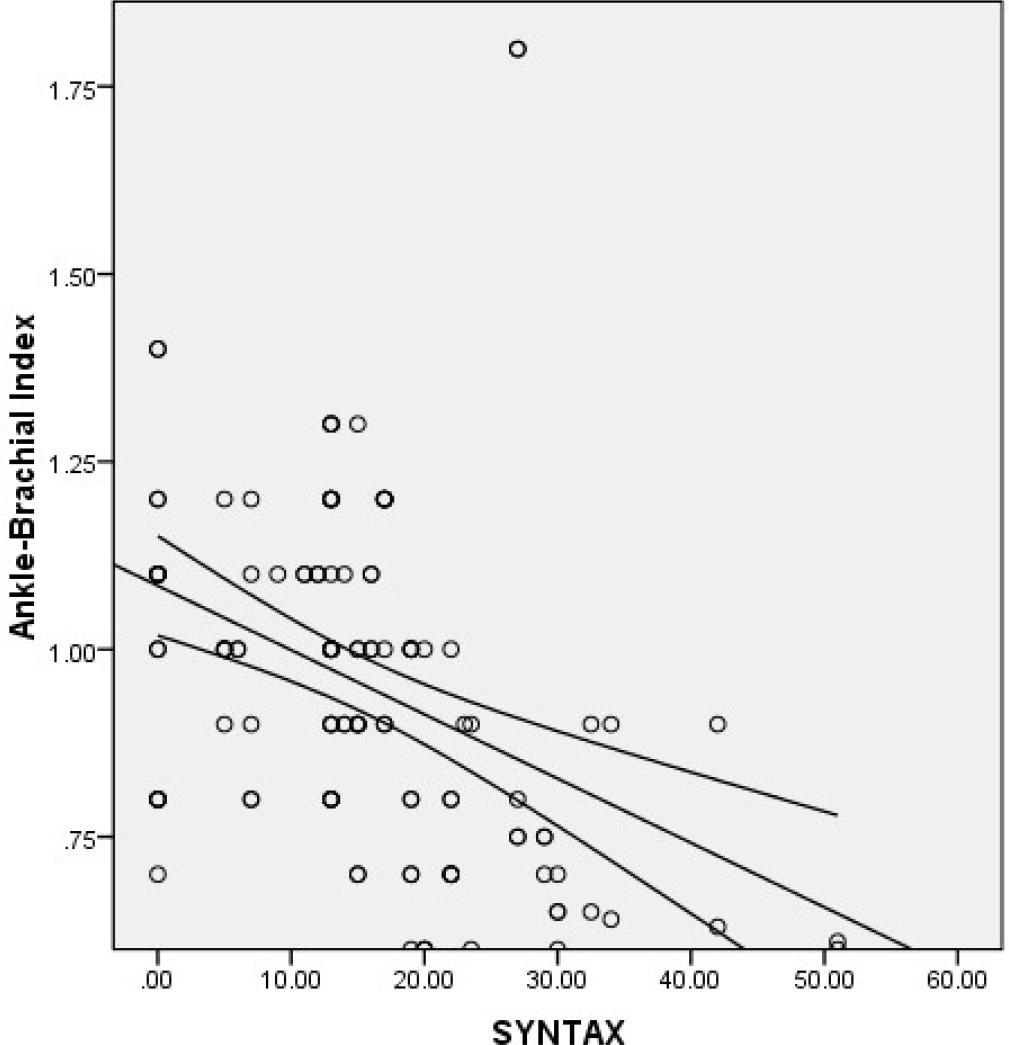
Figure 2
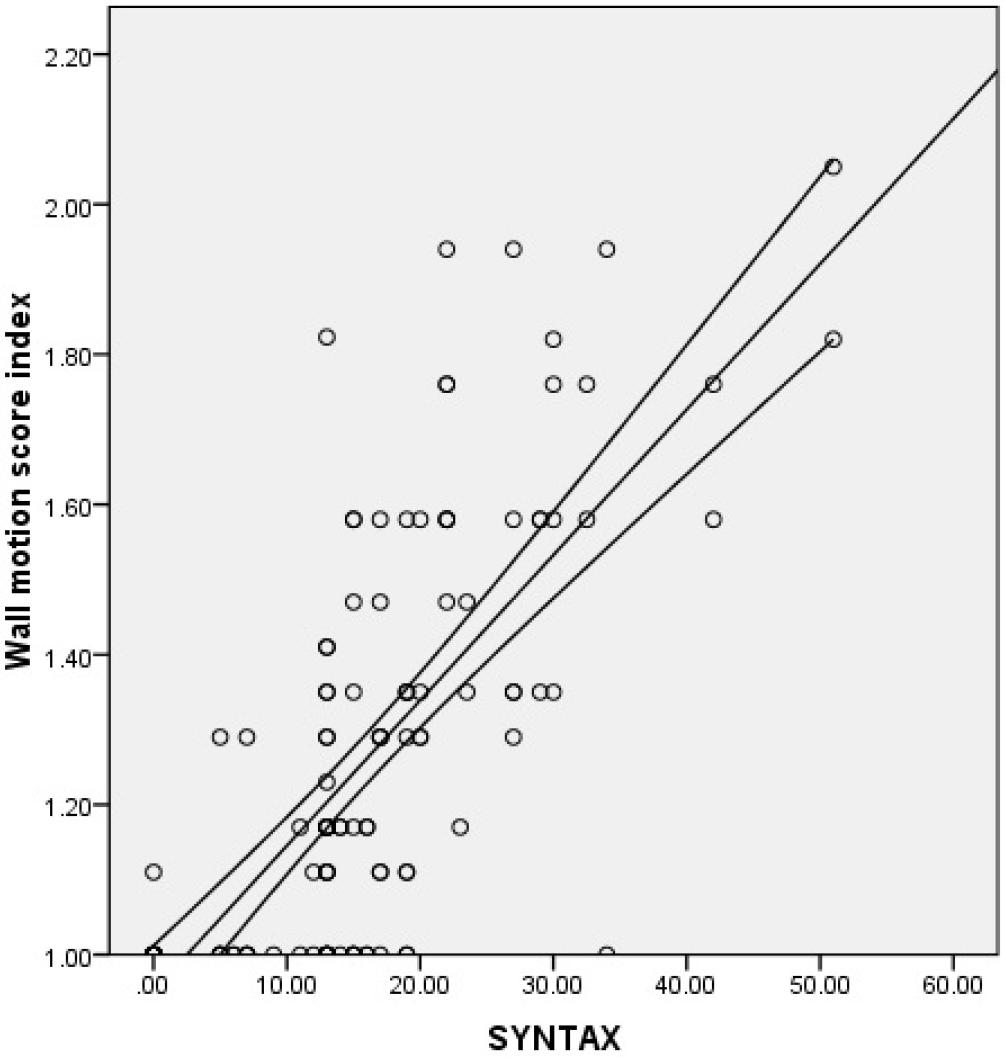
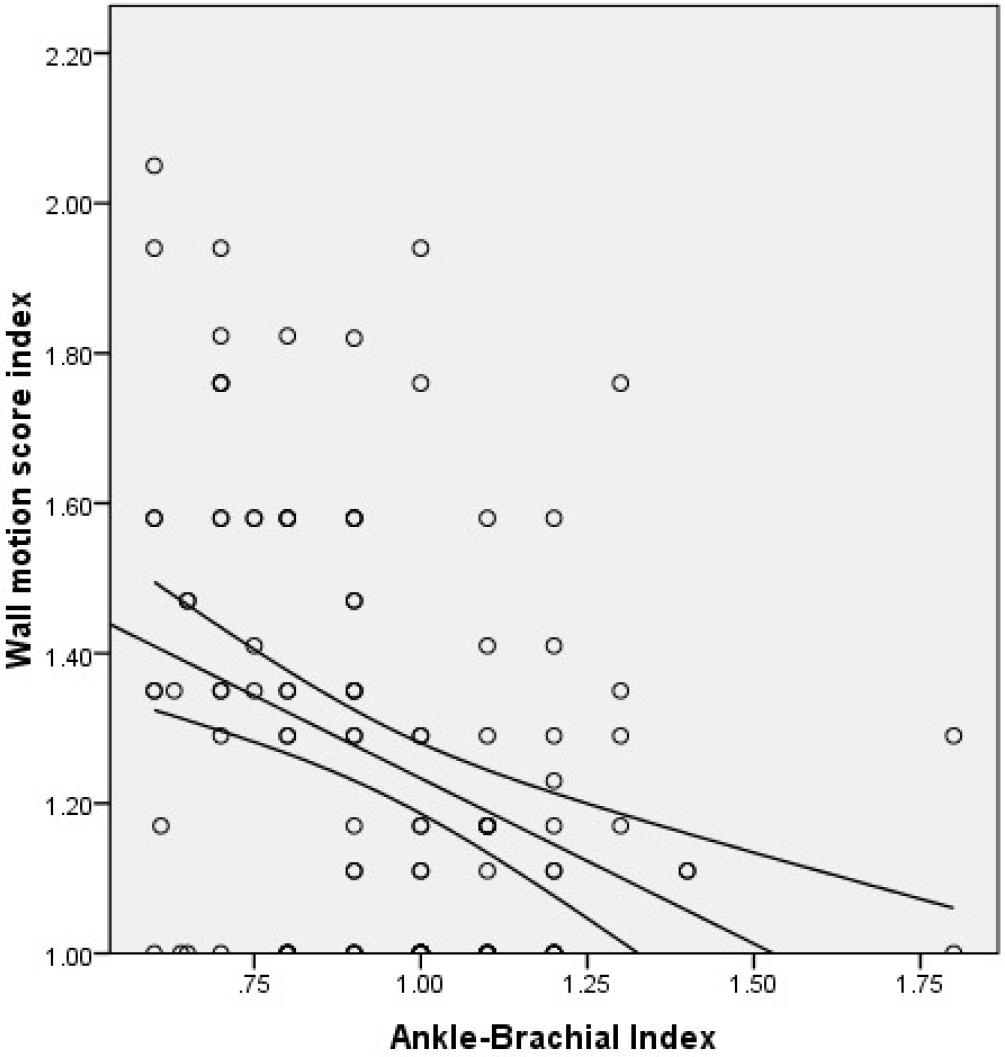
Figure 3
Sociodemographic, clinical, ECG, echocardiographic, laboratory, ABI, and angiographic characteristics of the two SYNTAX groups
| Parameters | Group A (n = 95) | Group B (n = 30) | P-value |
|---|---|---|---|
| Age (mean ± SD) in years | 54.79 ± 8.7 | 56.13 ± 10.8 | 0.49 |
| Sex, male (%) | 49 (51.6) | 19 (63.3) | 0.26 |
| Smoking (%) | 56 (58.9) | 21 (70) | 0.28 |
| Diabetes mellitus (%) | 22 (23.2) | 21 (70) | 0.001 |
| Hypertension (%) | 38 (40) | 16 (53.3) | 0.19 |
| Family history of IHD (%) | 8 (8.4) | 3 (10) | 0.79 |
| Dyslipidemia (%) | 71 (74.7) | 26 (86.7) | 0.17 |
| Diagnosis | |||
| – UA and NSTEMI (%) | 52 (54.7) | 14 (46.7) | 0.44 |
| – STEMI (%) | 43 (45.3) | 16 (53.3) | |
| Medications | |||
| – Beta blockers (%) | 94 (98.9) | 29 (96.7) | 0.39 |
| – ACE-inhibitors/ARBs (%) | 73 (76.8) | 23 (76.7) | 0.98 |
| – Calcium channel blockers (%) | 4 (4.2) | 2 (6.7) | 0.58 |
| ECG, abnormal (%) | 74 (77.9) | 27 (90) | 0.14 |
| EF (mean ± SD) | 56.91 ± 9.9 | 51.53 ± 11.7 | 0.02 |
| RWMA (%) | 51 (53.7) | 26 (86.7) | 0.001 |
| WMSI (mean ± SD) | 1.20 ± 0.26 | 1.44 ± 0.27 | 0.001 |
| Lipogram | |||
| – Total cholesterol (mean ± SD) | 192.63 ± 41.9 | 236.27 ± 26.7 | 0.001 |
| – Triglycerides (mean ± SD) | 178.06 ± 49.4 | 205.73 ± 34.6 | 0.02 |
| – LDL (mean ± SD) | 123.00 ± 23.7 | 155.77 ± 21.9 | 0.001 |
| – HDL (mean ± SD) | 37.47 ± 7.1 | 39.43 ± 6.9 | 0.19 |
| ABI (mean ± SD) | 0.99 ± 0.2 | 0.81 ± 0.3 | 0.001 |
| – <0.9 (%) | 34 (35.8) | 27 (90) | 0.001 |
| – ≥0.9 (%) | 61 (64.2) | 3 (10) | |
| Number of affected vessels (mean ± SD) | 1.31 ± 0.9 | 3.0 ± 0.5 | 0.001 |
| – Nonsignificant or one vessel (%) | 61 (64.2) | 0 (0) | 0.001 |
| – Two or more vessels (%) | 34 (35.8) | 30 (100) | |
Sociodemographic, clinical, ECG, echocardiographic, laboratory, ABI, and angiographic characteristics of our study population
| Parameters | N = 125 |
|---|---|
| Age (mean ± SD) in years | 55.11 ± 9.25 |
| Sex, male (%) | 68 (54.4) |
| Smoking (%) | 77 (61.6) |
| Diabetes mellitus (%) | 43 (34.4) |
| Hypertension (%) | 54 (43.2) |
| Family history of IHD (%) | 11 (8.8) |
| Dyslipidemia (%) | 97 (77.6) |
| Diagnosis | |
| – UA (%) | 46 (36.8) |
| – STEMI (%) | 59 (47.2) |
| – NSTEMI (%) | 20 (16.0) |
| Medications | |
| – Beta blockers (%) | 123 (98.8) |
| – ACE-inhibitors/ARBs (%) | 96 (76.8) |
| – Calcium channel blockers (%) | 6 (4.8) |
| ECG, abnormal (%) | 101 (80.8) |
| Ejection fraction (mean ± SD) | 55.62 ± 10.56 |
| Wall motion abnormalities (%) | 77 (61.6) |
| WMSI (mean ± SD) | 1.26 ± 0.28 |
| Lipogram | |
| – Total cholesterol (mean ± SD) | 203.10 ± 43.00 |
| – Triglycerides (mean ± SD) | 184.70 ± 47.65 |
| – LDL (mean ± SD) | 130.86 ± 27.12 |
| – HDL (mean ± SD) | 37.94 ± 7.09 |
| ABI (mean ± SD) | 0.95 ± 0.23 |
| – <0.9 (%) | 61 (48.8) |
| – ≥0.9 (%) | 64 (51.2) |
| SYNTAX score (mean ± SD) | 18.55 ± 10.42 |
| – Low (0–22) (%) | 68 (54.4) |
| – Moderate (23–32) (%) | 27 (21.6) |
| – High (≥33) (%) | 30 (24) |
| Number of affected vessels (mean ± SD) | 1.71 ± 1.08 |
| – Nonsignificant (%) | 17 (13.6) |
| – One (%) | 44 (35.2) |
| – Two (%) | 22 (17.6) |
| – Three or more (%) | 42 (33.6) |
Sociodemographic, clinical, ECG, echocardiographic, laboratory, and angiographic characteristics of the two ABI groups
| Parameters | Group I (n = 64) | Group II (n = 61) | P-value |
|---|---|---|---|
| Age (mean ± SD) in years | 55.33 ± 8.9 | 54.89 ± 9.7 | 0.79 |
| Sex, male (%) | 37 (57.8) | 31 (50.8) | 0.43 |
| Smoking (%) | 32 (50) | 45 (73.8) | 0.006 |
| Diabetes mellitus (%) | 14 (21.9) | 29 (47.5) | 0.003 |
| Hypertension (%) | 25 (39.1) | 29 (47.5) | 0.33 |
| Family history of IHD (%) | 6 (9.4) | 5 (8.2) | 0.82 |
| Dyslipidemia (%) | 49 (76.6) | 48 (78.7) | 0.78 |
| Diagnosis | |||
| – UA and NSTEMI (%) | 38 (59.4) | 28 (45.9) | 0.13 |
| – STEMI (%) | 26 (40.6) | 33 (54.1) | |
| Medications | |||
| – Beta-blockers (%) | 63 (98.4) | 60 (98.4) | 0.97 |
| – ACE-inhibitors/ARBs (%) | 48 (75) | 48 (78.7) | 0.63 |
| – Calcium channel blockers (%) | 2 (3.1) | 4 (6.6) | 0.37 |
| ECG, abnormal (%) | 50 (78.1) | 51 (83.6) | 0.44 |
| EF (mean ± SD) | 57.16 ± 9.9 | 54.00 ± 11.1 | 0.095 |
| RWMA (%) | 31 (48.4) | 46 (75.4) | 0.002 |
| WMSI (mean ± SD) | 1.14 ± 0.21 | 1.37 ± 0.29 | 0.001 |
| Lipogram | |||
| – Total cholesterol (mean ± SD) | 184.88 ± 40.3 | 222.23 ± 37.3 | 0.001 |
| – Triglycerides (mean ± SD) | 177.80 ± 56.8 | 191.95 ± 34.6 | 0.097 |
| – LDL (mean ± SD) | 121.91 ± 25.4 | 140.26 ± 25.8 | 0.001 |
| – HDL (mean ± SD) | 38.05 ± 8.4 | 37.84 ± 5.5 | 0.87 |
| SYNTAX score (mean ± SD) | 11.11 ± 7.0 | 20.21 ± 11.4 | 0.001 |
| – Low (0–32) (%) | 61 (95.3) | 34 (55.7) | 0.001 |
| – High (≥33) (%) | 3 (4.7) | 27 (44.3) | |
| Number of affected vessels (mean ± SD) | 1.25 ± 0.9 | 2.20 ± 1.0 | 0.001 |
| – Nonsignificant or one vessel (%) | 45 (70.3) | 16 (26.2) | 0.001 |
| – Two or more vessels (%) | 19 (29.7) | 45 (73.8) | |
Logistic regression model for the predictors of high SYNTAX score
| Factor | Bivariate | Multivariable | ||
|---|---|---|---|---|
| OR (95% CI) | P-value | AOR (95% CI) | P-value | |
| Age/years | 1.016 (0.971–1.064) | =0.487 | 1.011 (0.919–1.080) | =0.928 |
| Sex (male) | 1.622 (0.697–3.773) | =0.262 | 2.208 (0.828–5.889) | =0.114 |
| ABI (<0.9) | 16.15 (4.65–57.18) | <0.001 | 10.95 (1.87–24.18) | =0.008 |
| EF% | 0.953 (0.916–0.992) | =0.018 | 0.938 (0.861–0.984) | =0.041 |
| WMSI | 10.71 (9.75–11.92) | <0.001 | 7.63 (5.65–9.23) | =0.004 |
| No. of affected vessels | 3.242 (0.024–12.03) | <0.001 | 2.413 (1.033–6.118) | 0.044 |