

Figure 1
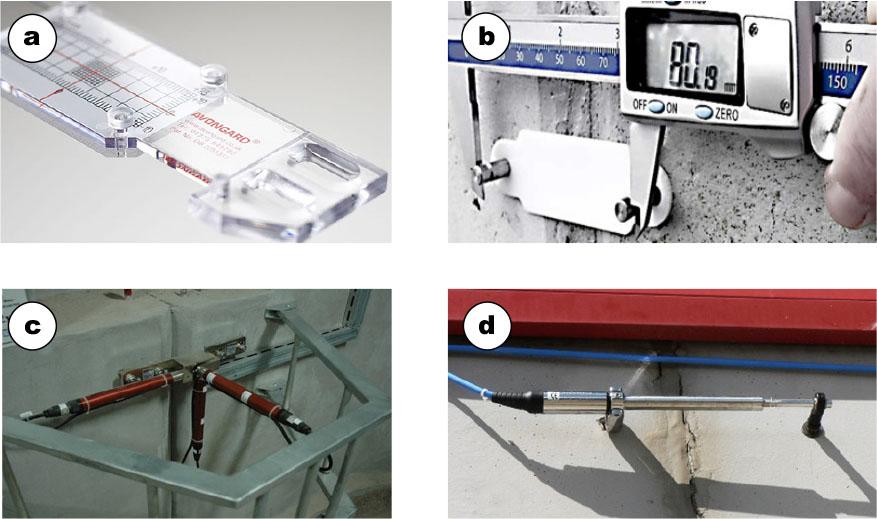
Figure 2
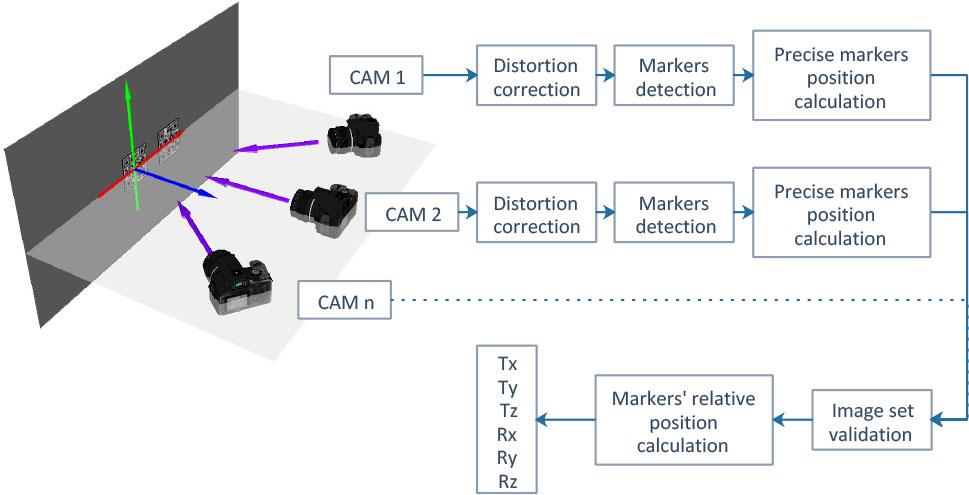
Figure 3
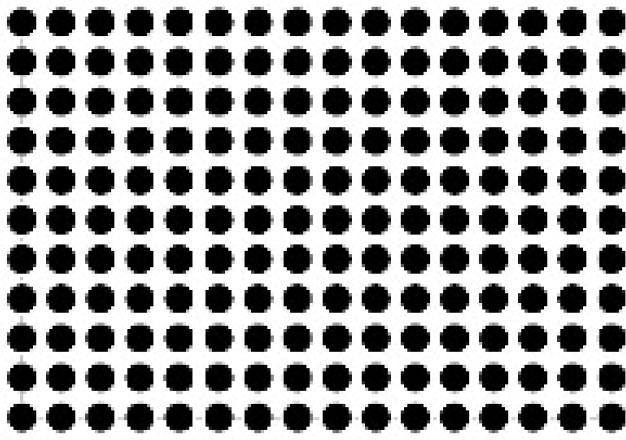
Figure 4
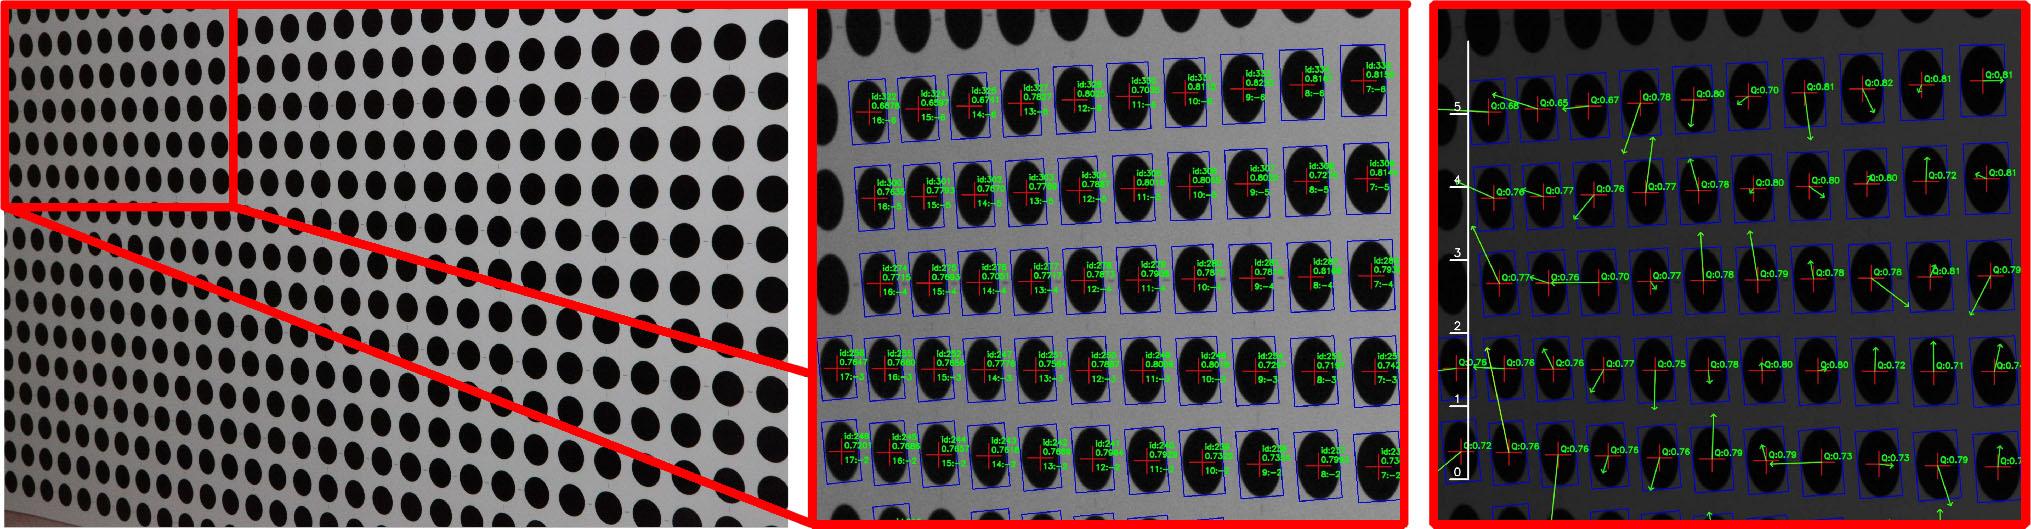
Figure 5

Figure 6
Figure 7
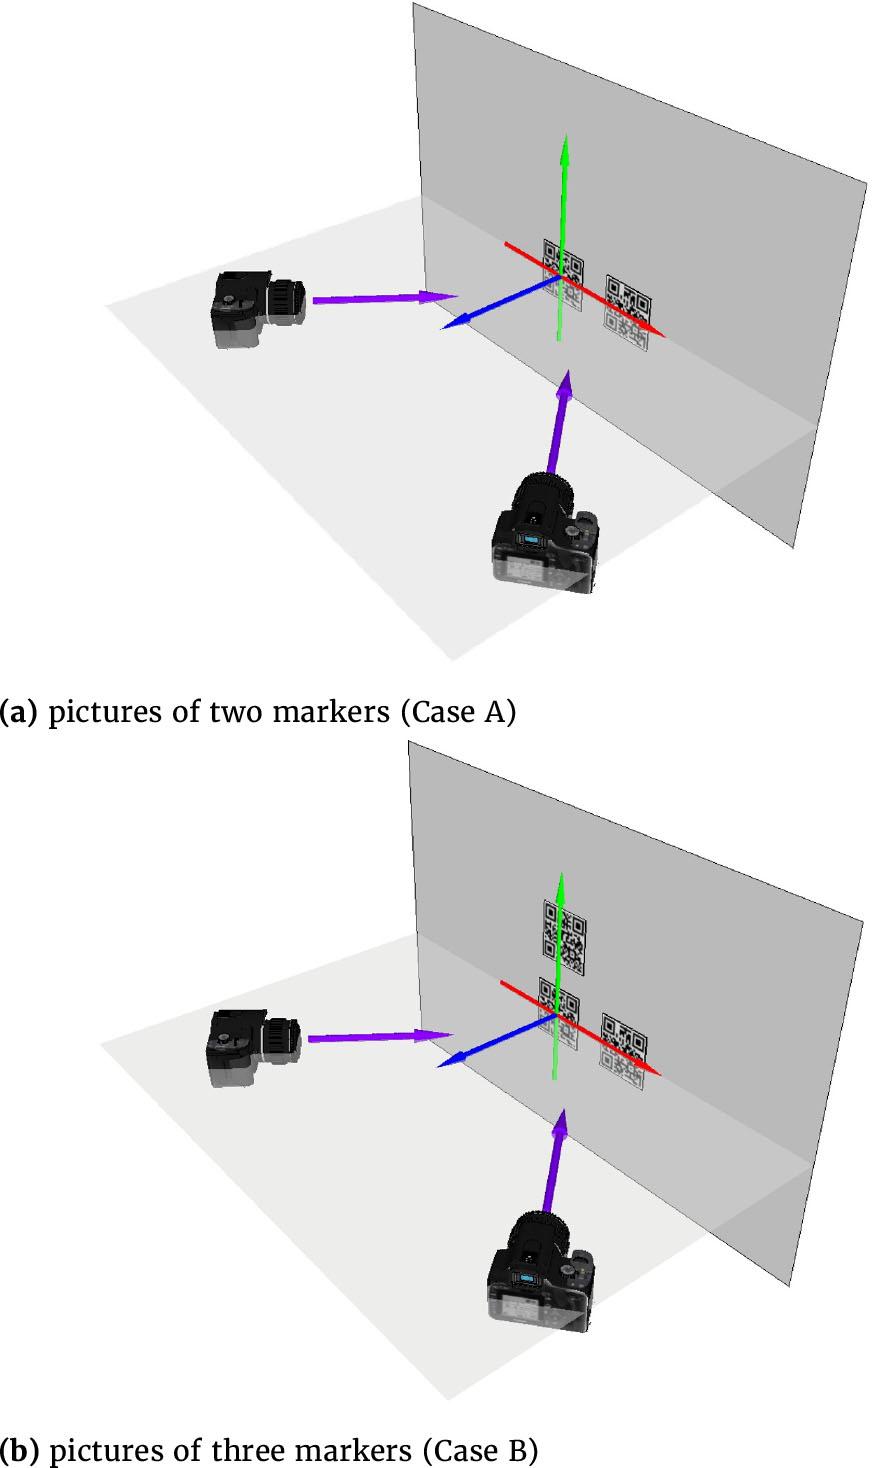
Figure 8
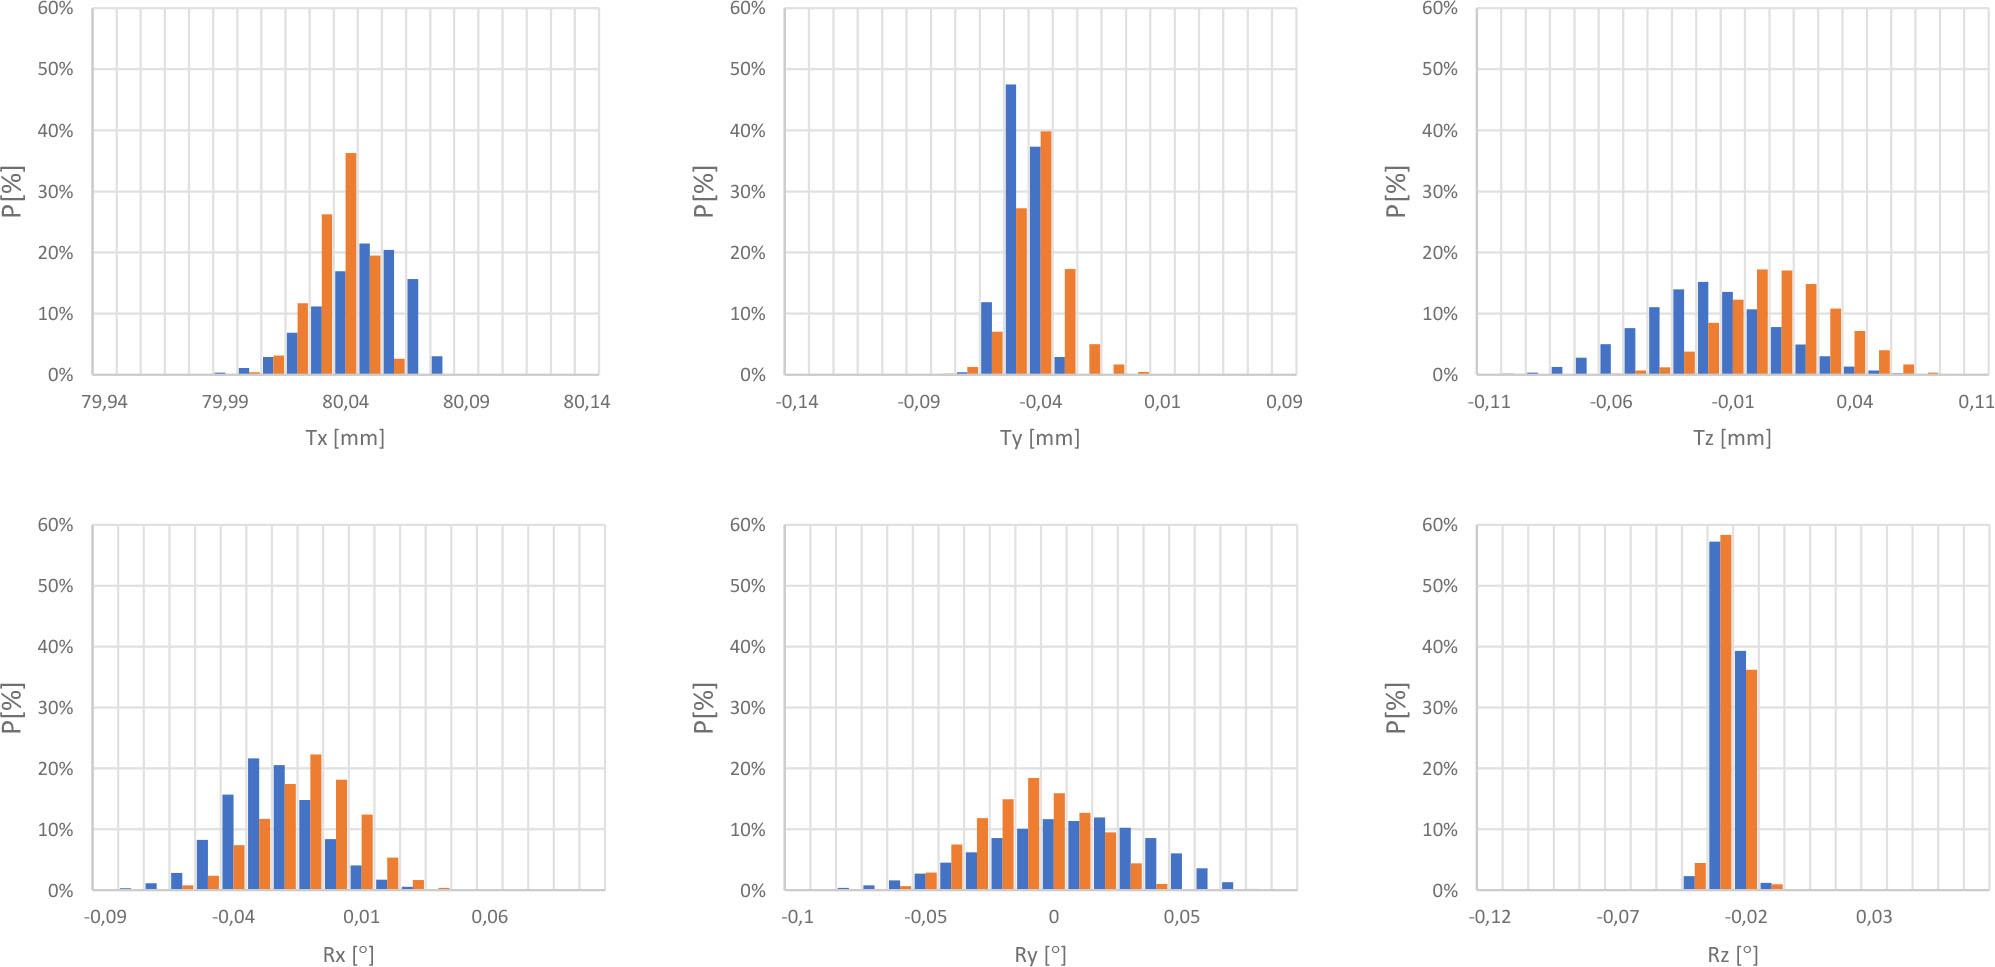
Figure 9
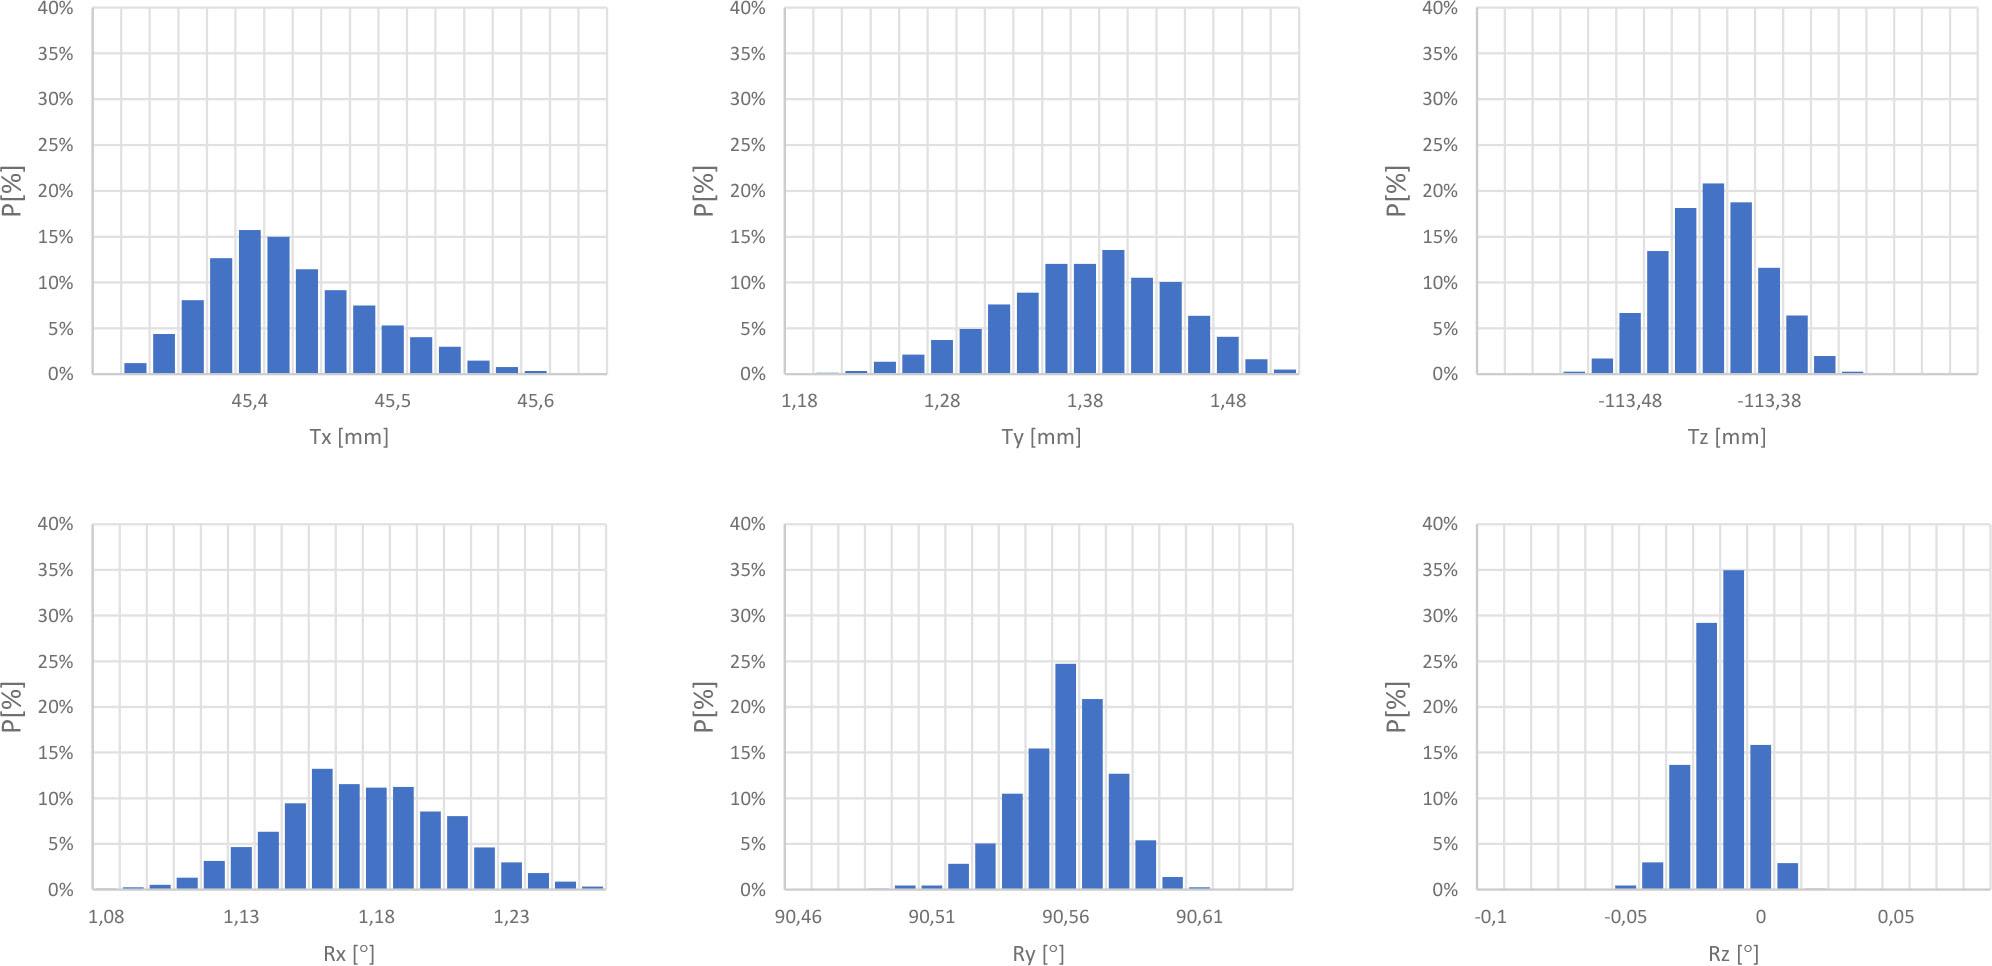
Figure 10
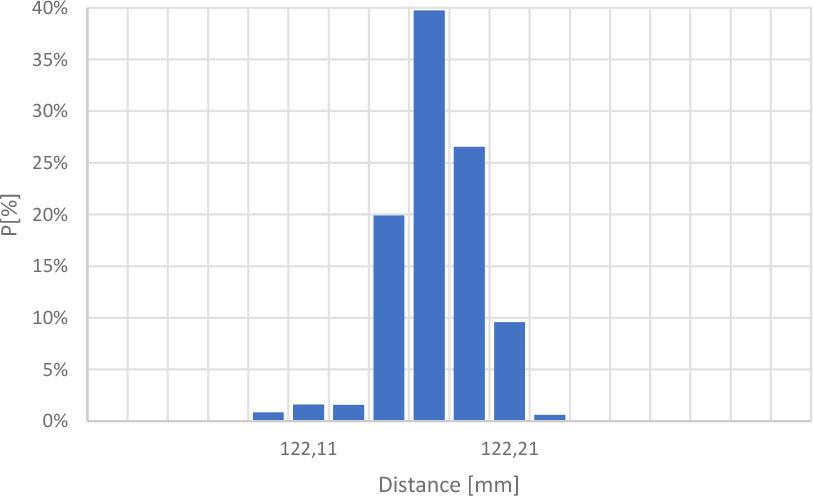
Figure 11
Case A (number of pictures: 42; number of analysed pairs of pictures: 439)
| Average | Standard deviation | Minimum | Maximum | |
|---|---|---|---|---|
| Tx [mm] | 110.852 | 0.020 | 110.813 | 110.917 |
| Ty [mm] | −1.999 | 0.008 | −2.024 | −1.978 |
| Tz [mm] | 2.220 | 0.028 | 2.150 | 2.291 |
| Rx [deg] | −0.014 | 0.011 | −0.050 | 0.018 |
| Ry [deg] | −0.057 | 0.023 | −0.121 | −0.010 |
| Rz [deg] | 0.227 | 0.006 | 0.215 | 0.240 |
Case C (number of photos: 36; number of photo pairs: 160)
| Average | Standard deviation | Minimum | Maximum | |
|---|---|---|---|---|
| Tx [mm] | 90.999 | 0.027 | 90.921 | 91.059 |
| Ty [mm] | −12.118 | 0.025 | −12.184 | −12.060 |
| Tz [mm] | −78.360 | 0.028 | −78.454 | −78.306 |
| Rx [deg] | −2.636 | 0.017 | −2.680 | −2.593 |
| Ry [deg] | 89.827 | 0.019 | 89.776 | 89.872 |
| Rz [deg] | −6.549 | 0.007 | −6.572 | −6.533 |
| Distance [mm] | 120.698 | 0.020 | 120.645 | 120.760 |
Case B (number of pictures: 44; number of analysed pairs of pictures: 467)
| Average | Standard deviation | Minimum | Maximum | |
|---|---|---|---|---|
| Tx [mm] | 110.839 | 0.010 | 110.811 | 110.870 |
| Ty [mm] | −1.982 | 0.011 | −2.009 | −1.946 |
| Tz [mm] | 2.233 | 0.022 | 2.172 | 2.291 |
| Rx [deg] | −0.005 | 0.010 | −0.037 | 0.019 |
| Ry [deg] | −0.072 | 0.018 | −0.114 | −0.013 |
| Rz [deg] | 0.230 | 0.005 | 0.214 | 0.243 |